
Key Takeaways:
- Record Backlog: Terex ended Q2 with $6.9 billion in backlog after bookings jumped 25% year-over-year.
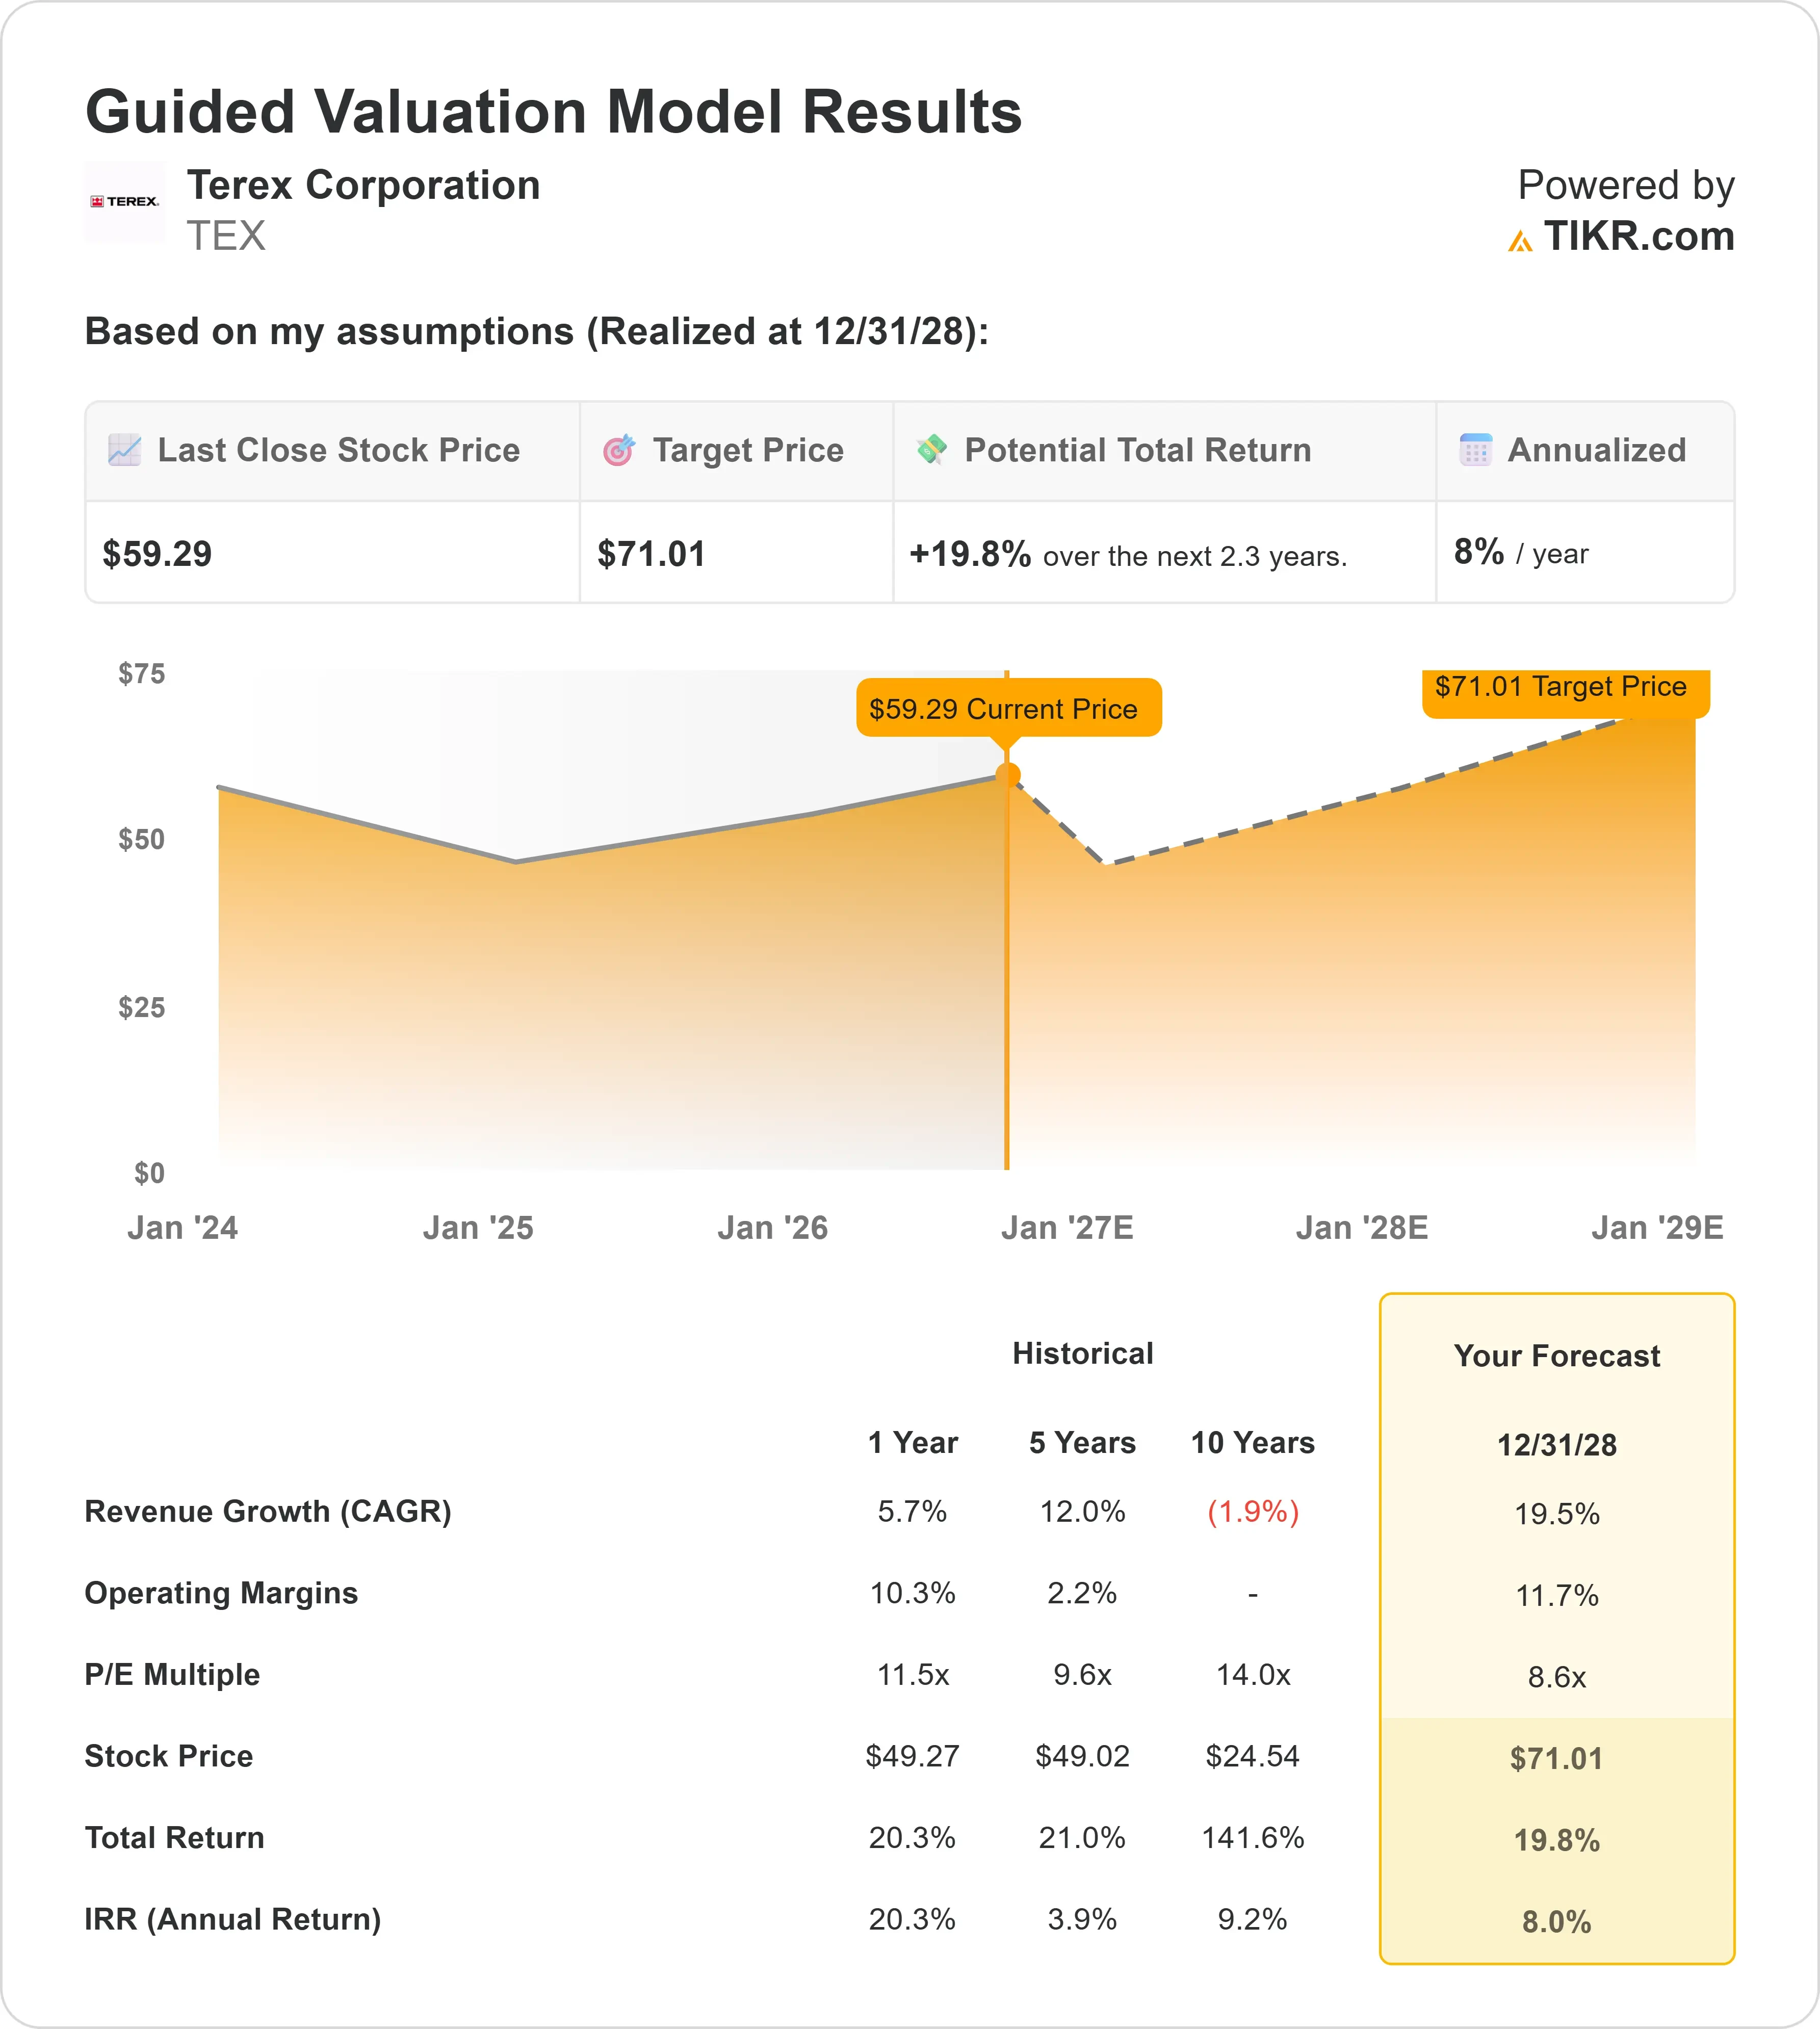
- Price Projection: Based on current execution, TEX stock could reach $71.01 by December 2028.
- Potential Gains: This target implies a total return of 19.8% from the current price of $59.29.
- Annual Return: Investors could see roughly 8% annual growth over the next 2.3 years.
Now Live: Discover how much upside your favorite stocks could have using TIKR’s new Valuation Model (It’s free)>>>
Terex (TEX) just delivered a strong Q2, with revenue climbing 8.5% to $2.2 billion and adjusted EBITDA up nearly 11% to $269 million. Every segment grew, and bookings jumped 25% year over year, pushing backlog to $6.9 billion.
CEO Simon Meester pointed to a broad demand pickup. U.S. nonresidential construction starts rose 18% this year, fueled by data centers, energy projects, and infrastructure work. Terex is riding that wave across multiple businesses.
The Specialty Vehicles segment, built around last year’s REV Group merger, posted record earnings as demand for fire trucks and ambulances stayed strong. Chicago alone ordered 80 fire trucks and 40 ambulances during the quarter.
Materials Processing also had a standout quarter, with margins expanding 440 basis points to 18.8% on stronger crusher and material handling demand.
Management raised full-year guidance on this momentum, now expecting sales of $7.9 billion to $8.2 billion and adjusted EBITDA of $960 million to $1 billion.
One thing to watch: Terex is running a strategic review of its Aerials segment, with interest from multiple potential buyers. No decision has been announced yet.
Despite the strong quarter, TEX trades at $59.29. Our model sees modest but real upside from here.
See analysts’ full growth forecasts and estimates for TEX stock (It’s free) >>>
What the Model Says for Terex Stock
Terex looks very different today than it did a few years ago. Two major deals, the ESG acquisition and the REV Group merger, have reshaped the company into four segments: Environmental Solutions, Materials Processing, Specialty Vehicles, and Aerials.
- Environmental Solutions benefits from steady, recurring demand. Utilities work tied to grid modernization and data center power needs is accelerating, while the refuse collection vehicle business is recovering after a temporary inventory reset earlier in the year.
- Materials Processing is riding infrastructure and data center construction in the U.S., its largest market, while India and Australia add further growth from infrastructure and mining activity respectively.
- Specialty Vehicles, boosted by the REV Group merger, delivered record quarterly earnings. Management is investing in new plant capacity in Florida and South Dakota to shorten lead times and meet strong municipal demand for fire trucks and ambulances.
Using a forecast of 19.5% annual revenue growth and 11.7% net income margins, our model projects the stock could climb to $71.01 within 2.3 years. This assumes an 8.6x price-to-earnings multiple, below Terex’s current 11.5x multiple.
Our Valuation Assumptions
Estimate a company’s fair value instantly (Free with TIKR) >>>
Our Valuation Assumptions
TIKR’s Valuation Model lets you plug in your own assumptions for a company’s revenue growth, operating margins, and P/E multiple, and calculates the stock’s expected returns.
Here’s what we used for TEX stock:
1. Revenue Growth: 19.5%
Terex grew revenue 5.7% over the past year, but bookings up 25% and record backlog point to faster growth ahead.
Raised full-year guidance already implies about 7.4% growth at the midpoint, with Aerials and Materials Processing both upgraded during the quarter.
2. Operating margins: 11.7%
Net income margin sat at 5.5% over the trailing twelve months.
Management has flagged 22% incremental EBITDA margins this year despite higher tariffs, and expects further improvement in Environmental Solutions as utility capacity investments start paying off.
So the operating margin estimate has been raised to 11.7%, above the current margin.
3. Exit P/E Multiple: 8.6x
TEX currently trades at a 10.9x forward P/E, below its one-year average of 11.5x and well under its 10-year average of 14x.
Our model assumes further compression to 8.6x, a more conservative stance given ongoing tariff and mix uncertainty.
Build your own Valuation Model to value any stock (It’s free!) >>>
What Happens If Things Go Better or Worse?
Terex’s results depend on how well it integrates recent acquisitions and how construction and municipal spending trends play out. Here’s how the stock might perform under different scenarios through December 2028:
- Low Case: If revenue growth slows to a 10.7% CAGR and net income margins settle at 7.6%, investors could see a slight loss of 0.3% total return (-0.1% annually).
- Mid Case: With 11.8% growth and 7.9% margins, we expect a total return of 27.6% (5.8% annually).
- High Case: If construction demand accelerates and synergies from the REV and ESG deals outperform, driving 12.9% revenue growth and 8.1% margins, returns could reach 59.0% total (11.3% annually).

See what analysts think about TEX stock right now (Free with TIKR) >>>
The range reflects execution on construction demand acceleration and synergies from the REV and ESG deals outperform and other factors like tariffs and other things.
In the worst case, REV and ESG do not perform as expected and hence results actually go a bit downhill from current level.
In the best case, construction demand acceleration and synergies from the REV and ESG deals outperform so results show substantial improvement.
How Much Upside Does Terex Stock Have From Here?
With TIKR’s new Valuation Model tool, you can estimate a stock’s potential share price in under a minute.
All it takes is three simple inputs:
- Revenue Growth
- Operating Margins
- Exit P/E Multiple
If you’re not sure what to enter, TIKR automatically fills in each input using analysts’ consensus estimates, giving you a quick, reliable starting point.
From there, TIKR calculates the potential share price and total returns under Bull, Base, and Bear scenarios so you can quickly see whether a stock looks undervalued or overvalued.
See a stock’s true value in under 60 seconds (Free with TIKR) >>>
Looking for New Opportunities?
- See what stocks billionaire investors are buying so you can follow the smart money.
- Analyze stocks in as little as 5 minutes with TIKR’s all-in-one, easy-to-use platform.
- The more rocks you overturn… the more opportunities you’ll uncover. Search 100K+ global stocks, global top investor holdings, and more with TIKR.
Disclaimer:
Please note that the articles on TIKR are not intended to serve as investment or financial advice from TIKR or our content team, nor are they recommendations to buy or sell any stocks. We create our content based on TIKR Terminal’s investment data and analysts’ estimates. Our analysis might not include recent company news or important updates. TIKR has no position in any stocks mentioned. Thank you for reading, and happy investing!