Key Stats for Credo Technology Stock
- Price change for Credo Technology stock in last 6 months: 81%
- $CRDO Stock Price as of Sep. 1: $207
- 52-Week High: $309
- $CRDO Stock Price Target: $283
Now Live: Discover how much upside your favorite stocks could have using TIKR’s new Valuation Model (It’s free)>>>
What Happened?
Credo Technology (CRDO) stock dropped 9% on Tuesday and another 8% in pre-market trading on Wednesday, even after the company beat expectations on both revenue and earnings for fiscal Q1 2027.
- Adjusted earnings per share came in at $1.20, ahead of the $1.17 analysts expected.
- Revenue hit $479 million, topping the $470 million consensus and marking a 114.7% jump from a year earlier.
CEO Bill Brennan pointed to strong growth across the board, noting revenue rose 115% year over year while adjusted net income climbed 140% to $236 million. Revenue also grew 9.6% compared to the prior quarter.
On profitability, GAAP diluted net income per share came in at $0.67, while adjusted diluted net income per share was $1.20.
GAAP gross margin was 64.5%, and adjusted gross margin reached 68.0%. Adjusted operating expenses totaled $95 million, compared to $188 million on a GAAP basis.
Credo ended the quarter with $764 million in cash and short-term investments.
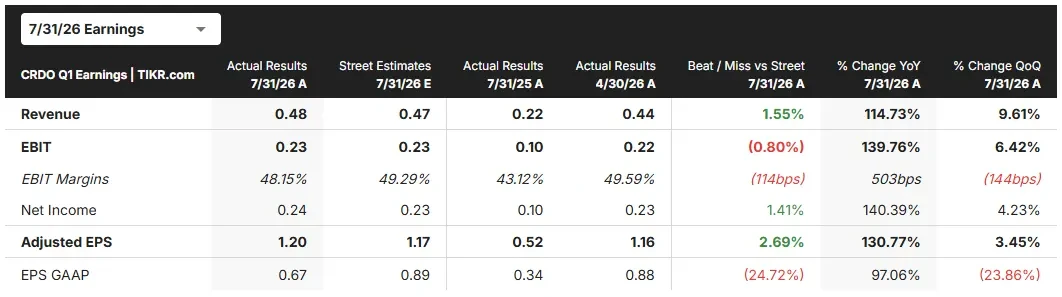
Looking ahead, the company issued Q2 guidance of $525 million to $535 million in revenue, with a midpoint of $530 million, beating the $516.5 million analysts expected.
Credo also guided for adjusted gross margin between 67.0% and 69.0% for the upcoming quarter.
See analysts’ growth forecasts and price targets for Credo Technology stock (It’s free) >>>
What the Market Is Telling Us About Credo Technology Stock
A drop in Credo Technology stock despite beating nearly every metric suggests investors may have wanted something even stronger, or reacted to how much the stock had already run up heading into earnings.
Brennan described the quarter as the company’s seventh straight quarter of triple-digit year-over-year revenue growth, a streak that sets a high bar for what counts as “good enough” for the market.
The company’s growth story centers on AI infrastructure. Brennan explained that Credo’s portfolio now spans connectivity solutions from millimeters to kilometers, covering both optics and copper products used in AI data centers.
That includes AECs (Active Electrical Cables), which remain Credo’s largest business, along with a growing optical business that includes DSPs, silicon photonics chips, and its ZeroFlap Optics products.
Management reiterated that it expects more than $600 million in optical revenue for the full fiscal year, with ZeroFlap Optics, silicon photonics PICs, and optical DSPs each contributing over $100 million.
That would put full-year revenue growth above 85% year over year, an ambitious target investors will watch closely in the coming quarters.
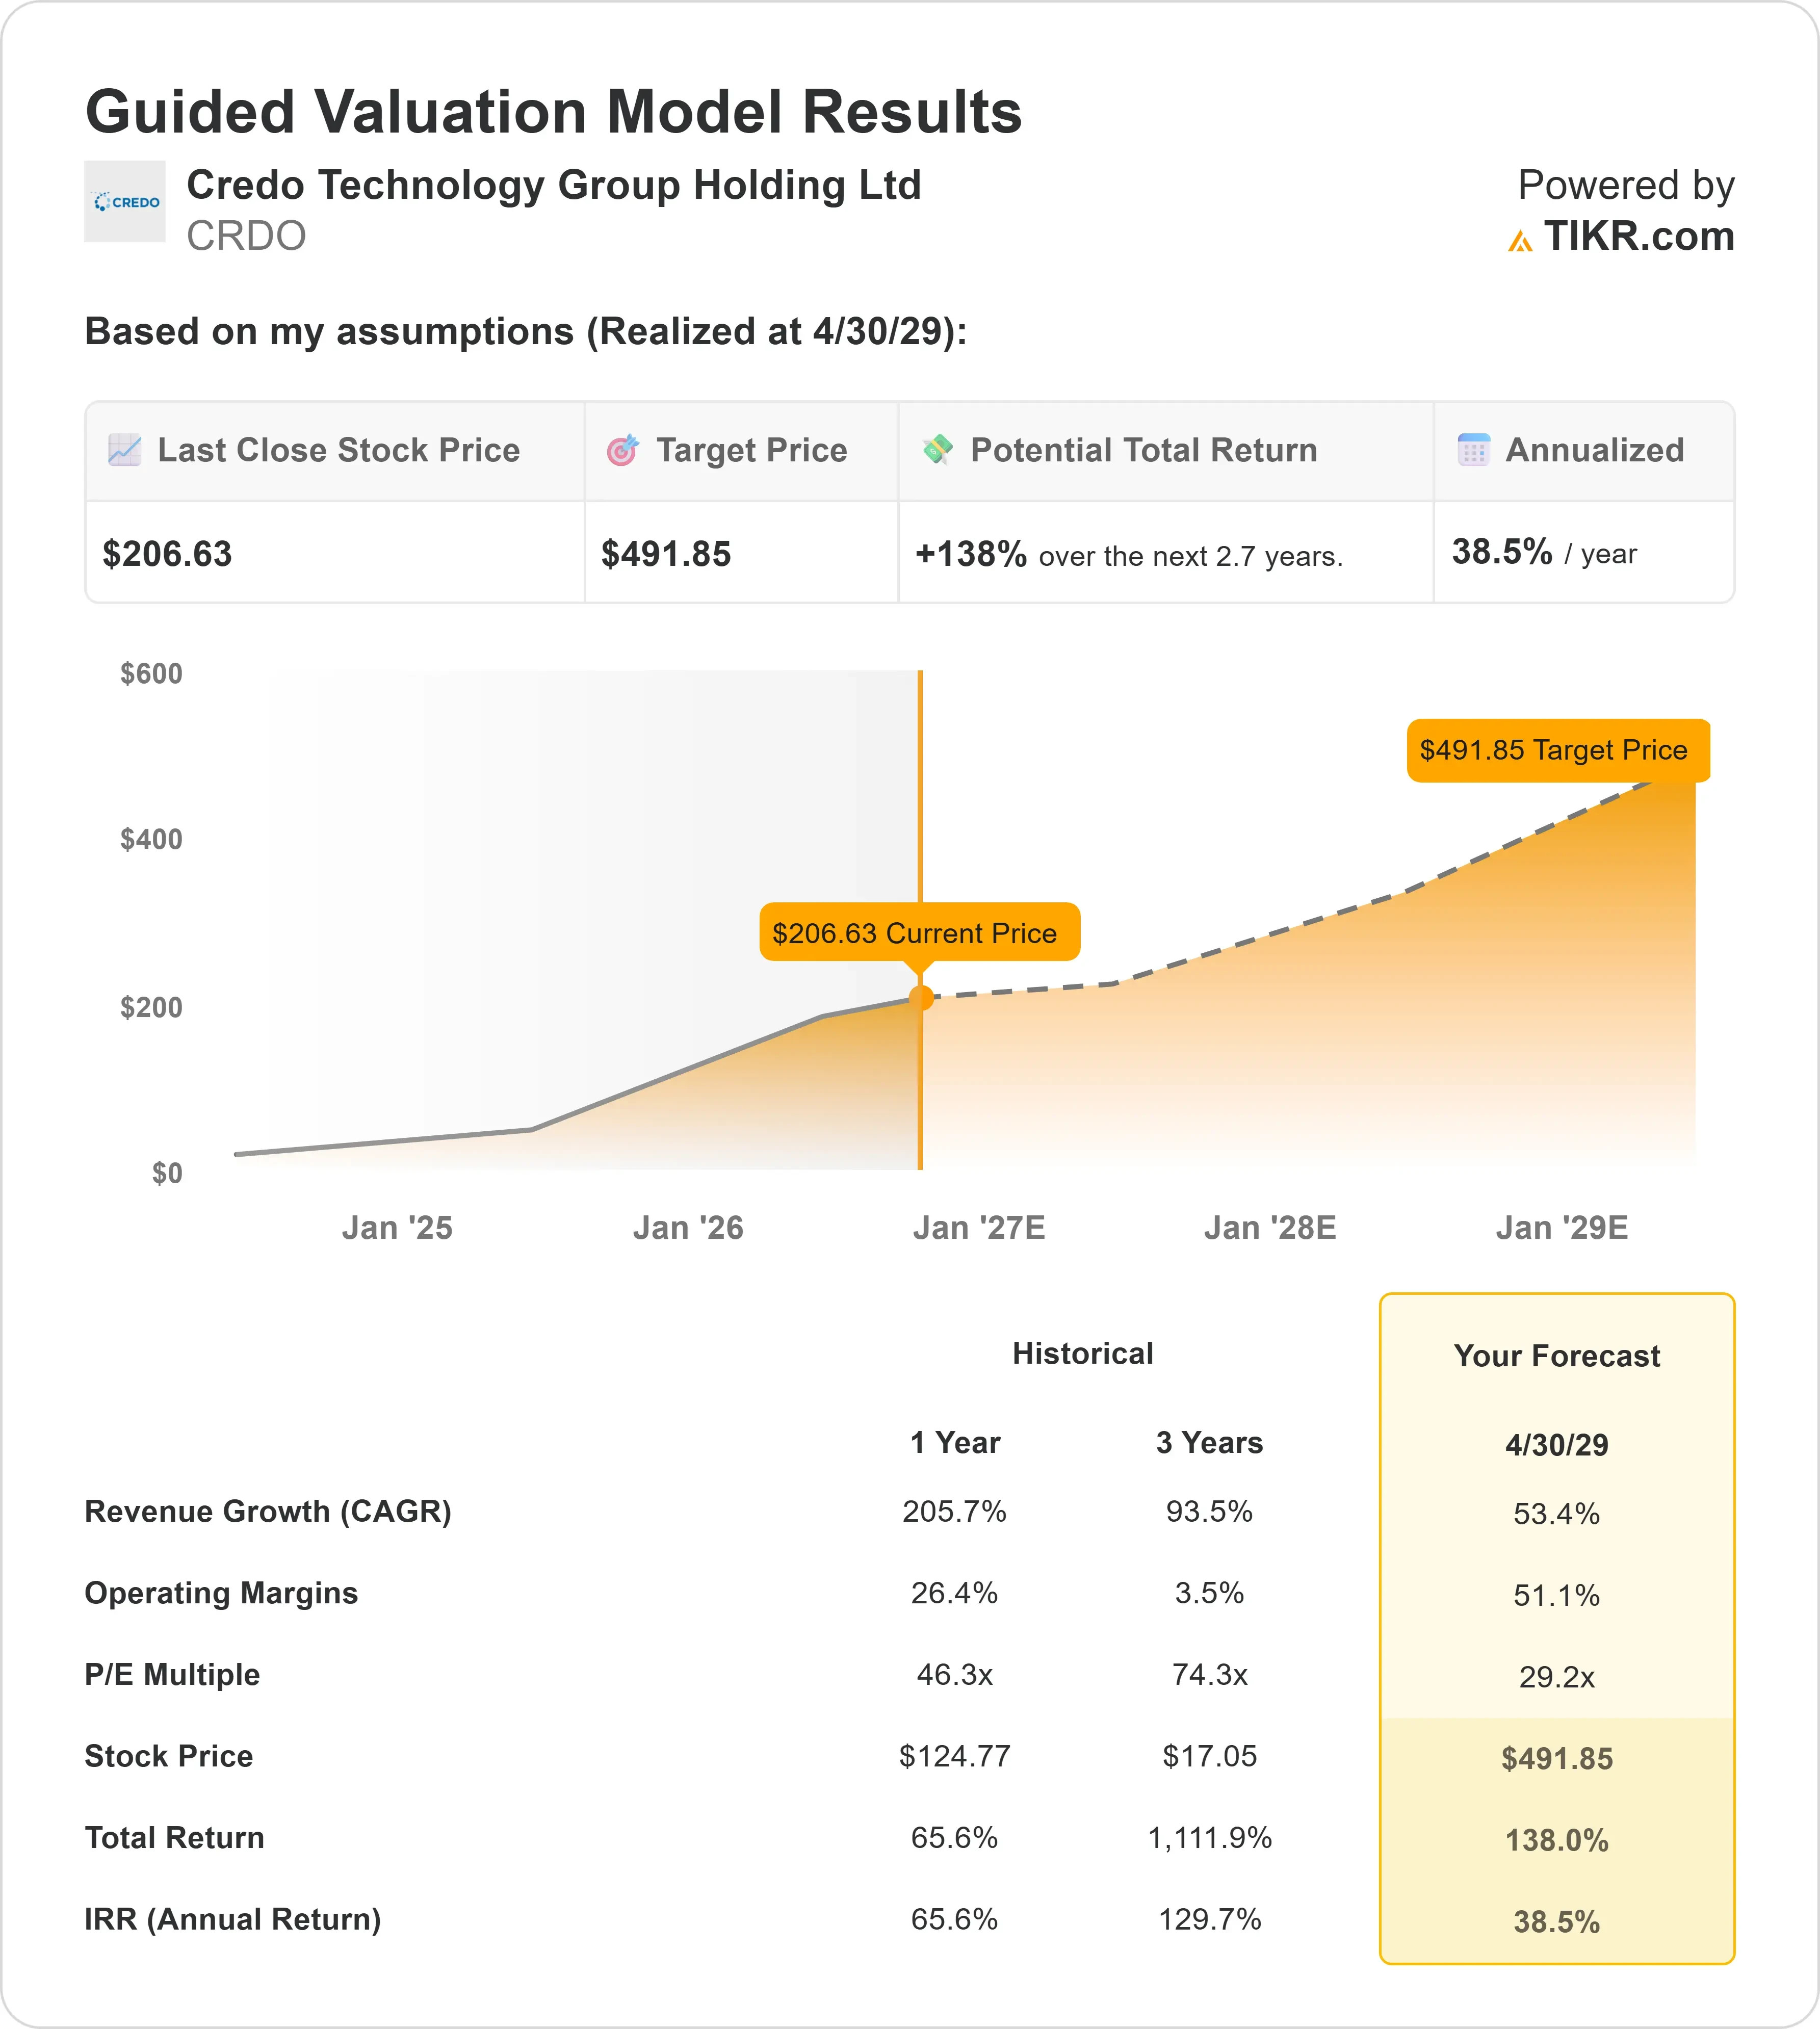
For now, the stock’s decline suggests that even strong beats and solid forward guidance may not satisfy a market that has priced in aggressive growth expectations for Credo Technology stock.
With four customers each contributing 10% or more of quarterly revenue, and continued heavy investment in R&D to support new product lines, investors seem to be weighing near-term profit-taking against the company’s longer-term growth story tied to AI infrastructure spending.
Estimate a company’s fair value instantly (Free with TIKR) >>>
How Much Upside Does Credo Technology Stock Have From Here?
With TIKR’s new Valuation Model tool, you can estimate a stock’s potential share price in under a minute.
All it takes is three simple inputs:
- Revenue Growth
- Operating Margins
- Exit P/E Multiple
If you’re not sure what to enter, TIKR automatically fills in each input using analysts’ consensus estimates, giving you a quick, reliable starting point.
From there, TIKR calculates the potential share price and total returns under Bull, Base, and Bear scenarios so you can quickly see whether a stock looks undervalued or overvalued.
See a stock’s true value in under 60 seconds (Free with TIKR) >>>
Looking for New Opportunities?
- See what stocks billionaire investors are buying so you can follow the smart money.
- Analyze stocks in as little as 5 minutes with TIKR’s all-in-one, easy-to-use platform.
- The more rocks you overturn… the more opportunities you’ll uncover. Search 100K+ global stocks, global top investor holdings, and more with TIKR.
Disclaimer:
Please note that the articles on TIKR are not intended to serve as investment or financial advice from TIKR or our content team, nor are they recommendations to buy or sell any stocks. We create our content based on TIKR Terminal’s investment data and analysts’ estimates. Our analysis might not include recent company news or important updates. TIKR has no position in any stocks mentioned. Thank you for reading, and happy investing!