
Key Stats for ETSY Stock
- This Week Performance: 14%
- 52-Week Range: $40 to $77
- Current Price: $52
What Happened to ETSY Stock?
Etsy (ETSY) stock closed at $52.18 on Friday, up 8.39% on the day, after the company announced the $1.2 billion cash sale of Depop to eBay and reported a Q4 2025 EPS beat of $0.92 against an estimate of $0.84, all within the same 48-hour window.
Announced after markets closed on february 18, the Depop sale to eBay marked a decisive strategic pivot, with Etsy offloading the Gen Z resale platform it originally acquired for $1.63 billion in 2021 at a significant loss, but unlocking a cleaner focus on its core handmade and vintage marketplace.
The deal removes a meaningful financial drag, as Depop carried negative adjusted EBITDA margins and weighed 350 basis points on consolidated adjusted EBITDA margins and 80 basis points on consolidated take rate throughout 2025, burdens that now disappear from Etsy’s financial profile starting Q1 2026.
Furthermore, the market is beginning to re-read Etsy less as a stagnating multi-platform e-commerce operator and more as a focused marketplace turnaround story, with Q4 marking the first positive U.S. buyer GMS growth in four years and Etsy marketplace GMS comparisons improving 9 percentage points from Q1 to Q4 2025.
CEO Kruti Patel Goyal stated on the Q4 2025 earnings call that “we’ve improved the Etsy marketplace’s annual GMS performance from down 6% in 2024 to down 4% last year, and we expect to further improve our performance this year,” grounding the turnaround trajectory in consecutive annual improvements heading into 2026.
Nevertheless, nine of the analysts covering Etsy cut their price targets on february 20, with reductions ranging from Raymond James at $60 to UBS at $53, reflecting persistent caution around soft consumer discretionary demand and a Q1 2026 GMS guidance range of $2.38 billion to $2.43 billion that sits well below the $2.8 billion reported in Q1 2025.
Wall Street’s Take on ETSY Stock
With Depop’s drag on margins now removed and the core Etsy marketplace returning to positive GMS growth for the first time since Q3 2023, the Depop sale effectively resets the financial baseline and gives new CEO Kruti Patel Goyal a cleaner platform to execute her four-pillar turnaround strategy.
The fundamental case hinges on a significant earnings recovery, with FY 2026 normalized EPS projected at $5.29, representing 51.2% growth YoY, alongside EBITDA margin expansion from 25.5% in 2025 back toward 28.1%, as Depop’s negative-margin drag exits the consolidated financials.

So, Wall Street currently holds a cautious stance, assigning ETSY a mean price target of $62.50 across 26 analyst estimates with only 5 Buys and 21 Holds, implying approximately 19.8% upside from the february 20 close of $52.18.
Therefore, the target range spans from a low of $52.00 to a high of $83.00, a spread that reflects genuine disagreement on whether Etsy’s marketplace turnaround has enough velocity to overcome persistent consumer discretionary headwinds and structurally declining purchase frequency.
What Does the Valuation Model Say?
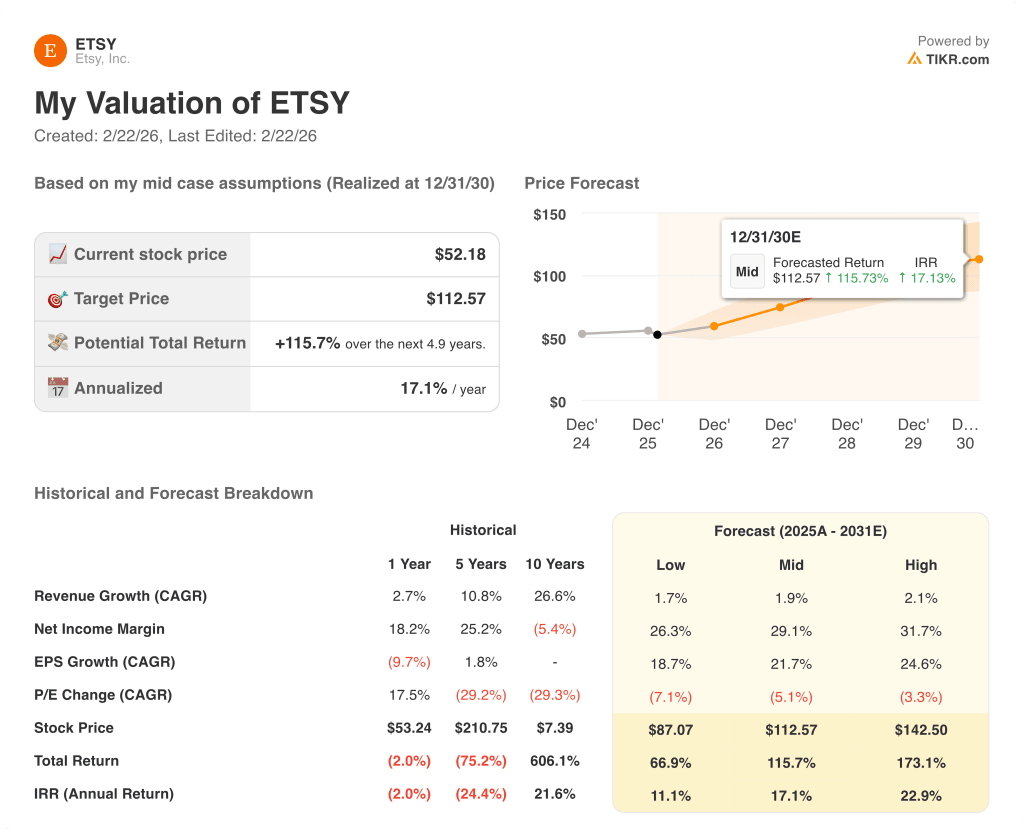
Similarly, a mid-case valuation model built on the Depop divestiture clarity and improving marketplace fundamentals prices ETSY at $112.57 by December 2030, representing a 115.7% total return and a 17.1% annualized IRR from current levels.
In brief; the central risk is revenue contraction, with FY 2026 consensus revenue estimated at $2.78 billion, a 3.6% decline YoY, signaling that even with Depop removed, the core marketplace has not yet demonstrated the sustainable top-line acceleration needed to justify a meaningful rerating.
At $52.18, Etsy looks like a credible turnaround candidate with compelling model upside, but the stock remains a wait-and-see until sequential GMS growth proves durable beyond the FX tailwinds and easy comparisons that flatter Q1 2026 guidance.
Value Any Stock in Under 60 Seconds (It’s Free)
With TIKR’s new Valuation Model tool, you can estimate a stock’s potential share price in under a minute.
All it takes is three simple inputs:
- Revenue Growth
- Operating Margins
- Exit P/E Multiple
From there, TIKR calculates the potential share price and total returns under Bull, Base, and Bear scenarios so you can quickly see whether a stock looks undervalued or overvalued.
If you’re not sure what to enter, TIKR automatically fills in each input using analysts’ consensus estimates, giving you a quick, reliable starting point.