Key Stats for Ventas Stock
- Past-Week Performance: 0.8%
- 52-Week Range: $60 to $87
- Current Price: $86
What Happened to Ventas Stock?
Ventas (VTR) closed at $85.9 last Friday, approaching its 52-week high of $87.2, after a concentrated stretch of catalysts including Q4 2025 earnings, an 8% dividend increase, and an expanded $2.5 billion at-the-market equity program all landed within the same two-week window.
Reported on February 5, Q4 2025 results delivered normalized FFO of $3.48 per share for the full year, a 9% increase, while SHOP same-store cash NOI grew 15% for the fourth consecutive year of double-digit growth, beating expectations and reinforcing the company’s operational execution.
Fueling those results, Ventas generated over $7 billion in capital during 2025 and closed $2.5 billion in senior housing acquisitions, finishing the year with 83,000-plus SHOP units and SHOP representing 53% of total NOI, a portfolio transformation now generating measurable compounding returns.
Already in 2026, Ventas has closed over $800 million in wholly owned senior housing deals across seven transactions, with management guiding to a full-year $2.5 billion investment target and describing pipeline confidence as “high,” suggesting external growth momentum is accelerating rather than plateauing.
Debra Cafaro, Chairman and CEO, stated on the Q4 2025 earnings call that “2025 was an outstanding year for Ventas,” adding that total shareholder returns of 35% significantly outperformed industry benchmarks and the S&P 500, and that the company closed $2.5 billion in accretive senior housing investments during the year.
Beyond the quarter, the broader thesis is hardening as baby boomers begin turning 80 in 2026, a cohort of nearly 70 million people that management projects will drive a 28% surge in the over-80 population over the next five years against new senior housing starts hovering near all-time lows of roughly 2,500 units per quarter.
Wall Street’s Take on VTR Stock
With Ventas stock already closing $800 million in senior housing acquisitions in the first weeks of 2026 and guiding to a full-year $2.5 billion investment target, the company’s organic and external growth engines are running simultaneously at a scale few healthcare REITs can match.
The fundamental case centers on revenue accelerating from $4.92 billion in 2024 to an estimated $6.72 billion in 2026, a 15.2% YoY jump, while normalized EPS grows 45.5% to $0.66, reflecting the compounding effect of occupancy gains, higher in-house rents, and accretive acquisitions.
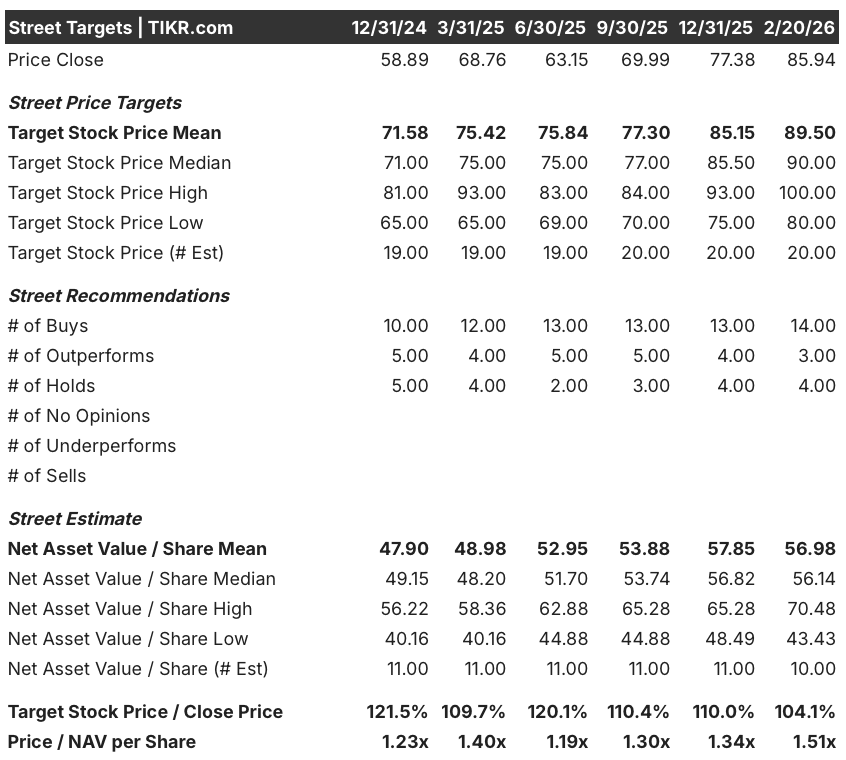
Wall Street is firmly behind the story, with 14 Buy ratings, 3 Outperforms, and 4 Holds among 21 analysts tracked, and a mean price target of $89.50 that implies further upside from the current $85.94 close.
The target range spans $80.00 on the low end to $100.00 on the high end, meaning even the most cautious analysts see limited downside from current levels while bulls price in a move that would represent a new 52-week high well above the current peak of $87.24
What Does the Valuation Model Say?
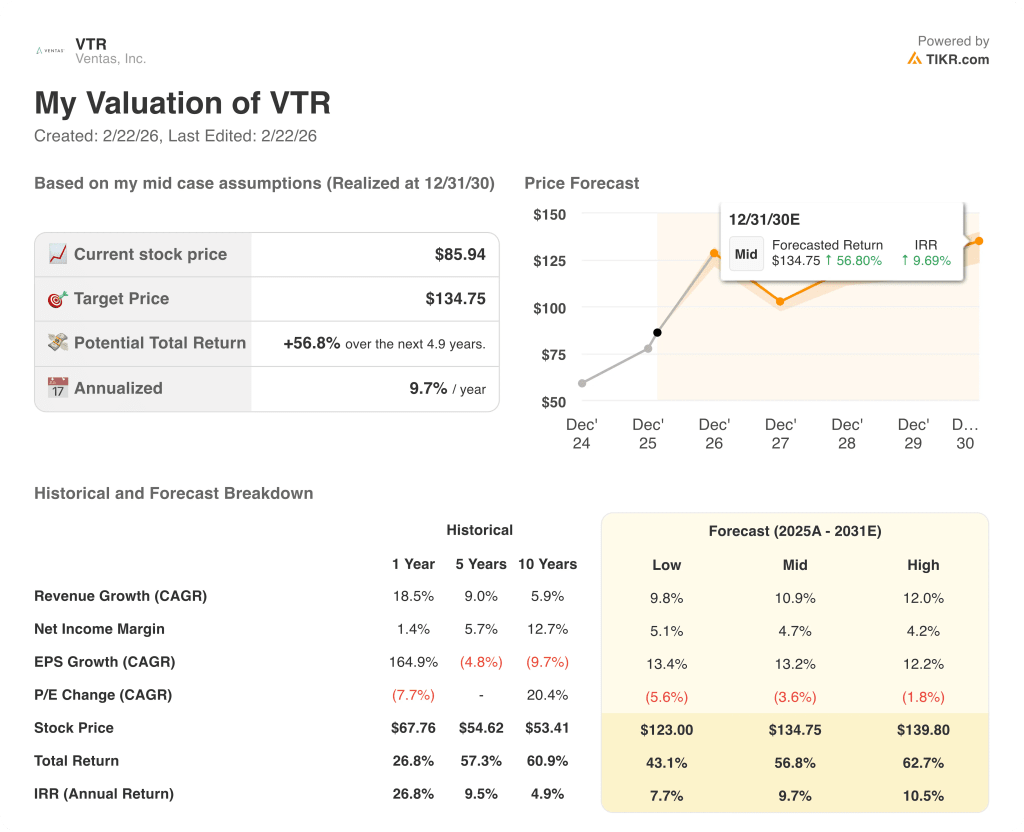
Supported by a fifth consecutive year of projected double-digit SHOP NOI growth and $2.5 billion in equity-funded acquisitions, a mid-case valuation model prices VTR at $134.75 by December 2030, implying a 56.8% total return and a 9.7% annualized IRR from today’s price.
The clearest risk is multiple compression, as VTR already trades at 1.51x NAV per share against a consensus NAV mean of $56.98, meaning any slowdown in SHOP NOI growth or a rise in long-term interest rates could quickly pressure a premium that leaves little room for operational misses.
At $85.94 and approaching its 52-week high, Ventas stock looks fairly valued in the near term but fundamentally underpriced over a multi-year horizon, given a demographic wave that management projects will double the over-80 population against senior housing supply near all-time lows.
Value Any Stock in Under 60 Seconds (It’s Free)
With TIKR’s new Valuation Model tool, you can estimate a stock’s potential share price in under a minute.
All it takes is three simple inputs:
- Revenue Growth
- Operating Margins
- Exit P/E Multiple
From there, TIKR calculates the potential share price and total returns under Bull, Base, and Bear scenarios so you can quickly see whether a stock looks undervalued or overvalued.
If you’re not sure what to enter, TIKR automatically fills in each input using analysts’ consensus estimates, giving you a quick, reliable starting point.