Key Takeaways
- CFO Pat Murray told analysts that growing the dividend remains central to Enbridge’s strategy, citing $38 billion returned to shareholders over the past five years against a target of $40 billion to $45 billion over the next five.
- The dividend held at $0.97 per share through the second quarter of 2026, unchanged from the prior quarter, after CEO Greg Ebel pointed to 31 consecutive years of increases.
- A payout ratio of 148.23% met a 5.79% yield in the most recent reading, a pairing that leaves little room for error against Enbridge stock’s income case.
- TIKR’s mid case model puts Enbridge stock’s target price at CA$188.95 by December 2030, a potential total return of 177.1% and an annualized rate of 26.8%.
Enbridge stock’s dividend streak just met a payout ratio north of 100% again, and management isn’t slowing down. See the full valuation model on TIKR for free →
Enbridge Stock’s Dividend Math Doesn’t Match Its Confidence
Enbridge posted second quarter 2026 results on July 31, and the call left little doubt about where capital is headed. CEO Greg Ebel called dividend growth “central to our strategy,” and backed the claim with a number few pipeline operators can match: 31 consecutive years of dividend increases. CFO Pat Murray went further, quantifying the commitment. Over the past five years, Enbridge returned $38 billion to shareholders. Over the next five, management expects that figure to land between $40 billion and $45 billion.
That confidence sits against a balance sheet doing real work. Murray told the room Enbridge exited the quarter at 5.1x debt to EBITDA, above where the company wants to sit, though he attributed most of the overshoot to a weaker Canadian dollar during the quarter. Adjust for that currency swing, he said, and leverage falls back within Enbridge’s target range. Adjusted EBITDA still climbed by more than $130 million compared to the same quarter last year, driven by higher spot volumes on the Seaway pipeline and stronger Mainline and Line 9 throughput.
Growth spending isn’t pausing to fix any of this. Enbridge has already sanctioned $9 billion of its up to $20 billion 2026-2027 capital target, drawing from a $50 billion opportunity set that runs through 2030. Murray reaffirmed 2026 guidance set last December and said the company continues to equity self-fund that growth rather than lean harder on debt. Ebel closed by calling the backdrop “possibly the best environment for growth that we’ve had in recent memory,” pointing to a $41 billion secured capital backlog as the runway behind it.
None of that changes what the payout ratio says right now. Enbridge is funding both an expanding capital program and a dividend it has raised for three decades straight, and management wants investors reading those two goals as compatible rather than competing.
Murray just put a number on Enbridge’s next five years of payouts. Compare it against the dividend history on TIKR for free →
Enbridge Stock’s Payout Ratio Keeps Crossing 100% Even as the Streak Holds
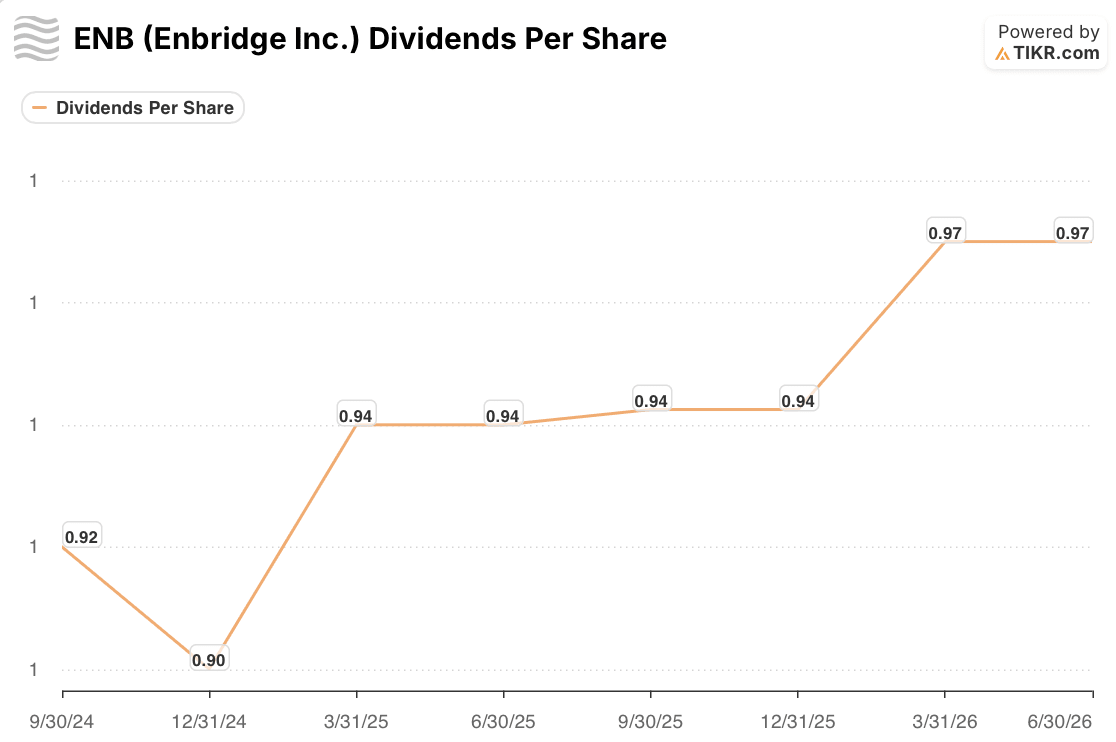
Enbridge’s dividend has been remarkably steady on the surface. The payment sat at $0.97 per share as of the second quarter of 2026, flat against the prior quarter, after holding at $0.94 for four straight quarters before that. Before that stretch, the dividend dipped to $0.90 at the end of 2024 from $0.92 the quarter prior. Viewed against Ebel’s claim of 31 straight years of increases, the recent flat readings look less like hesitation and more like a company pausing between steps up rather than reversing course.

The payout ratio tells a messier story. It came in at 148.23% in the most recent period, following 125.03% the quarter before that. Both sit well above 100%, meaning the dividend as reported outpaced the earnings base it’s measured against in each of those periods. That’s not new for Enbridge stock. The ratio spiked to 351.43% at the end of 2024 and 274.11% in the third quarter of 2025, interspersed with quarters closer to 91% and 95%.
A pipeline operator with heavy depreciation charges can run payout ratios like this without necessarily threatening the dividend, since cash flow and accounting earnings diverge more than they do for most businesses. Still, a reading this volatile makes the payout ratio a weak standalone signal of dividend safety here, and it puts more weight on management’s own framing: a self-funded growth plan and a stated five-year capital return target investors can hold them to.
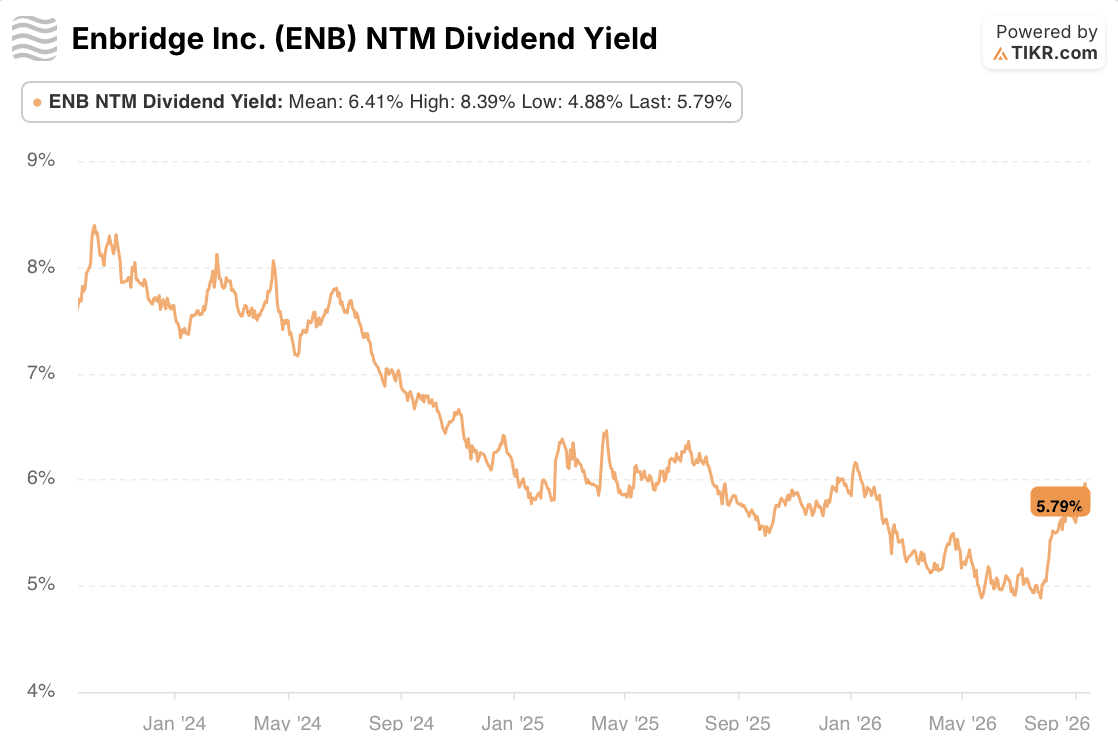
The yield offers a cleaner readout. At 5.79%, it sits below the multi-year mean of 6.41% but well above the recent low of 4.88% touched earlier this year. For income-focused buyers, that’s a yield still paying more than its own recent average low, on a dividend management has publicly committed to keep raising. The tension for Enbridge stock isn’t whether the streak continues. It’s whether a payout ratio this erratic keeps investors comfortable holding through the swings while they wait for the next increase.
TIKR’s Model Sees Enbridge Stock Reaching CA$188.95 by 2030
TIKR’s mid case valuation model puts Enbridge stock’s target price at CA$188.95 by December 2030, a potential total return of 177% and an annualized rate of 27%.
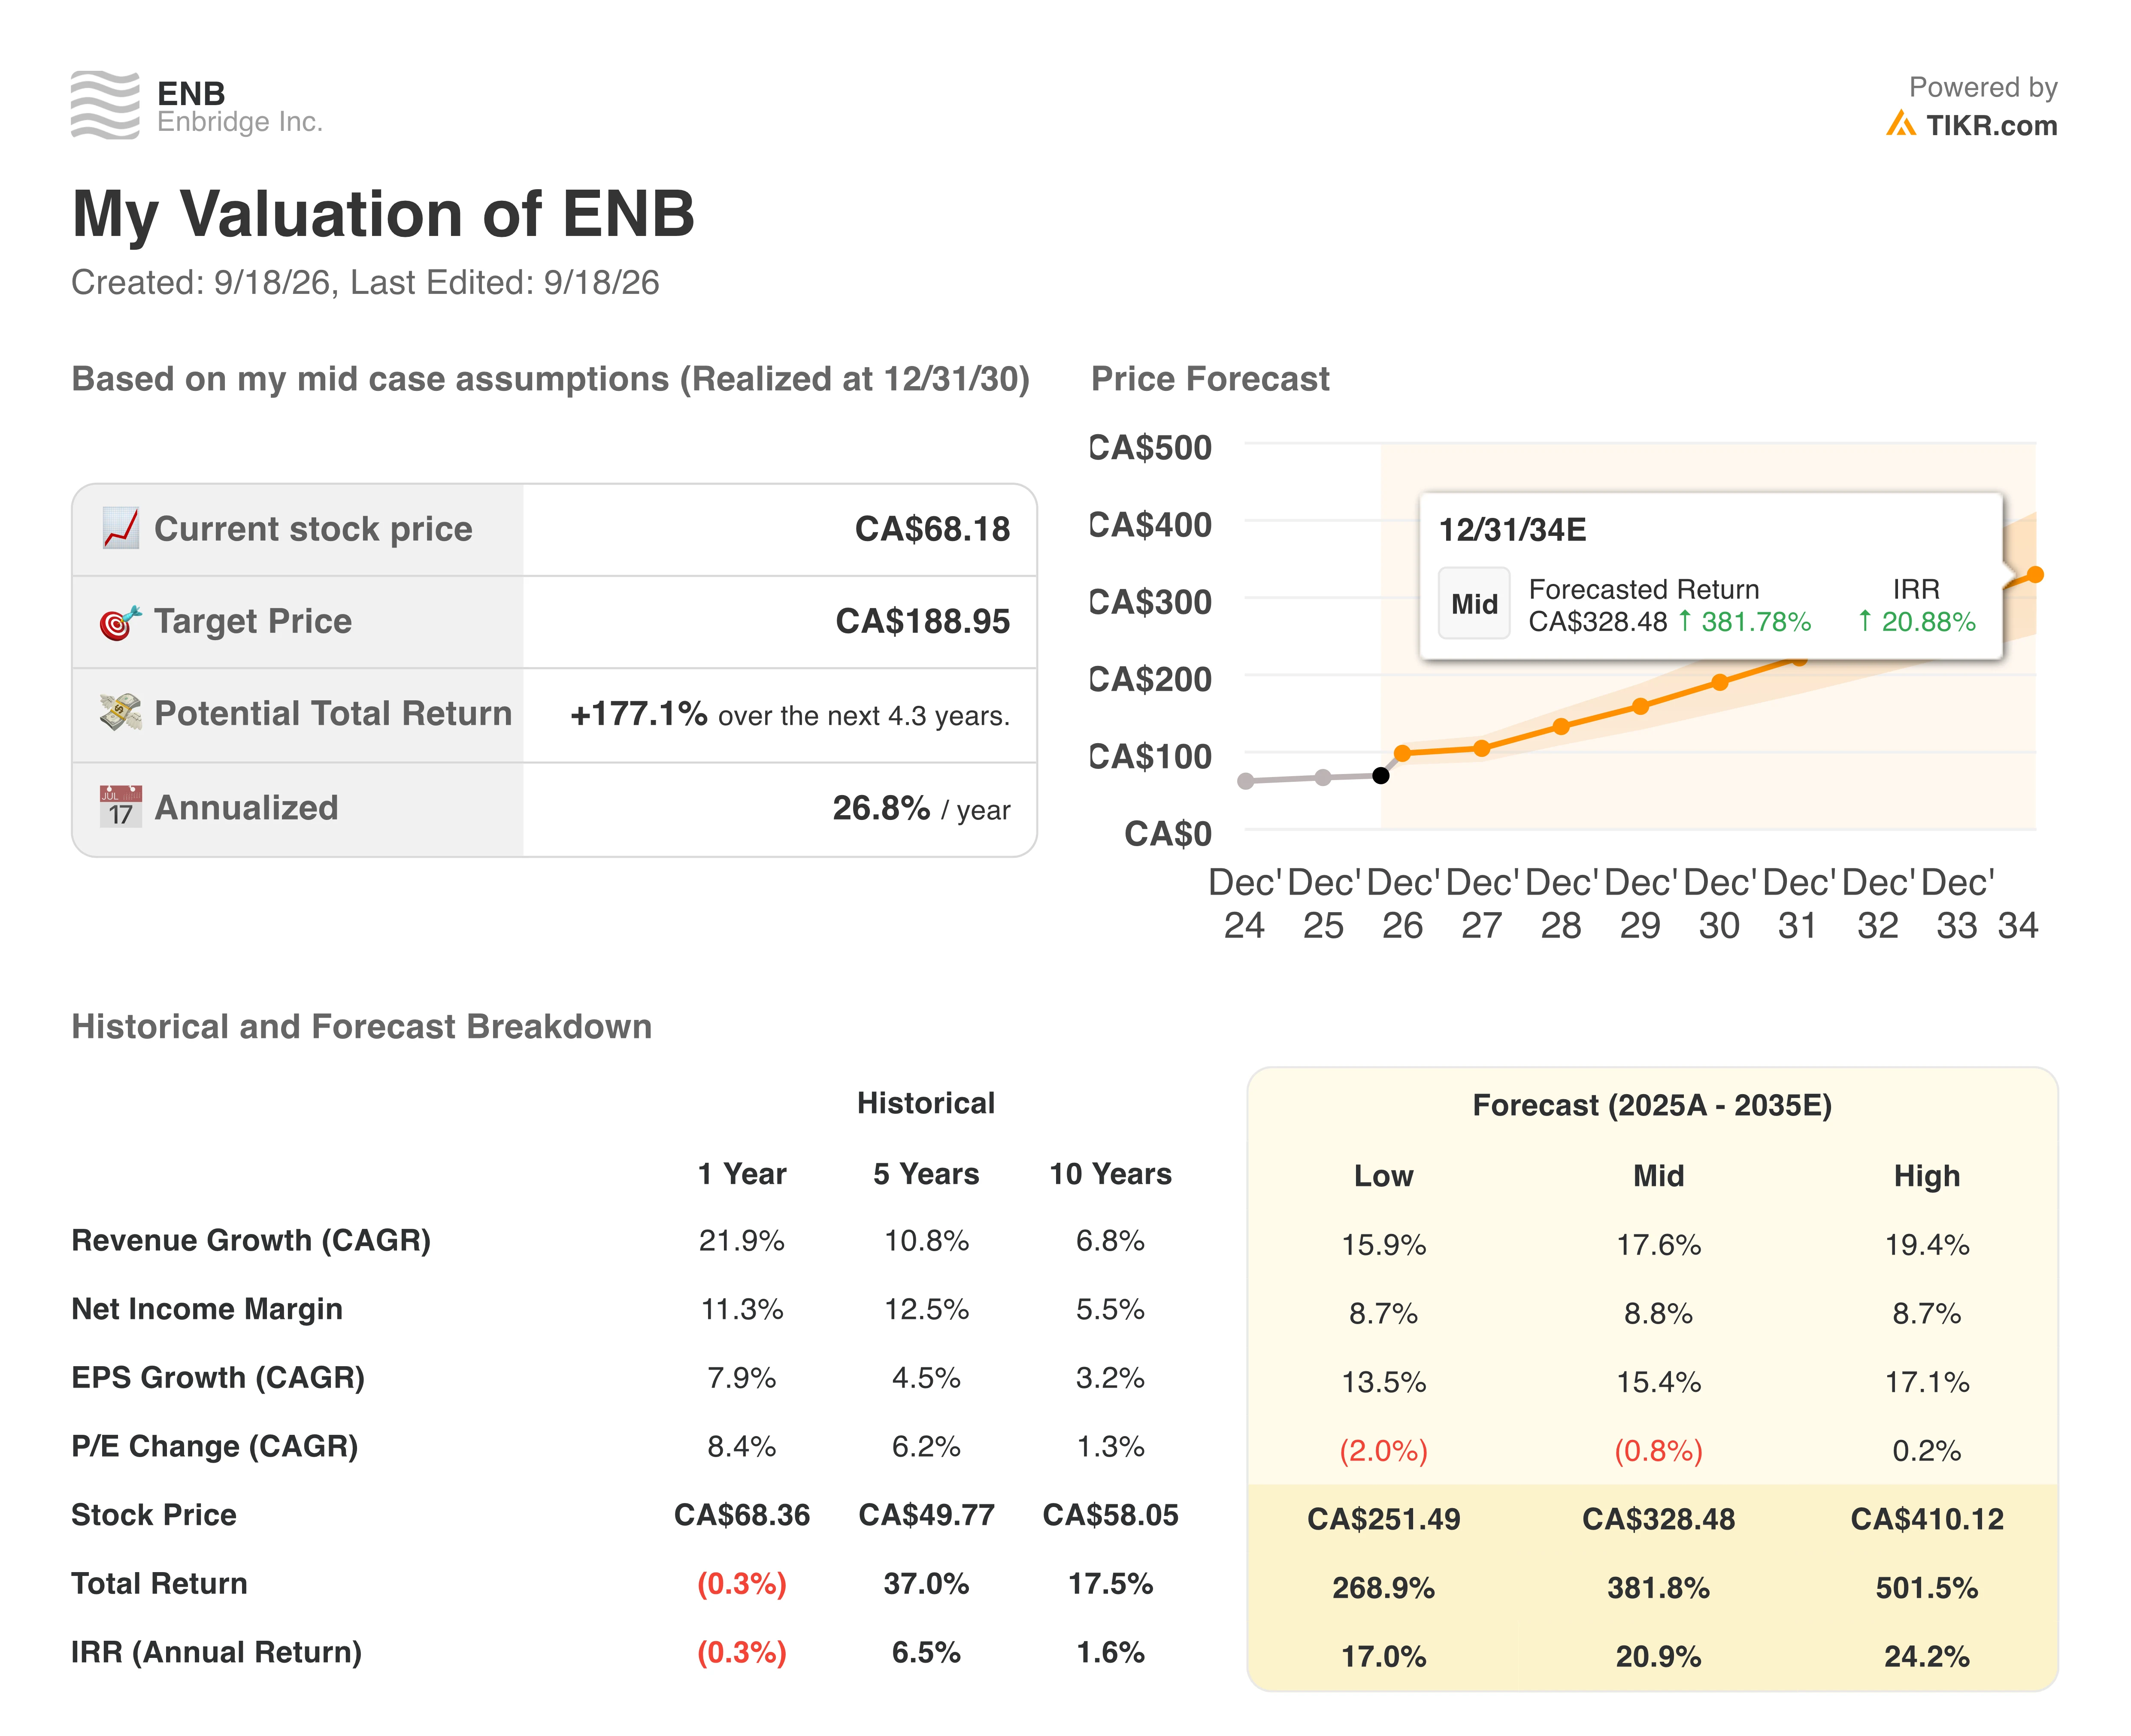
That return profile places Enbridge stock well outside typical utility-like return expectations, reflecting a business TIKR’s model treats as more than a bond proxy: a diversified mix of liquids pipelines, gas transmission, gas utilities and renewable power, each with its own growth backlog.
The case for reaching that target leans on the same figures management gave on the call. A $41 billion secured backlog, a $50 billion opportunity set through 2030 and $9 billion already sanctioned this year all point to a business adding earning assets faster than it’s retiring them, while the equity self-funding approach Murray described keeps that growth from diluting shareholders as aggressively as debt-funded expansion might.
TIKR’s model sees Enbridge stock returning 177% by 2030. Check the assumptions behind that target on TIKR for free →
Should You Invest in Enbridge Inc.?
The only way to really know is to look at the numbers yourself. TIKR gives you free access to the same institutional-quality financial data that professional analysts use to answer exactly that question.
Pull up Enbridge Inc. stock and you’ll see years of historical financials, what Wall Street analysts expect for revenue and earnings in the quarters ahead, how valuation multiples have moved over time, and whether price targets are trending up or down.
You can build a free watchlist to track Enbridge Inc. alongside every other stock on your radar. No credit card required. Just the data you need to decide for yourself.
Access Professional Tools to Analyze ENB stock on TIKR for Free →
Looking for New Opportunities?
- See what stocks billionaire investors are buying so you can follow the smart money.
- Analyze stocks in as little as 5 minutes with TIKR’s all-in-one, easy-to-use platform.
- The more rocks you overturn… the more opportunities you’ll uncover. Search 100K+ global stocks, global top investor holdings, and more with TIKR.
Disclaimer:
Please note that the articles on TIKR are not intended to serve as investment or financial advice from TIKR or our content team, nor are they recommendations to buy or sell any stocks. We create our content based on TIKR Terminal’s investment data and analysts’ estimates. Our analysis might not include recent company news or important updates. TIKR has no position in any stocks mentioned. Thank you for reading, and happy investing!