
Key Stats for FANG Stock
- 6-Month Performance: 28%
- 52-Week Range: $114 to $177
- Valuation Model Target Price: $195
- Implied Upside: 10.6%
Value your favorite stocks like Diamondback Energy with 5 years of analysts’ forecasts using TIKR’s new Valuation Model (It’s free) >>>
What Happened?
Diamondback Energy has risen about 28% over the last six months, recently trading near $176 per share as sustained institutional buying and strong positioning in large-cap Permian producers supported the advance.
Shares recently reached a 52 week high of $173 and now carry a market cap of about $48 billion with a P/E ratio of 12, reflecting renewed confidence in the company’s cash flow durability.
The rally has been driven primarily by significant third-quarter institutional accumulation, signaling conviction in Diamondback’s scale and capital return model.
Smead Capital Management increased its stake by 25%, purchasing about 259,000 shares to own roughly 1.3 million shares valued at $188 million, making Diamondback its 13th-largest holding at about 4% of its portfolio.
NEOS Investment Management boosted its position by 86% to about 106,000 shares valued at $15 million, Kovack Advisors raised its stake by 59%, and Rhumbline Advisers increased holdings by 4% to roughly 369,000 shares worth $53 million. Overall institutional ownership stands at 90%, reinforcing broad-based accumulation.
Recent earnings-related updates also shaped expectations for 2026. Diamondback flagged weaker fourth-quarter commodity realizations, with oil prices declining to $58 per barrel from $65 and natural gas falling to $1.03 per Mcf from $1.75.
Analysts currently expect adjusted EPS of about $2.64 for the quarter and $13 for the full year, with Siebert Williams Shank analyst Gabriele Sorbara stating, “Obviously, this will put a little pressure on the bottom line for 4Q25,” highlighting sensitivity to commodity pricing.
While some firms trimmed exposure, including Shell Asset Management cutting its stake by 65% and Allianz Asset Management reducing holdings by 34%, accumulation from multiple managers outweighed selling pressure.
The six-month advance reflects positioning around Diamondback’s production scale, balance sheet strength, and ability to sustain free cash flow into 2026 despite near-term pricing volatility.

See analysts’ growth forecasts and price targets for Diamondback Energy (It’s free) >>>
Is FANG Undervalued?
Under valuation assumptions, the stock is modeled using:
- Revenue Growth (CAGR): 10.0%
- Operating Margins: 33.6%
- Exit P/E Multiple: 15.5x
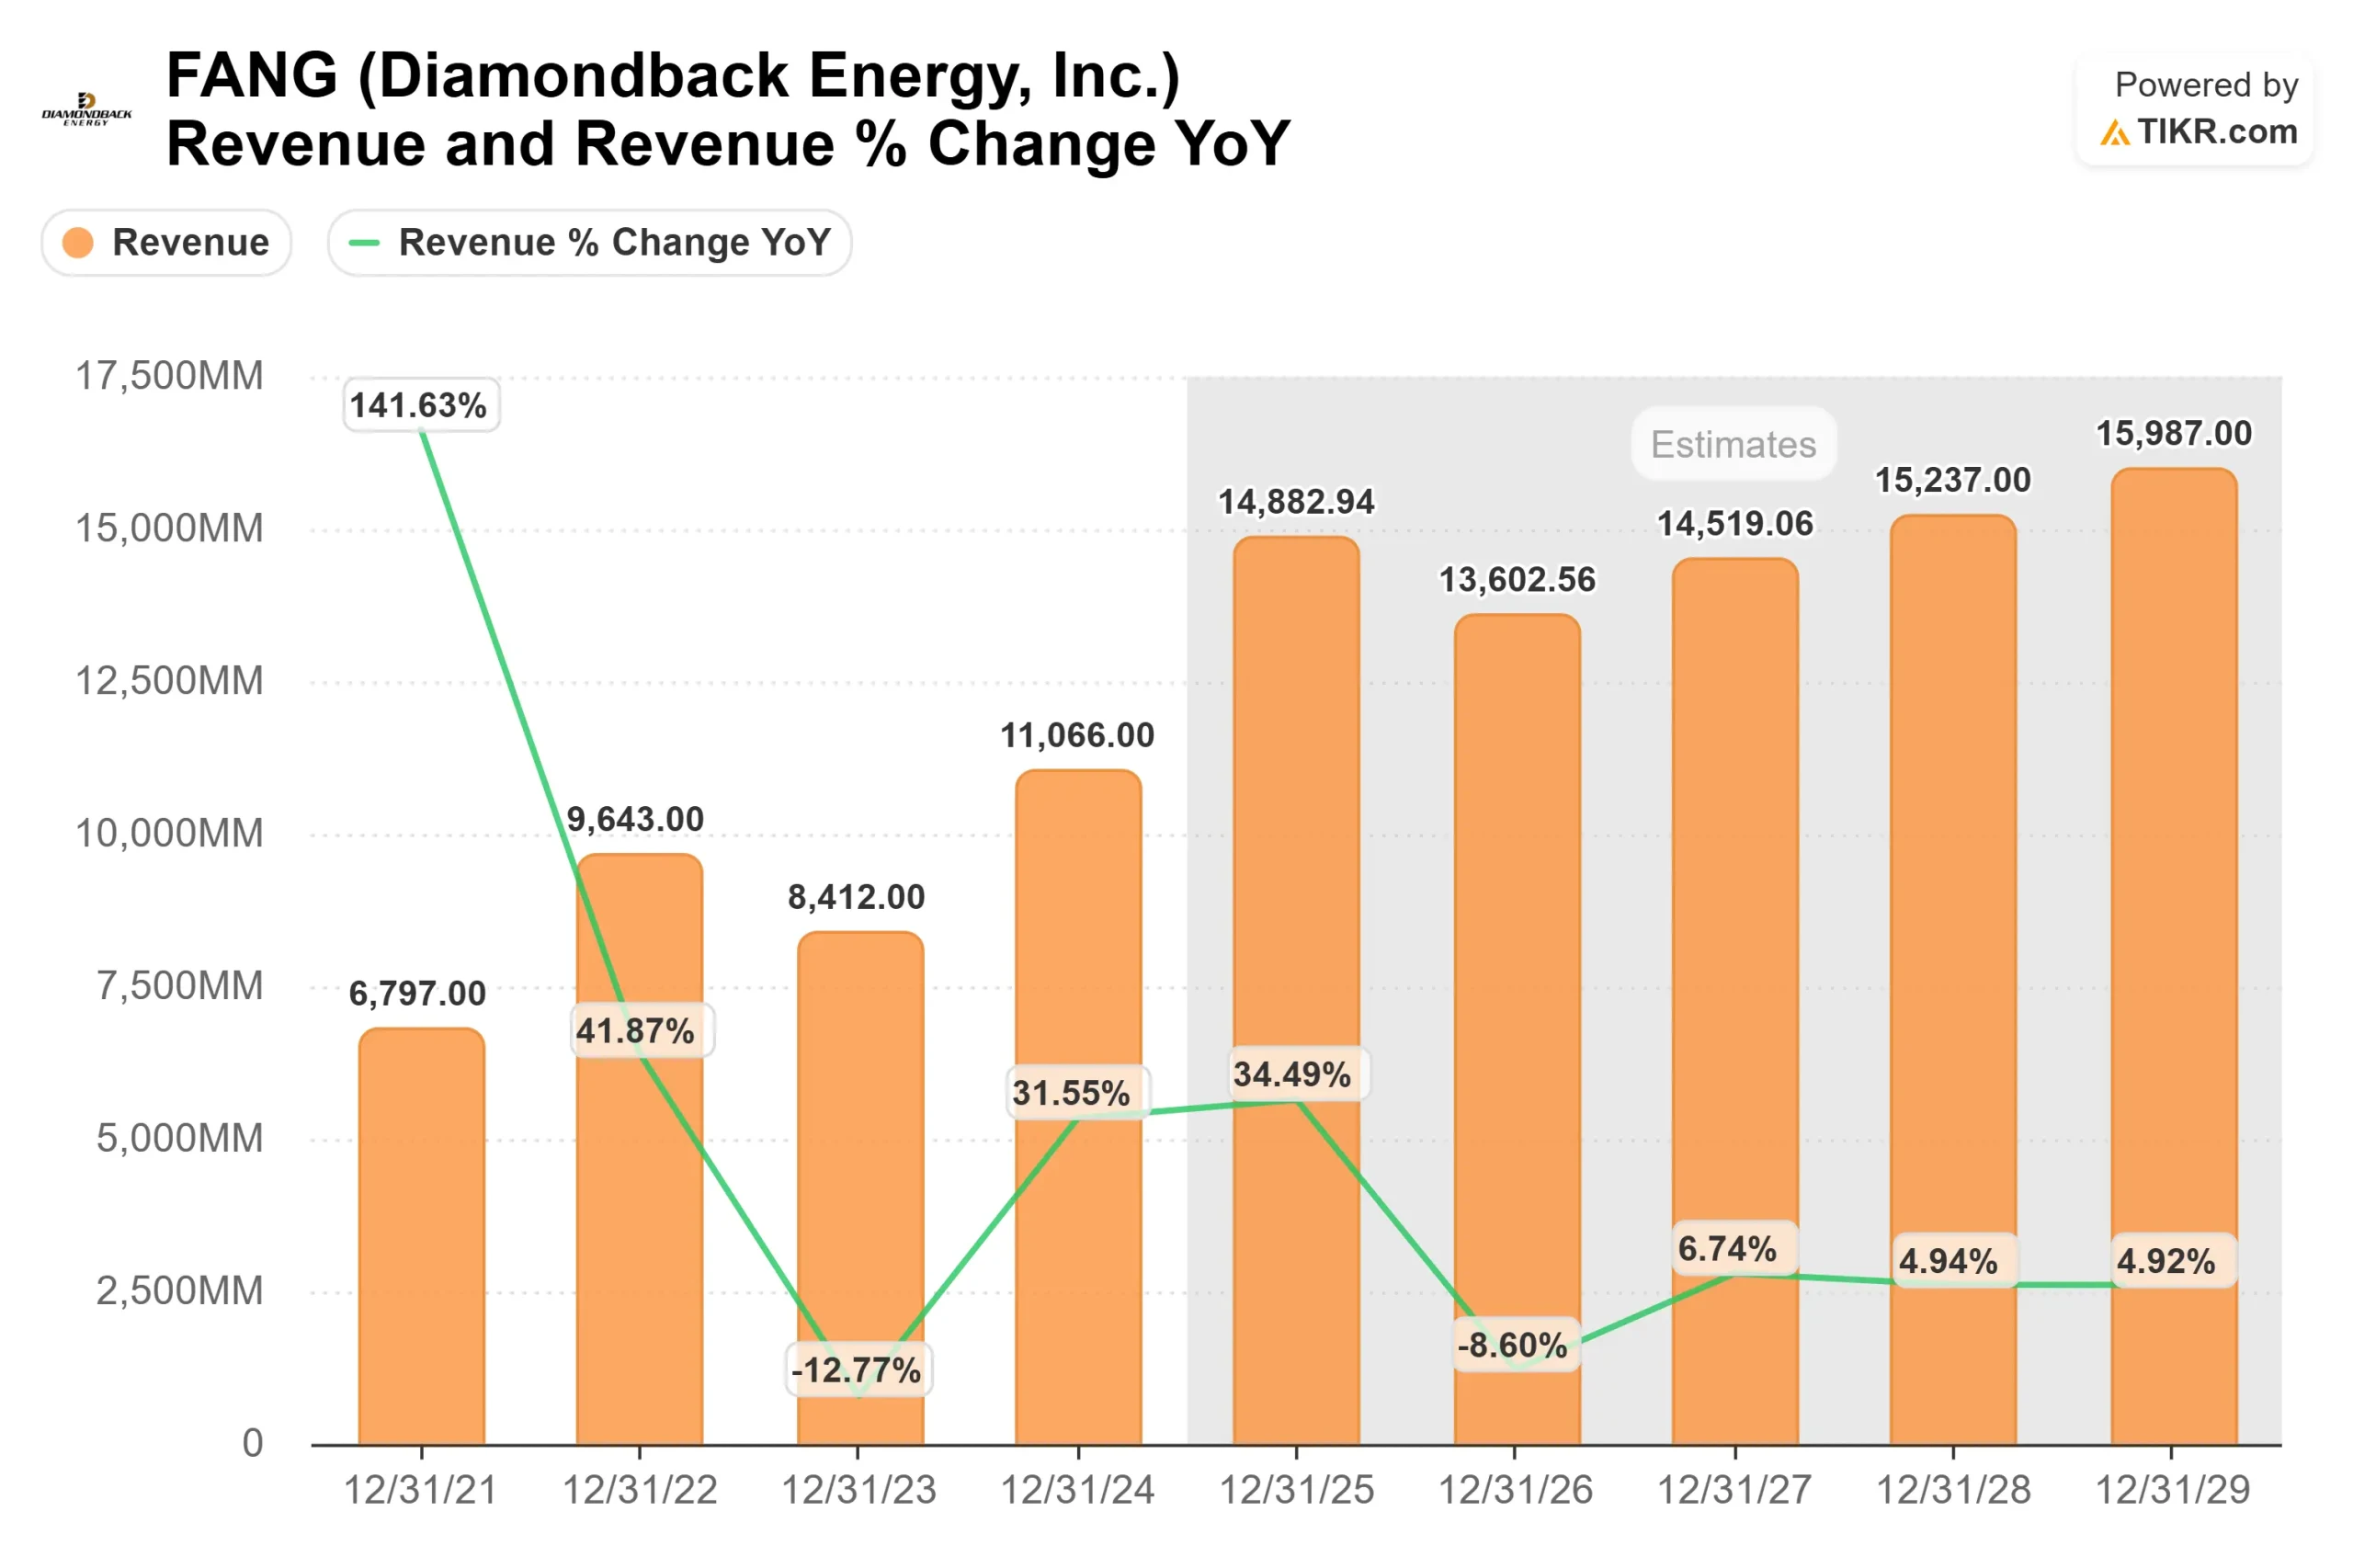
Revenue is projected to expand from approximately $14.9 billion in 2025 toward nearly $16.0 billion by 2029, reflecting steady production growth and disciplined capital deployment rather than aggressive volume expansion.
Performance into 2026 will likely be shaped by capital efficiency in the Permian Basin. Longer laterals, faster drilling cycles, and optimized completion techniques can reduce per-barrel costs and protect margins even if oil prices remain range-bound.
With a payout ratio of 27.0%, Diamondback retains flexibility to fund development while continuing dividends and share repurchases that enhance per-share earnings growth.
LTM EBIT margins of 39.6% highlight structural cost advantages relative to many peers, creating meaningful operating leverage if commodity pricing improves. Free cash flow durability remains central, as disciplined spending and balance sheet strength support capital returns without overextending leverage.
Based on these inputs, the valuation model estimates a target price of $194.75, implying about 10.6% total upside over roughly 1.8 years, or 5.6% annually.
At current levels near $176, Diamondback appears modestly undervalued, with results in 2026 likely driven by production efficiency gains, disciplined capital allocation, and sustained free cash flow generation rather than a sharp rebound in commodity prices.
Estimate a company’s fair value instantly (Free with TIKR) >>>
Value Any Stock in Under 60 Seconds (It’s Free)
With TIKR’s new Valuation Model tool, you can estimate a stock’s potential share price in under a minute.
All it takes is three simple inputs:
- Revenue Growth
- Operating Margins
- Exit P/E Multiple
From there, TIKR calculates the potential share price and total returns under Bull, Base, and Bear scenarios so you can quickly see whether a stock looks undervalued or overvalued.
If you’re not sure what to enter, TIKR automatically fills in each input using analysts’ consensus estimates, giving you a quick, reliable starting point.
See a stock’s true value in under 60 seconds (Free with TIKR) >>>