
Key Stats for Costco Stock
- Past-30-Day Performance: 8%
- 52-Week Range: $844 to $1,071
- Valuation Model Target Price: $1,183
- Implied Upside: 16%
Value your favorite stocks like Costco with 5 years of analysts’ forecasts using TIKR’s new Valuation Model (It’s free) >>>
What Happened?
Costco Wholesale Corporation stock rose about 8% in the last 30 days, finishing near $1,018 per share as investors reacted to strong January sales results and resilient traffic trends. Shares pushed back toward their $1,071 52 week high, signaling renewed confidence in earnings durability.
The stock moved higher after Costco reported January net sales of $21.33 billion, up 9.3% from $19.51 billion last year, which reassured investors that demand remains strong despite macro uncertainty.
Total company comparable sales rose 7.1%, digitally enabled comps surged 34.4%, and worldwide traffic increased 2.4%, reinforcing the view that both in store and online momentum remain intact.
Director of Finance Andrew Yoon stated, “Net sales for the month came in at $21.33 billion, an increase of 9.3%,” underscoring broad based growth even as gas price deflation reduced reported comps by about 100 basis points.
Institutional positioning also drew attention. Varma Mutual Pension Insurance Co increased its stake by 12.3% to 65,057 shares valued at $60.2 million, while International Private Wealth Advisors raised its holdings by 41.5% to 3,947 shares worth $3.65 million.
Overall institutional ownership remains approximately 68.48%, reinforcing Costco’s status as a widely held core position among long term investors.
Attention now turns toward the upcoming earnings release in early March, where investors will focus on membership renewal rates, comparable sales momentum, and any commentary around potential membership fee increases.
With shares trading at elevated earnings multiples, confirmation of sustained traffic and margin stability remains central to maintaining recent gains.

See analysts’ growth forecasts and price targets for Costco (It’s free) >>>
Is Costco Undervalued?
Under valuation assumptions, the stock is modeled using:
- Revenue Growth (CAGR): 7.7%
- Operating Margins: 4.0%
- Exit P/E Multiple: 44.8x
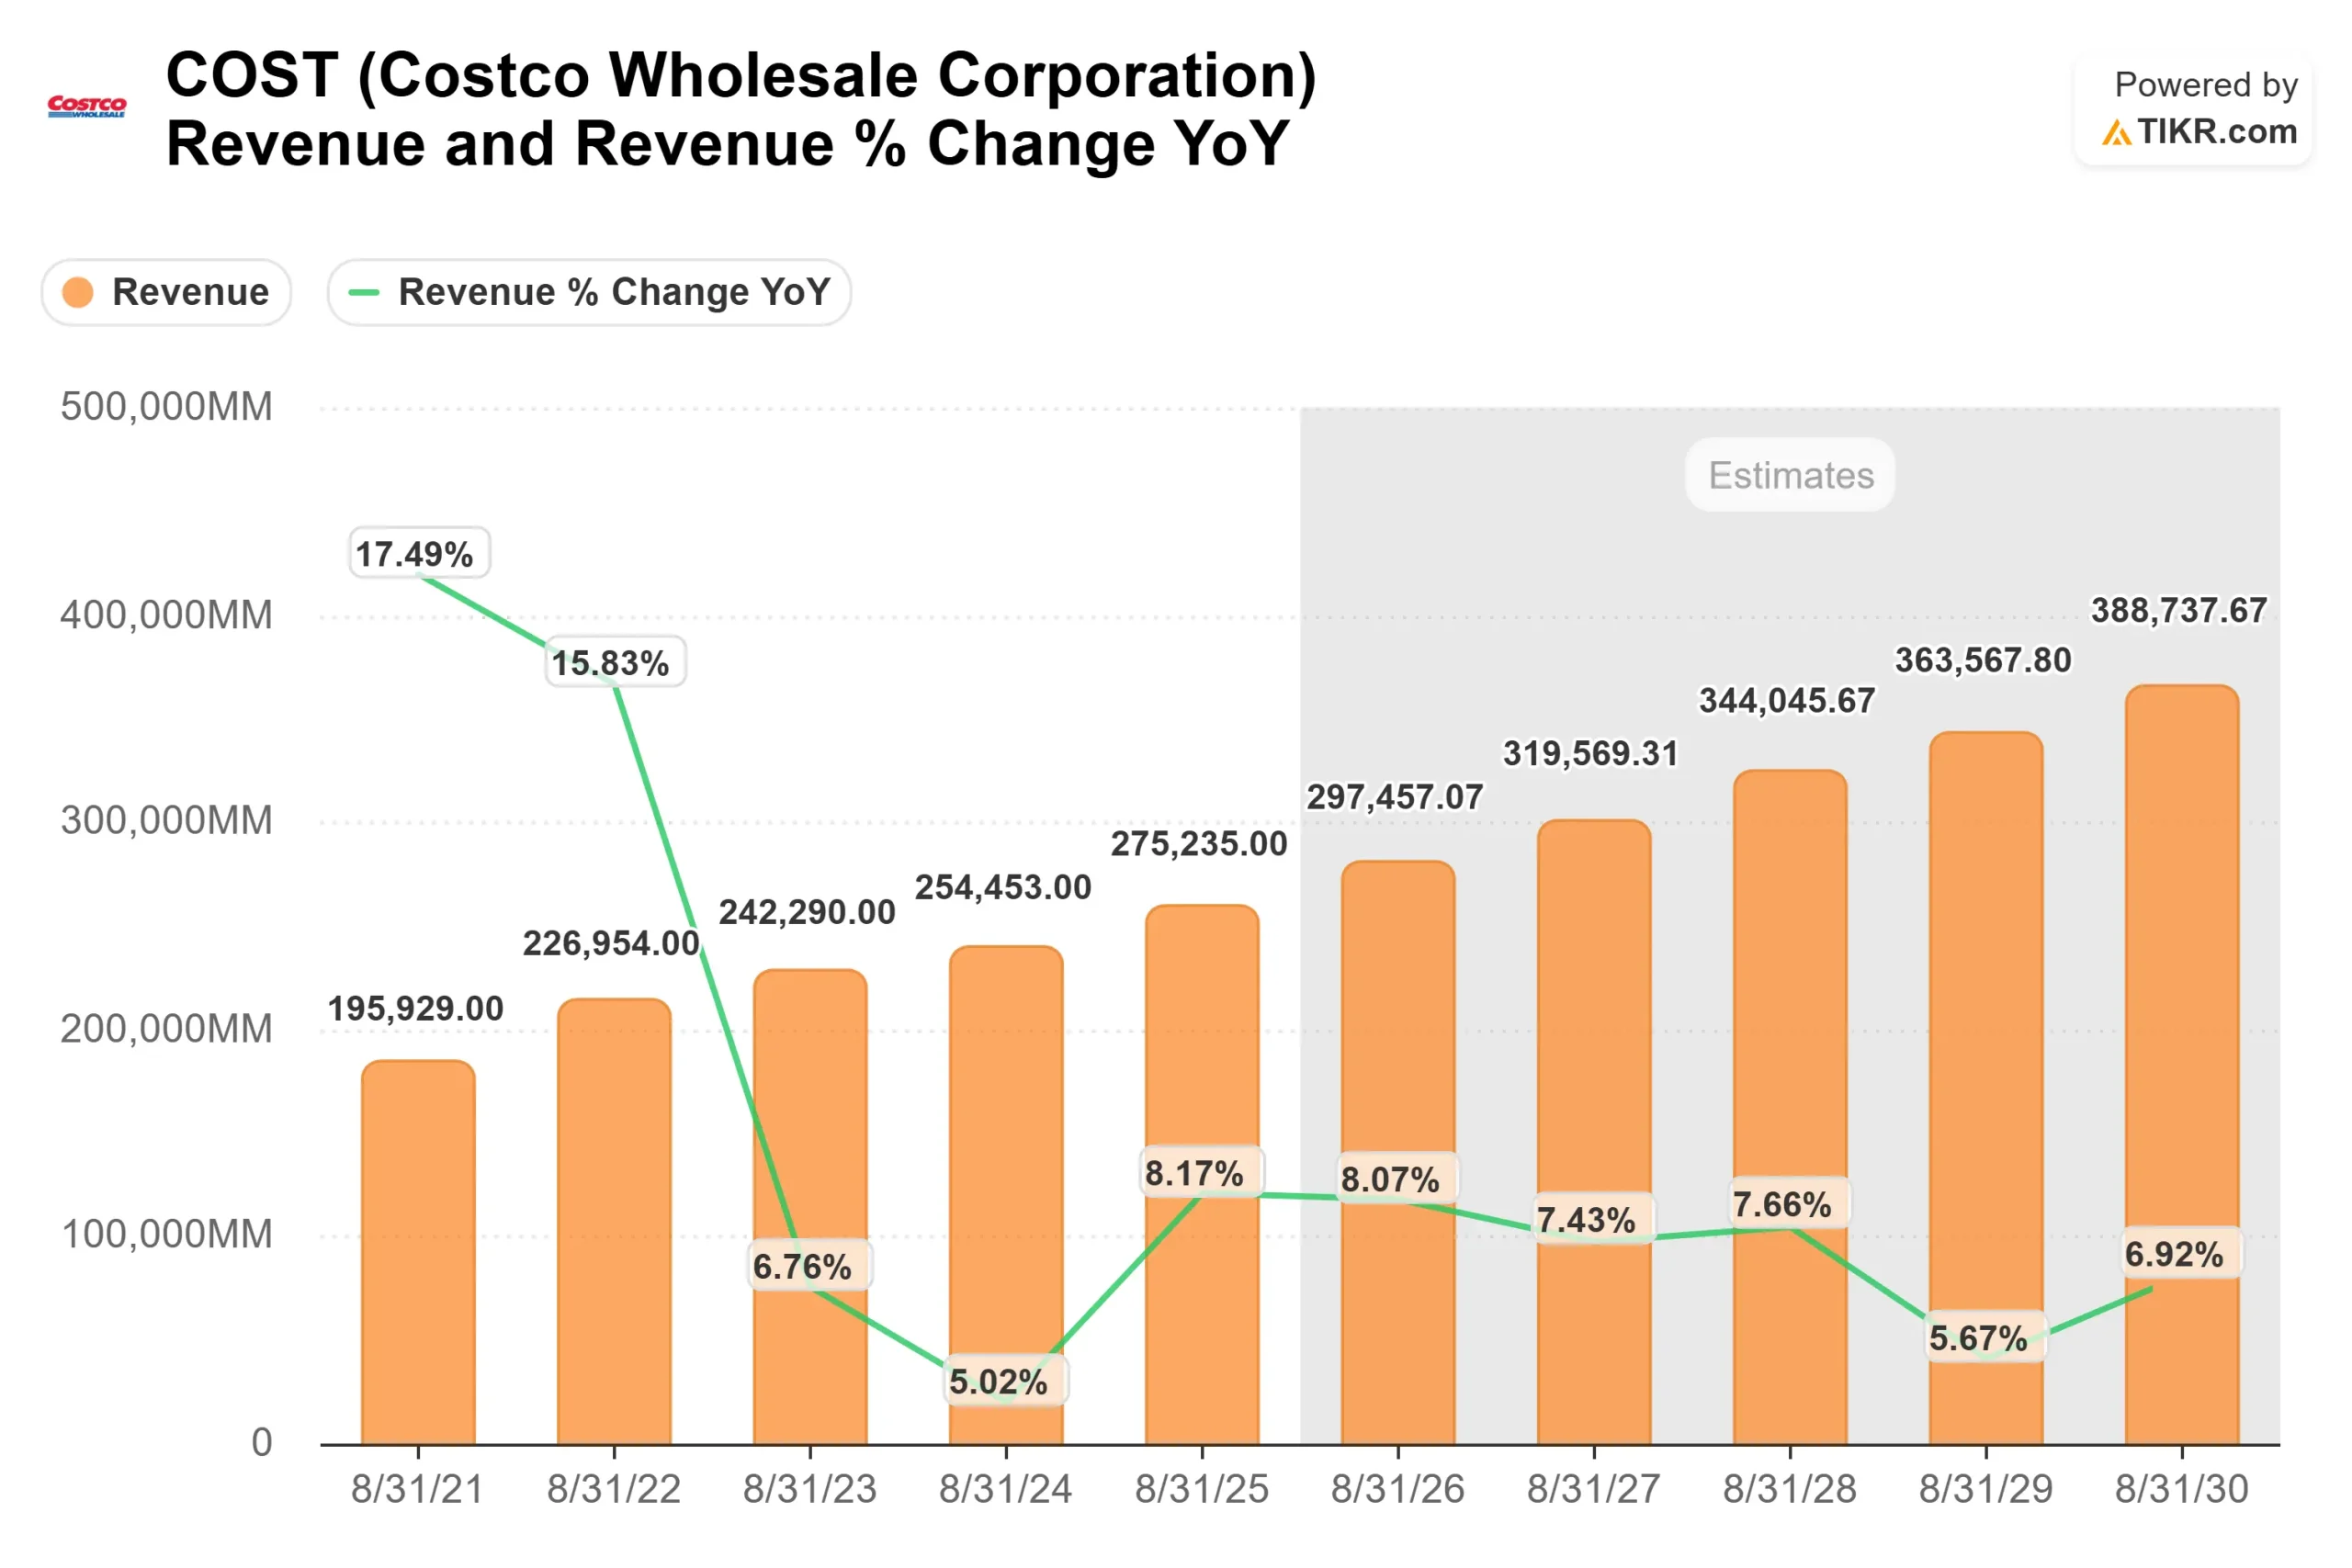
Revenue is projected to grow from $275,235 million in 2025 to $297,457 million in 2026, supported by steady warehouse expansion, comparable sales growth, and continued international penetration.
January’s 7.1% comp growth and 34.4% digitally enabled sales growth reinforce the view that traffic gains and digital momentum are contributing to consistent top line durability.
Operating margin assumptions of 4.0% reflect modest leverage from scale efficiencies, disciplined cost control, and stronger private label penetration through Kirkland Signature.
While merchandise margins remain structurally thin, Costco’s high asset turnover supports strong capital efficiency, with LTM ROIC at 27.7%.
Membership economics remain the primary earnings driver. Renewal rates above 90% in core markets, incremental warehouse openings, and the potential for a membership fee increase create recurring, high margin income that stabilizes operating results even during merchandise margin volatility.
Based on these inputs, the model estimates a target price of $1,183 by 2026, implying about 16% total upside from the current price of $1,018.
Because the expected return exceeds 6% annualized under this framework, the stock screens as undervalued.
At current levels, Costco’s forward performance is likely driven by steady earnings compounding, membership growth, and sustained capital efficiency rather than multiple expansion alone.
Estimate a company’s fair value instantly (Free with TIKR) >>>
Value Any Stock in Under 60 Seconds (It’s Free)
With TIKR’s new Valuation Model tool, you can estimate a stock’s potential share price in under a minute.
All it takes is three simple inputs:
- Revenue Growth
- Operating Margins
- Exit P/E Multiple
From there, TIKR calculates the potential share price and total returns under Bull, Base, and Bear scenarios so you can quickly see whether a stock looks undervalued or overvalued.
If you’re not sure what to enter, TIKR automatically fills in each input using analysts’ consensus estimates, giving you a quick, reliable starting point.
See a stock’s true value in under 60 seconds (Free with TIKR) >>>