
Key Takeaways:
- CoStar Group is still growing quickly, but investors are focused on margin pressure from Homes.com and recent residential marketplace investments.
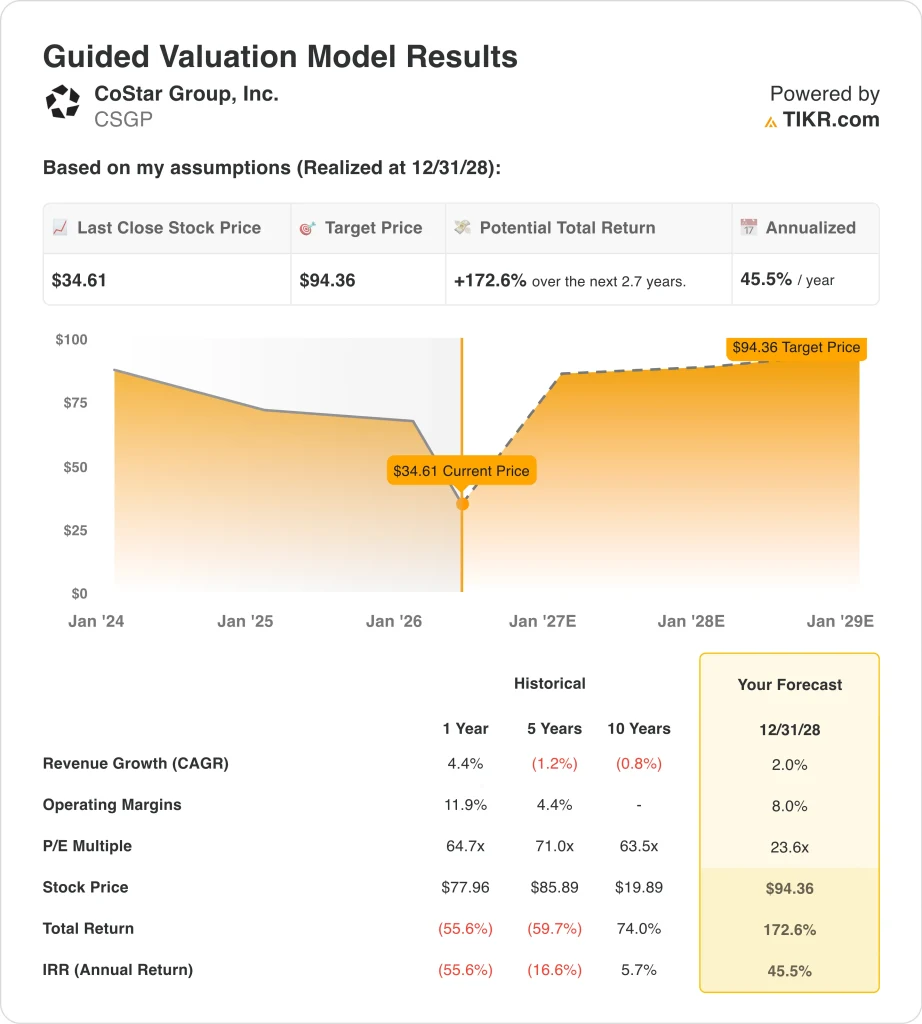
- CSGP stock could reasonably reach $94 per share by December 2028, based on our valuation assumptions.
- This implies a total return of 173% from today’s price of $35, with an annualized return of 46% over the next 2.7 years.
What Happened?
CoStar Group (CSGP) has become one of the more debated real estate technology stocks because revenue is still rising, but profitability has been pressured by heavy investment. The company reported Q1 2026 revenue of $897 million, up 23% year over year, while net income was just $3 million and diluted EPS was $0.01. Adjusted EBITDA doubled to $132 million, but investors remain focused on whether Homes.com can scale profitably.
CoStar is spending aggressively to build a larger residential real estate marketplace. Reuters reported that the company’s prior quarterly forecast disappointed investors because broader commercial real estate uncertainty weighed on demand, while Homes.com investment continued to pressure margins. That explains why the stock has fallen sharply even though revenue growth remains strong.
Management is trying to show that the spending is producing measurable traction. CEO Andy Florance said CoStar delivered $67 million of annualized net new bookings in Q1, up 20% year over year, and noted that Homes.com AI helped drive a 119% increase in organic traffic. The company also said Homes.com members rose to 35,000, up more than 200% from the year-ago period.
For valuation, the stock is now priced in a difficult tradeoff. CoStar’s core data and marketplace businesses remain high-gross-margin assets, but operating income has collapsed because sales, marketing, product, and acquisition-related spending increased.
Here’s why CoStar Group stock could rebound sharply if revenue growth stays intact and margins normalize.
What the Model Says for CSGP Stock
We analyzed the upside potential for CoStar Group stock using valuation assumptions based on its real estate data platforms, Homes.com member growth, and expected margin recovery after a period of elevated investment.
Based on estimates of around 2% annual revenue growth, 8% operating margins, and a normalized P/E multiple of 24x, the model projects CoStar Group stock could rise from $35 to $94 per share.
That would be a 173% total return, or a 46% annualized return over the next 2.7 years.
Our Valuation Assumptions
TIKR’s Valuation Model lets you plug in your own assumptions for a company’s revenue growth, operating margins, and P/E multiple, and calculates the stock’s expected returns.
Here’s what we used for CSGP stock:
1. Revenue Growth: 2%
CoStar’s revenue base has expanded significantly, rising from $1.9 billion in 2021 to $3.2 billion in 2025. Full-year 2025 revenue increased 19%, and Q1 2026 revenue rose 23% year over year to $897 million. That shows the company is still gaining scale across its commercial information, Apartments.com, Homes.com, and newer property technology assets.
The model uses a much lower revenue growth assumption than recent company performance. This is conservative because commercial real estate demand remains uneven, and Reuters noted that broader economic uncertainty has weighed on CoStar’s commercial property platforms. It also reflects the risk that residential growth may take time to translate into durable earnings.
Based on analysts’ consensus estimates, we used a 2% forecast, reflecting a cautious view after a steep share price decline. The company’s own 2026 outlook is much stronger, with full-year revenue guidance of $3.78 billion to $3.82 billion, or around 17% growth at the midpoint. However, the valuation keeps growth muted to avoid assuming a fast recovery.
2. Operating Margins: 8%
CoStar’s margins have compressed sharply because the company is investing heavily in Homes.com, marketing, AI tools, and acquisitions. Operating margin fell from 22% in 2021 to negative territory in 2025, while LTM EBIT margin was around negative 1%. That explains why investors are cautious despite strong revenue growth.
The company still has attractive gross margins, with LTM gross margin near 79%. This means the underlying data and marketplace model can be highly profitable once spending growth slows. The key question is whether Homes.com and other newer platforms can scale without requiring the same level of marketing spend.
Based on analysts’ consensus estimates, we use 8% operating margins, reflecting partial recovery but not a return to CoStar’s historical profitability. This assumption recognizes that adjusted EBITDA is improving, with Q1 adjusted EBITDA up 100% year over year. It also reflects the ongoing cost of competing in residential listings against larger consumer platforms.
3. Exit P/E Multiple: 24x
CoStar’s valuation has reset after the stock’s sharp decline. The stock recently traded near $35, while the mean Street target was about $51, according to the valuation data provided. That spread shows analysts still see recovery potential, but not without execution risk.
A 24x exit P/E is well below CoStar’s historical multiples shown in the model. That lower multiple reflects reduced investor confidence after weak GAAP earnings, high spending, and slower expected EPS growth. It also reflects the market’s demand for clearer evidence that Homes.com can contribute to profit.
Based on analysts’ consensus estimates, we use a 24x exit multiple, reflecting a more disciplined valuation than the company’s prior premium. CoStar’s balance sheet provides support, with limited net debt and substantial equity value. But the stock likely needs stronger earnings conversion before investors reward it with a higher multiple.
Build your own Valuation Model to value any stock (It’s free!) >>>
What Happens If Things Go Better or Worse?
Different scenarios for CSGP stock through 2034 show varied outcomes based on Homes.com monetization, commercial real estate demand, and margin recovery (these are estimates, not guaranteed returns):
- Low Case: Homes.com spending stays elevated, and valuation compresses faster → 17% annual returns
- Mid Case: CoStar stabilizes margins while revenue keeps growing → 19% annual returns
- High Case: Homes.com monetization improves, and earnings growth accelerates → 22% annual returns

CoStar stock will likely move based on whether investors see proof that growth can turn into earnings. The company’s revenue trajectory remains strong, but the market is focused on operating leverage, cash flow, and residential marketplace payback. If adjusted EBITDA keeps expanding and Homes.com member growth holds, the stock could re-rate from today’s depressed level.
See what analysts think about CSGP stock right now (Free with TIKR) >>>
Should You Invest in CoStar Group?
The only way to really know is to look at the numbers yourself. TIKR gives you free access to the same institutional-quality financial data that professional analysts use to answer exactly that question.
Pull up CSGP, and you’ll see years of historical financials, what Wall Street analysts expect for revenue and earnings in the quarters ahead, how valuation multiples have moved over time, and whether price targets are trending up or down.
You can build a free watchlist to track CSGP alongside every other stock on your radar. No credit card required. Just the data you need to decide for yourself.
Analyze CoStar Group stock on TIKR Free→
Looking for New Opportunities?
- See what stock billionaire investors are buying so you can follow the smart money.
- Analyze stocks in as little as 5 minutes with TIKR’s all-in-one, easy-to-use platform.
- The more rocks you overturn… the more opportunities you’ll uncover. Search 100K+ global stocks, global top investor holdings, and more with TIKR.
Disclaimer:
Please note that the articles on TIKR are not intended to serve as investment or financial advice from TIKR or our content team, nor are they recommendations to buy or sell any stocks. We create our content based on TIKR Terminal’s investment data and analysts’ estimates. Our analysis might not include recent company news or important updates. TIKR has no position in any stocks mentioned. Thank you for reading, and happy investing!