Key Stats for Chevron Stock
- Past-6-Month Performance: 20%
- 52-Week Range: $132 to $188
- Valuation Model Target Price: $233
- Implied Upside: 26.4%
Value your favorite stocks like Chevron Corporation with 5 years of analysts’ forecasts using TIKR’s new Valuation Model (It’s free) >>>
What Happened?
Chevron Corporation stock shares have risen about 20% over the last six months, recently trading near $184 per share as energy prices stabilized and investors rotated back into large integrated oil producers with durable cash flow. The stock now trades near the upper end of its $132 to $188 52 week range.
The rally was driven by record production growth and stronger free cash flow resilience, which shifted focus away from commodity volatility and toward structural earnings strength.
Despite oil prices falling nearly 15% year over year, adjusted free cash flow rose over 35% excluding asset sales, signaling improved cost control and operating leverage.
That combination of higher volumes and expanding margins supported the six month advance.
Chevron reported fourth quarter earnings of $2.8 billion, or $1.39 per share, with adjusted earnings of $3 billion.
Production reached record levels, including 1 million barrels of oil equivalent per day in the Permian and completion of the Tengiz Future Growth Project, which added 260,000 barrels per day.
Management guided for 7% to 10% production growth in 2026 from high margin assets including the Permian, Gulf of America, and Eastern Mediterranean.
CEO Mike Wirth said, “Chevron is bigger, stronger and more resilient than ever.”
Institutional activity supported the move. Vanguard increased its stake by 17.9% to 183,790,028 shares worth about $28.54 billion, while NEOS Investment Management raised its position by 78.9% to 235,718 shares.
Northwestern Mutual and Fifth Third Bancorp also added shares. Although some firms trimmed exposure, accumulation by large holders helped reinforce the rally.
See analysts’ growth forecasts and price targets for Chevron Corporation (It’s free) >>>
Is Chevron Undervalued?
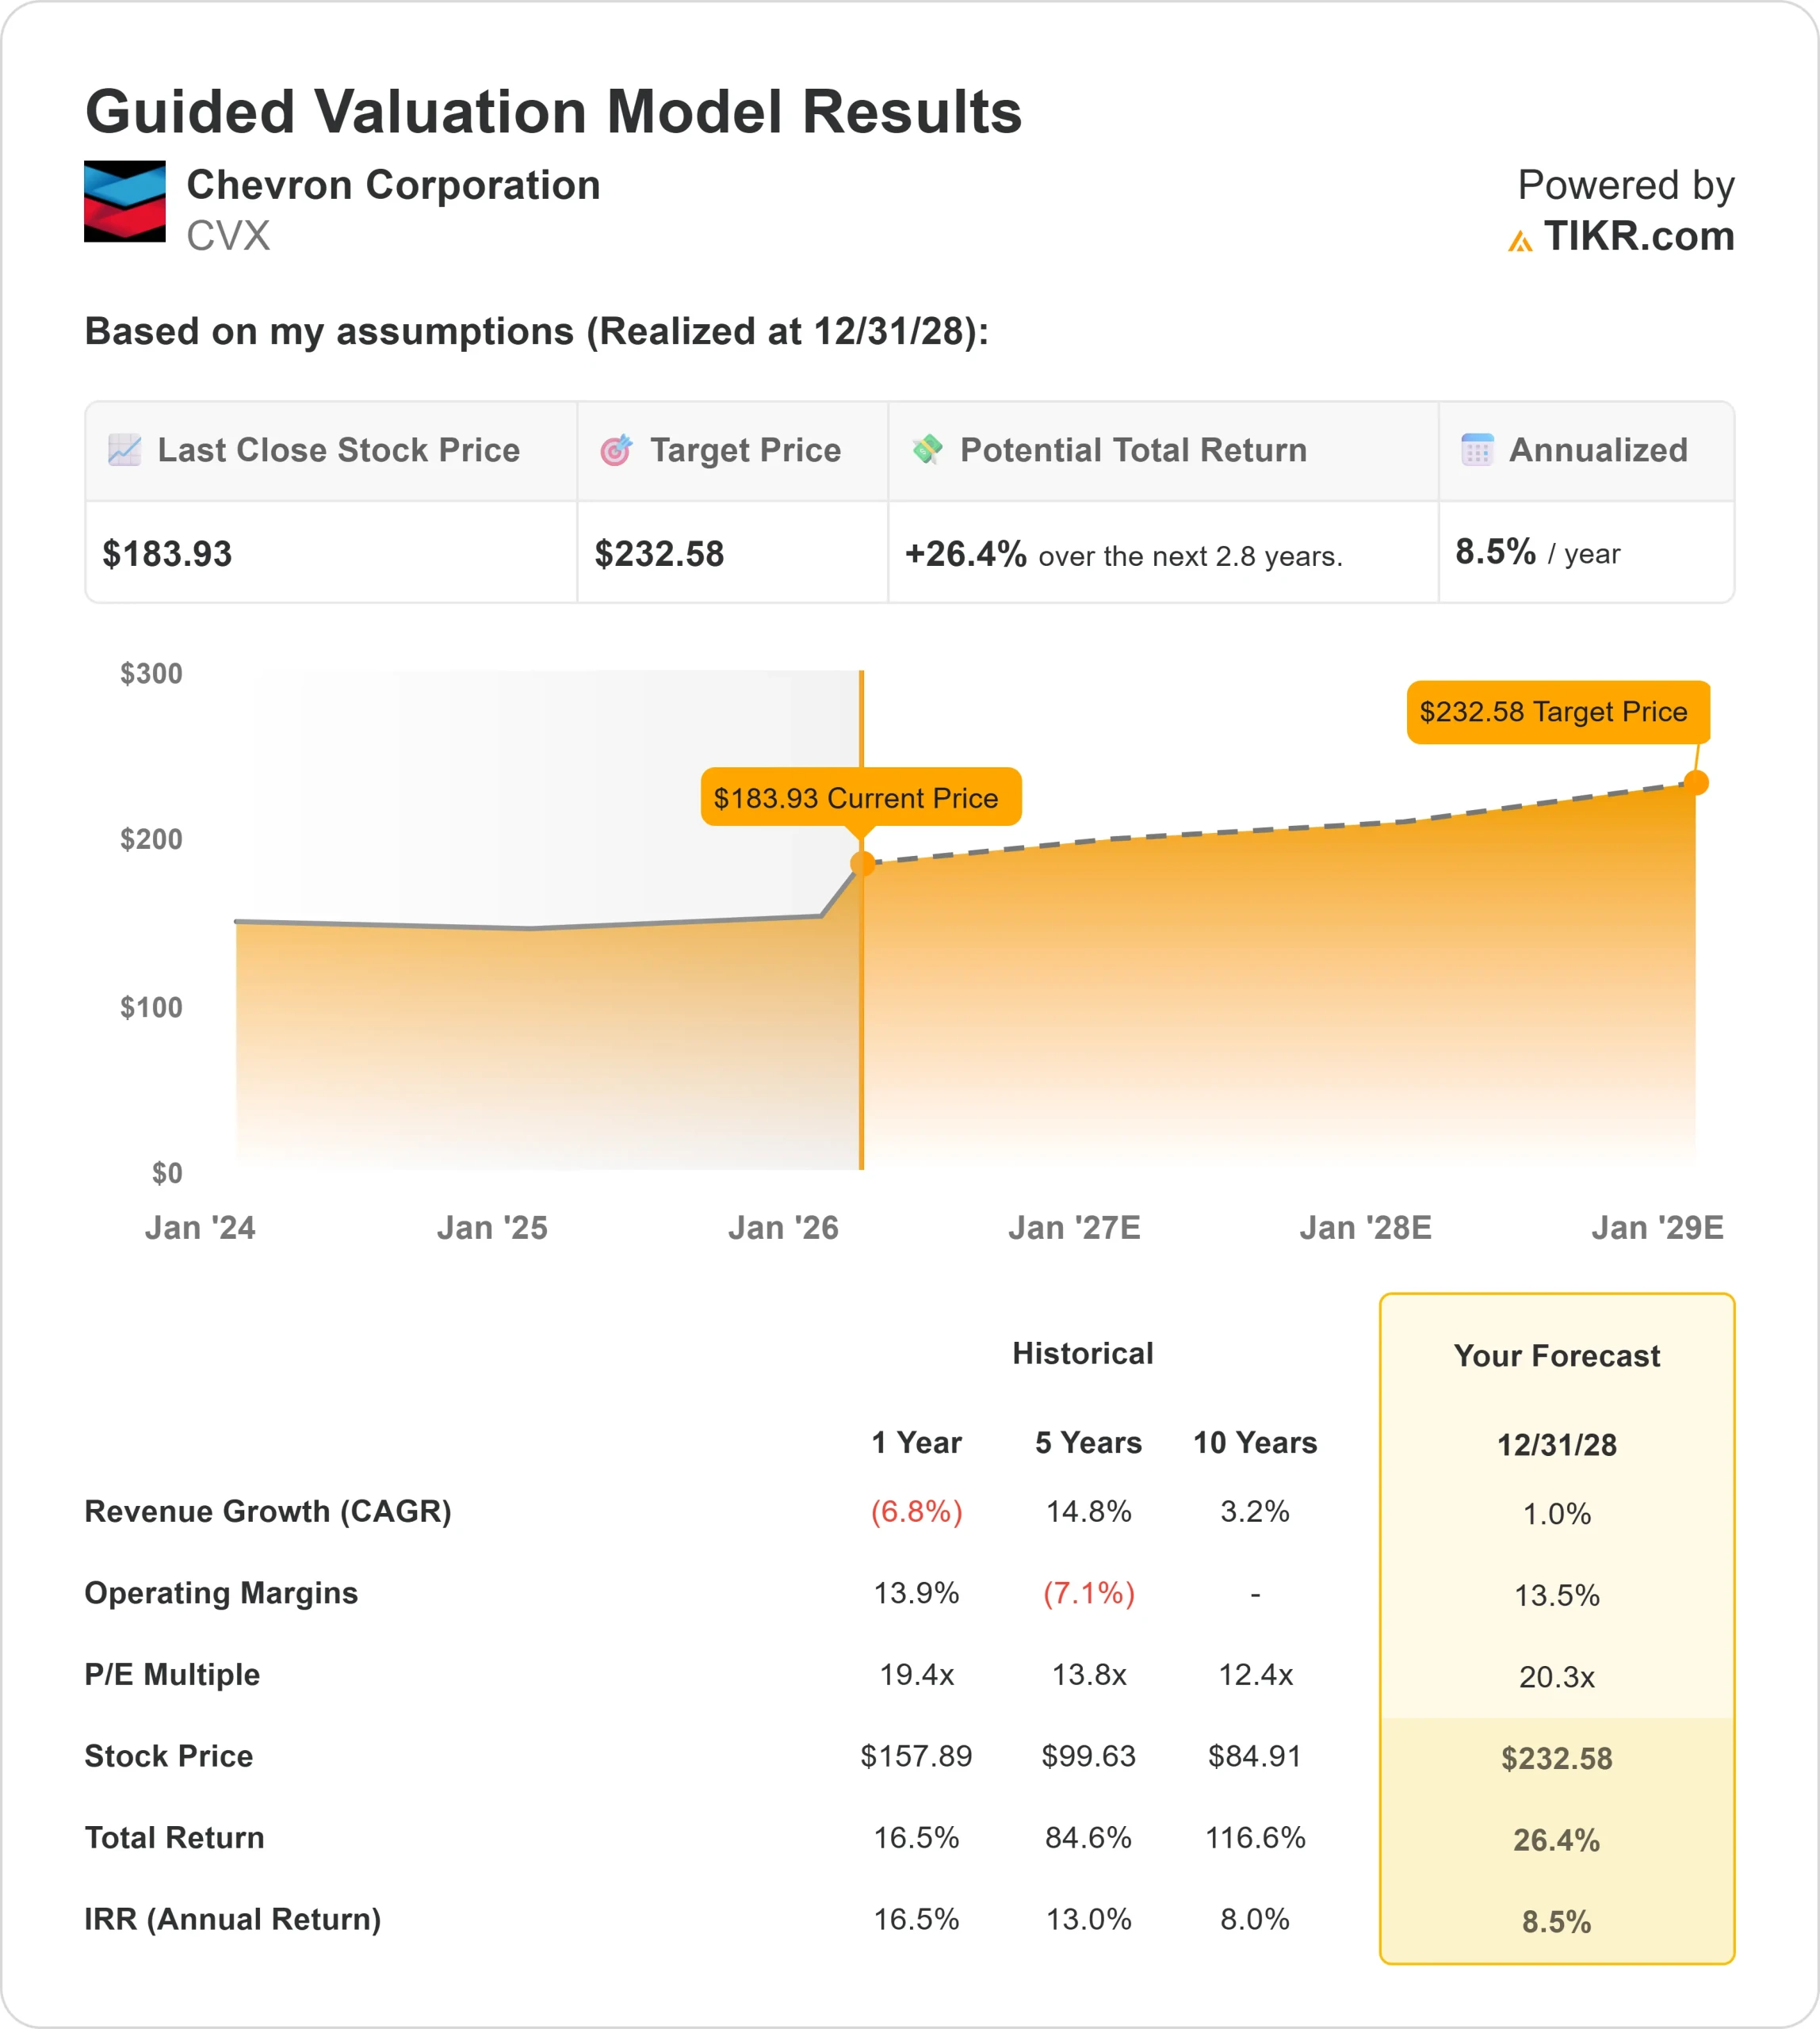
Under valuation assumptions, the stock is modeled using:
- Revenue Growth (CAGR): 1.0%
- Operating Margins: 13.5%
- Exit P/E Multiple: 20.3x
Revenue assumptions remain conservative. Analyst estimates show revenue rising from $189,031 million in 2025 to $194,772.71 million in 2028, implying roughly 1.0% annual growth.
Margin durability is the key driver. Production growth from the Permian, Tengiz ramp up, Gulf of America projects, and Eastern Mediterranean gas expansion shifts the portfolio toward higher cash margin barrels.
Incremental volumes from these assets carry strong operating leverage even if oil prices remain stable.
Cost discipline adds further support. Chevron delivered $1.5 billion in structural savings in 2025 and exited the year above a $2 billion annual run rate, targeting $3 billion to $4 billion by the end of 2026. Efficiency gains across shale and upstream operations enhance free cash flow generation.
Refining strength provides additional balance. Chevron’s complex downstream system can benefit from favorable heavy crude differentials, supporting margins across cycles.
Based on these inputs, the model estimates a target price of $232.58, implying about 26.4% total upside from $183.93. Under your framework where upside above 6% qualifies as undervalued, Chevron screens as undervalued.
In 2026, performance will hinge on continued production growth, cost efficiency, refining stability, and sustained free cash flow rather than aggressive revenue expansion.
Estimate a company’s fair value instantly (Free with TIKR) >>>
Value Any Stock in Under 60 Seconds (It’s Free)
With TIKR’s new Valuation Model tool, you can estimate a stock’s potential share price in under a minute.
All it takes is three simple inputs:
- Revenue Growth
- Operating Margins
- Exit P/E Multiple
From there, TIKR calculates the potential share price and total returns under Bull, Base, and Bear scenarios so you can quickly see whether a stock looks undervalued or overvalued.
If you’re not sure what to enter, TIKR automatically fills in each input using analysts’ consensus estimates, giving you a quick, reliable starting point.
See a stock’s true value in under 60 seconds (Free with TIKR) >>>