Key Stats for Carvana Co. (CVNA)
- 52-Week Range: $54.46 – $97.38
- Current Price: $69.80 (June 8, 2026)
- Street Target Price (Mean): ~$93
- TIKR Model Target (Mid): ~$141 (~18% annualized)
- Q1 2026 Revenue: $6.43B (+52% YoY)
- Q1 2026 Retail Units: 187,393 (+40% YoY)
- Q1 2026 Adjusted EBITDA: $672M (10.4% margin)
- Q1 2026 Net Income: $405M
- NTM P/E: ~41x
- Net Debt/EBITDA: 1.13x
Most investors never know if a stock is truly undervalued or overpriced. TIKR’s professional-grade valuation tools give you a clear, data-backed answer across 60,000+ stocks for free →
Six Records and a 17% Decline: What Carvana Just Reported
Carvana sold 187,393 vehicles in Q1 2026, up 40% year over year, marking the sixth consecutive quarter of 40% or greater retail unit growth. Revenue hit $6.43 billion, up 52%, an all-time quarterly record.
Adjusted EBITDA came in at $672 million at a 10.4% margin, up from $488 million and an 11.5% margin a year earlier. Management guided to sequential increases in both retail units and adjusted EBITDA in Q2, representing all-time company records for both metrics.
CEO Ernie Garcia described the momentum directly: “The used vehicle industry is designed to help customers trade cars with one another, and our vertically integrated model is built to make that process easier, faster, more efficient, and more fun.”

The revenue and gross margin chart shows the broader arc: revenue bottomed at $10.8 billion in 2023, when the company deliberately pulled back volume to stabilize unit economics, then recovered to $13.7 billion in 2024 and accelerated to $20.3 billion in 2025.
Gross margins recovered from 9% during the 2022 crisis to above 20% in both 2024 and 2025, reflecting the structural repair in how the business generates profit per vehicle sold.
See exactly how Carvana stock’s analyst price targets have moved over the past 12 months, and track every rating change as it happens, with TIKR for free →
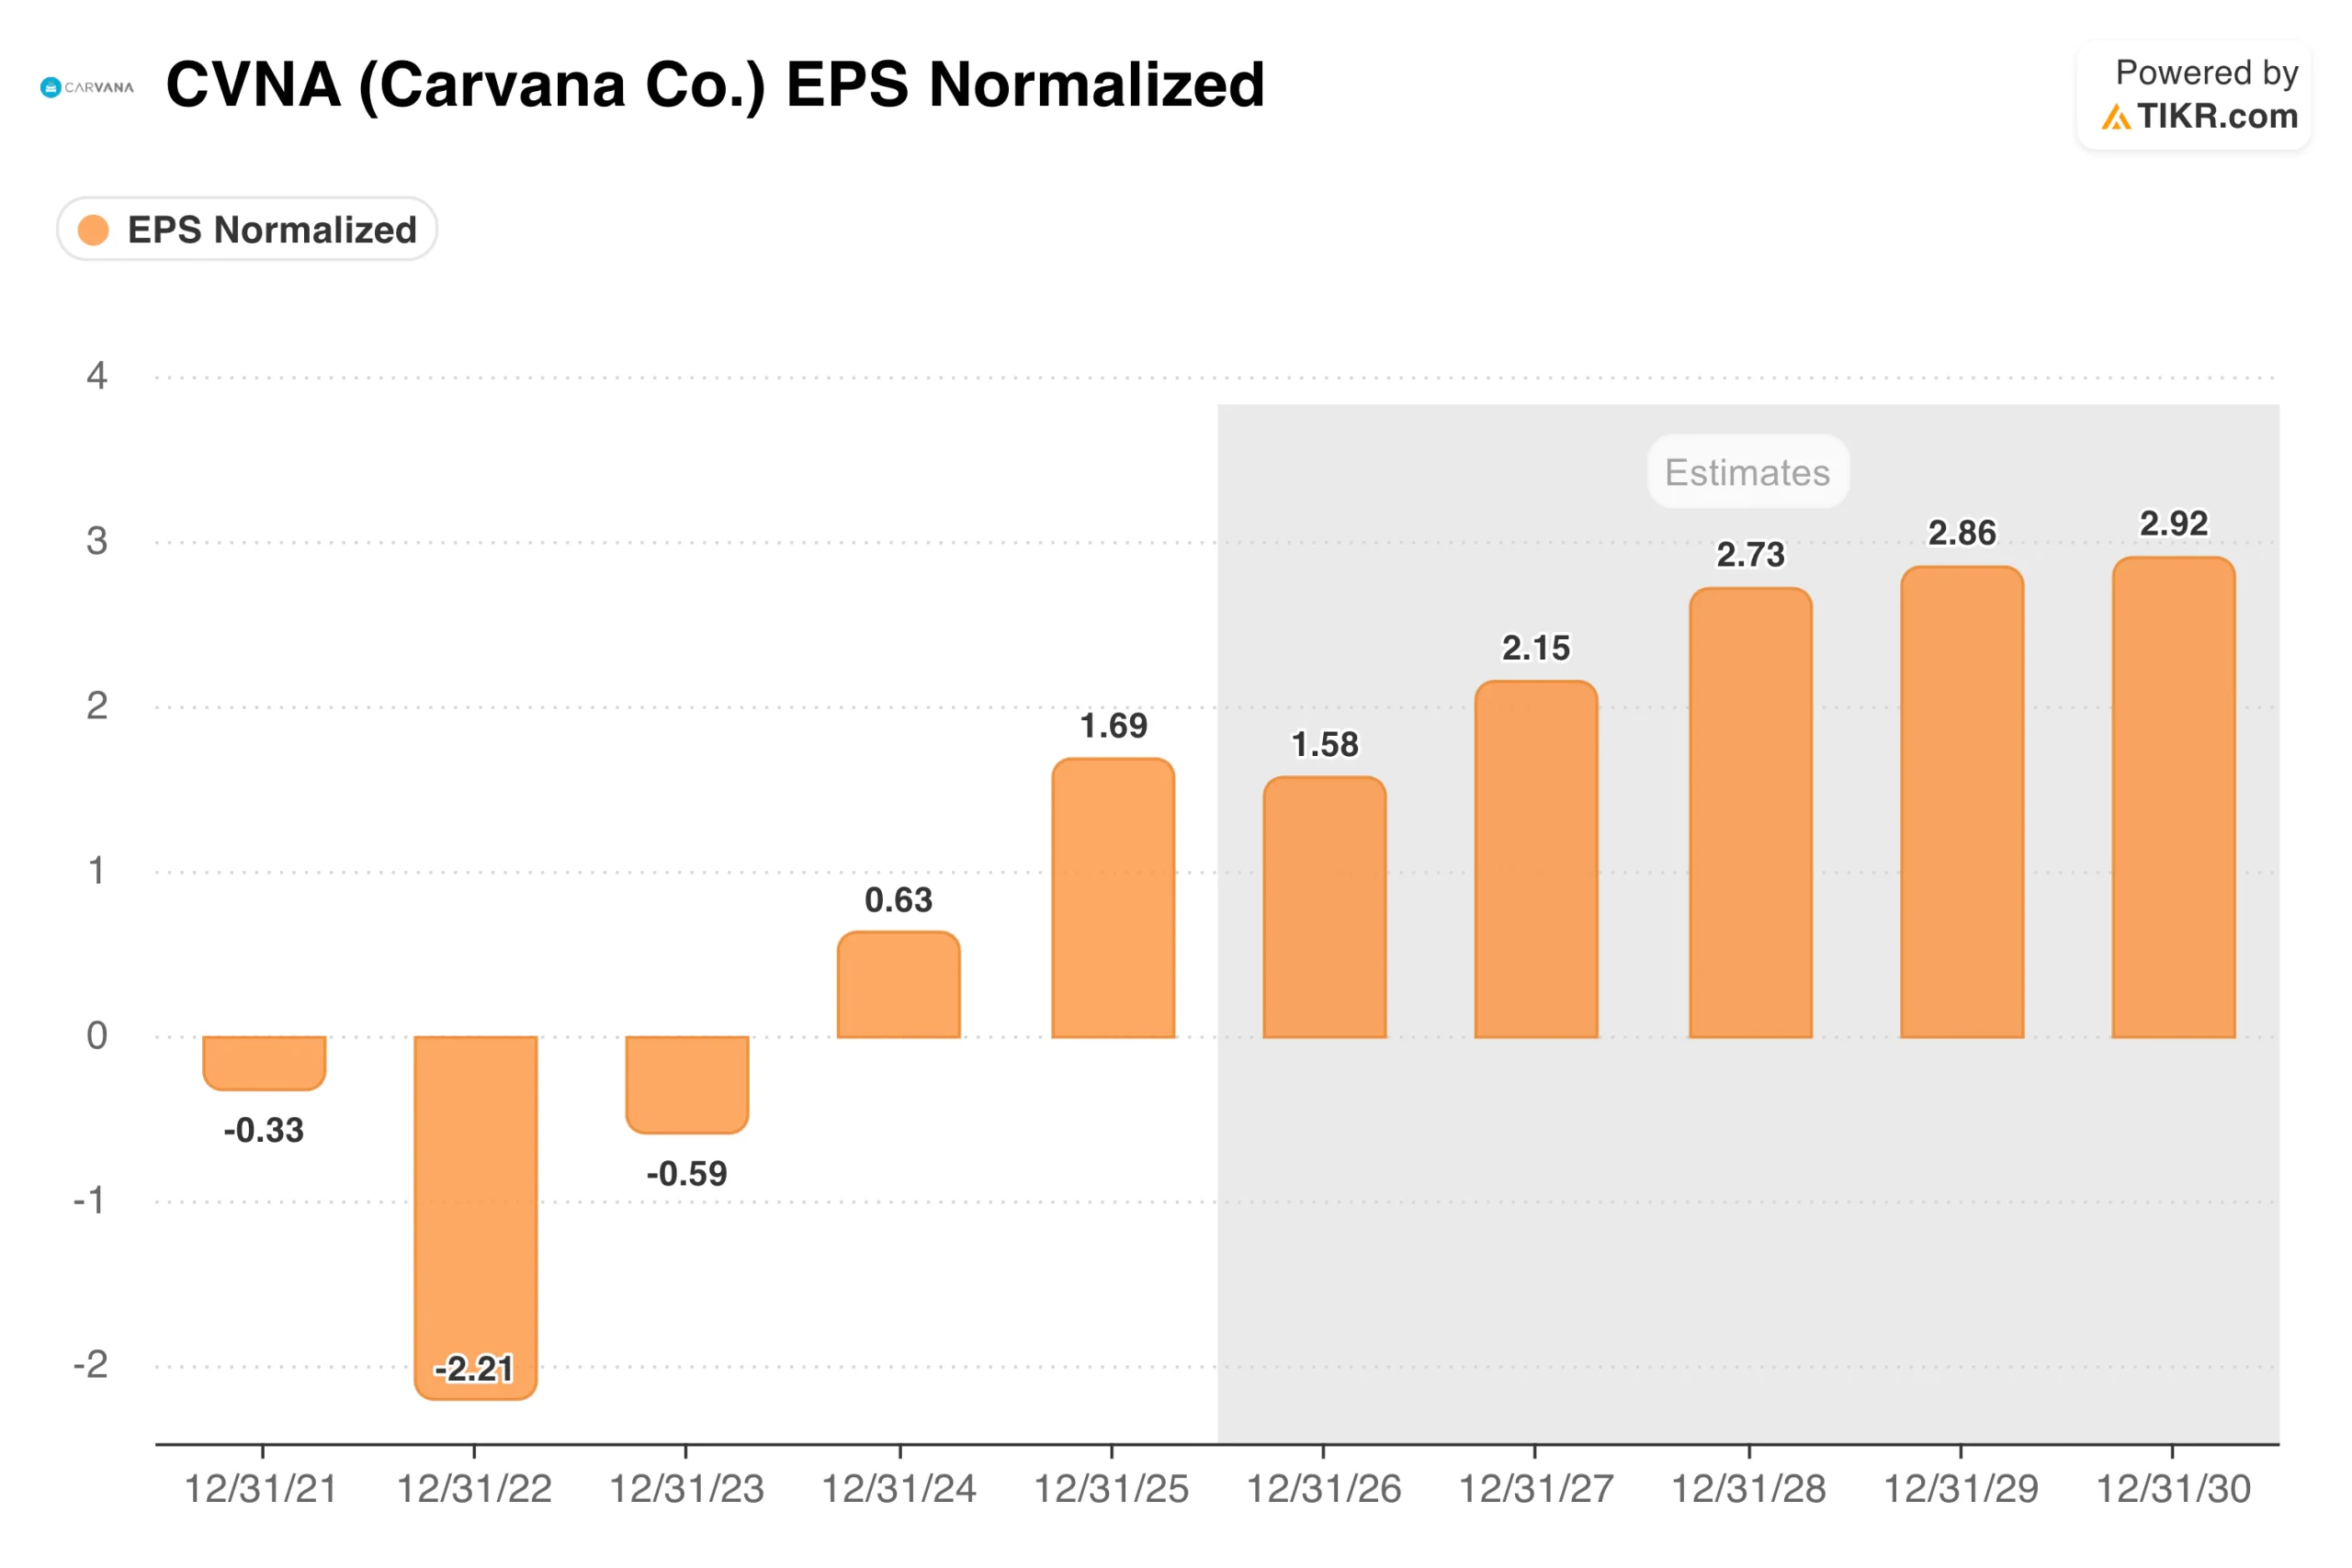
From -$2.21 to $1.69: The Earnings Transformation
The EPS chart captures one of the sharpest corporate turnarounds in recent market history. Carvana lost $2.21 per share in 2022 during its near-bankruptcy period, posted a smaller loss in 2023 as the restructuring held, then turned profitable with $0.63 in 2024 and $1.69 in 2025.
Forward consensus estimates point toward nearly $3 per share by 2030.
The balance sheet rehabilitation runs alongside that earnings trajectory. Net debt to EBITDA stood at 1.13 times at the end of Q1 2026.
Three years ago, the company was negotiating with creditors. The forward earnings path is now funded by operations rather than debt issuance, which fundamentally changes the business’s risk profile.
Wall Street’s best ideas don’t stay hidden for long. Catch analyst upgrades, earnings beats, and revenue surprises on thousands of stocks the moment they happen with TIKR for free →
What the TIKR Model Says About CVNA
TIKR’s model targets around $141 for Carvana stock under its mid-case assumptions, implying roughly 18% annualized return from the current price.

The model reflects a revenue growth trajectory consistent with Carvana continuing to gain share from its current roughly 1.6% of the U.S. used-car market, with margins expanding toward the company’s long-term 13.5% adjusted EBITDA target.
Worth noting is that the model incorporates meaningful P/E multiple compression over the forecast period, which means the return scenario is driven by earnings growth rather than an expansion of the multiple from current levels.
The street mean target of around $93 implies about 33% upside without assuming the full long-term scenario.
What the Bulls Are Betting On
- The market share runway is enormous. At roughly 1.6% of U.S. used car sales, Carvana has years of high-rate growth ahead before approaching structural saturation. Each additional 1% of market share represents roughly $15 billion in annual revenue at current industry volumes.
- Operating leverage improves as scale grows. Fixed infrastructure costs spread across more units, SG&A per unit is declining, and logistics efficiency is at record levels. The path from 10% to 13.5% adjusted EBITDA margins is well-defined and does not require heroic assumptions.
- The balance sheet is no longer a risk. Net debt-to-EBITDA of 1.13 times, up from a near-insolvent position two years ago, represents a fundamental change in the investment thesis.
What the Bears Are Watching
Gross profit per unit declined modestly year over year in Q1. Management acknowledged higher reconditioning costs in recent quarters, and investors will watch GPU closely as the company scales into new geographies and integrates with ADESA.
The valuation embeds a lot of the growth story. At roughly 41 times forward earnings, any deceleration in unit growth or gross profit per unit compression would quickly and materially pressure the multiple.
Tariffs and the used car supply create near-term uncertainty. Higher auto parts costs could weigh on reconditioning margins, and improving new-car affordability could shift used-car demand dynamics in ways that are difficult to model precisely.
Access Professional Tools to Analyze CVNA stock on TIKR for Free →
Should You Invest in Carvana Co.?
Carvana is one of the few businesses in any industry growing retail volumes by 40% per quarter while simultaneously improving its balance sheet and expanding margins. The stock, down 17% year-to-date despite record operational results, reflects macro concerns and valuation compression, not business deterioration.
At roughly 41 times forward earnings, conviction is required. The TIKR model’s mid-case of around $141, with roughly an 18% annualized return, makes the math compelling for investors who believe the market share story has further to run from here.
Put on TIKR, and you get access to years of historical financials, what Wall Street analysts expect for revenue and earnings in the quarters ahead, how valuation multiples have trended over time, and whether price targets are trending up or down. You can build a free watchlist to track Carvana alongside every other stock on your radar. No credit card required. Just the data you need to decide for yourself.
Looking for New Opportunities?
- See what stocks billionaire investors are buying so you can follow the smart money.
- Analyze stocks in as little as 5 minutes with TIKR’s all-in-one, easy-to-use platform.
- The more rocks you overturn… the more opportunities you’ll uncover. Search 100K+ global stocks, global top investor holdings, and more with TIKR.
Disclaimer:
Please note that the articles on TIKR are not intended to serve as investment or financial advice from TIKR or our content team, nor are they recommendations to buy or sell any stocks. We create our content based on TIKR Terminal’s investment data and analysts’ estimates. Our analysis might not include recent company news or important updates. TIKR has no position in any stocks mentioned. Thank you for reading, and happy investing!