

Key Stats for Fifth Third Stock
- 52-Week Range: $33 to $55
- Current Price: $50
- Street Mean Target: $56
- Street High Target: $61
- TIKR Model Target (Dec. 2030): $71
What Happened?
Fifth Third Bancorp (FITB), a Cincinnati-based regional bank with roughly $294 billion in combined assets, closed its all-stock merger with Comerica on February 1, becoming the ninth-largest bank in the United States.
The deal, valued at approximately $12.7 billion, gives Fifth Third Bancorp stock a dramatically different earnings profile, with management guiding full-year net interest income (the spread between what the bank earns on loans and pays on deposits) to between $8.6 billion and $8.8 billion for 2026.
Fifth Third delivered Q4 2025 normalized EPS of $1.04, a 22% increase year-over-year, before a single dollar of Comerica cost synergies reached the income statement.
CEO Tim Spence stated on the Q4 2025 earnings call that “we are excited about our momentum as we enter 2026,” pointing to $850 million in targeted annual pretax expense synergies and more than $500 million in identifiable revenue synergies over the next five years.
The synergy execution timeline accelerated meaningfully after regulatory approvals arrived in under 100 days, allowing Fifth Third to pull customer conversion forward to Labor Day from mid-October, setting up a clean fourth quarter 2026 that management expects to reflect the return and efficiency levels originally targeted for full-year 2027.
Truist Securities trimmed its price target to $53 from $60 in March, flagging softer-than-expected Q1 guidance as a headwind for a stock it described as a “beat and raise” story, creating the kind of short-term sentiment gap that long-term investors have historically used as an entry point in bank integration cycles.
Wall Street’s Take on FITB Stock
The Comerica close transforms Fifth Third from a well-run Midwest regional into a top-10 national franchise, and the EPS math for 2027 is where the re-rating case lives.
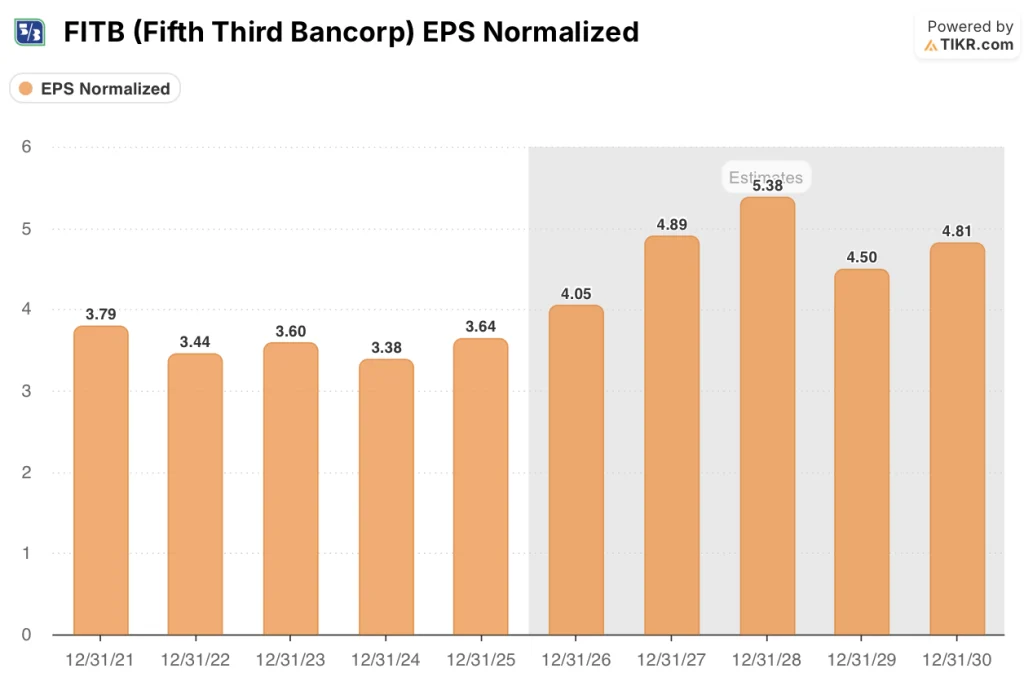
FITB’s normalized EPS is expected to reach $4 in 2026 and $5 in 2027, a roughly 21% increase year-over-year, as the first full year of Comerica’s consolidated revenue base combines with around $400 million in expense synergies to accelerate earnings per share toward the deal’s original 2027 targets.

Sixteen of the 21 analysts covering Fifth Third Bancorp stock hold buy or outperform ratings, with a mean price target of $56, implying around 13% upside from current levels, as Wall Street waits for the Labor Day conversion to demonstrate that synergy targets are tracking on time and on budget.
The target range spans $49 to $61, a spread that captures two genuinely different outcomes: at $49, the bear case prices in integration slippage and NII shortfall; at $61, the bull case prices in clean execution and accelerating revenue synergies from embedded payments and Texas de novo expansion.
Trading at roughly 12x forward normalized earnings against a 2027 EPS estimate near $5, Fifth Third Bancorp stock appears undervalued given the 21% earnings growth trajectory tied directly to a synergy program that is already running ahead of the original $320 million 2026 savings target.
The signal worth watching: management accelerated conversion to Labor Day from mid-October, which CFO Bryan Preston said on the Q4 call would let the fourth quarter of 2026 reflect 2027-level returns and efficiency, pulling the re-rating timeline forward by at least one quarter.
If NII in the combined franchise undershoots the $8.6 billion to $8.8 billion full-year guidance range, the synergy timeline credibility breaks and the 2027 EPS target of around $5 loses its floor.
Q1 2026 results, expected to include only two months of Comerica activity, will be the first live read on whether the $1.93 billion NII guidance and $158-159 billion average loan guidance are tracking, and whether management’s beat-and-raise posture can survive its first full quarter as a combined entity.
Fifth Third Bancorp Financials
Fifth Third’s net interest income reached $5.98 billion in full-year 2025, a 6.3% increase year-over-year and the bank’s second consecutive record, driven by net interest margin expansion to 3.13% from 2.97% a year prior.

The NII growth reflects disciplined liability management through the rate cycle, with interest-bearing deposit costs falling 40 basis points year-over-year as Fifth Third captured repricing benefits on fixed-rate assets while reducing wholesale funding by 14% sequentially in Q4.
Total revenues before provision for loan losses reached $9.02 billion in 2025, a 6.4% increase year-over-year, as non-interest income of $3.04 billion (up 7%) contributed through wealth management fees of $185 million (a Q4 record), commercial payments growth of 8%, and Newline-related deposits that reached $4.3 billion.
The tension in the income statement heading into 2026 is the step-up in non-interest expense: the combined company’s full-year expense guide of $7.2-7.3 billion (excluding CDI amortization) reflects a temporarily bloated cost base before synergies flow through, which will keep the efficiency ratio elevated in the first half before the Labor Day conversion unlocks the full run-rate savings.
What Does the Valuation Model Say?
The arithmetic on Fifth Third’s 2027 earnings target is unusually concrete for a bank integration: management has committed to a 19% return on tangible common equity and a sub-53% efficiency ratio, with CFO Bryan Preston stating on the Q4 call that those 2027 targets should be achievable in the fourth quarter of 2026 alone given the accelerated Labor Day conversion timeline.

At roughly 12x a 2027 normalized EPS estimate near $5, FITB’s forward earnings multiple sits below the 14-15x range the bank commanded during its pre-merger growth phase, and with 21% EPS growth expected in 2027 backed by a synergy program running ahead of its own schedule, Fifth Third Bancorp stock appears undervalued relative to the earnings compounding power now embedded in the franchise.
The central tension in the Fifth Third investment case is not whether the synergies exist but whether the integration timeline holds under the pressure of combining the 9th and 22nd largest U.S. banks simultaneously.
Bull Case: Synergy Delivery Accelerates the Re-Rating
- $400 million in 2026 expense synergies already tracking ahead of the original $320 million plan, with half of the incremental savings reinvested in Texas marketing and commercial hiring
- Labor Day conversion pulls the clean-quarter earnings read forward to Q4 2026, shortening the overhang period by at least one full quarter
- Newline embedded payments revenues more than doubled year-over-year in Q4 2025, and the platform now has Stripe and Trustly as bannered clients, creating a capital-light fee growth engine independent of loan demand
- Texas de novo program has over 40 of 150 sites already secured, with management targeting top-4 branch share in Dallas, Houston, and Austin by end of the decade
- Southeast deposit vintages have outperformed goals for every year since 2018, with the 2025 vintage tracking at 213% of deposit goals
Bear Case: Integration Complexity Creates a Prolonged Discount
- Truist’s March PT cut to $53 cited Q1 NII guidance of $1.93 billion as softer than expected, raising questions about whether the full-year $8.6-8.8 billion NII range is achievable
- GAAP EPS is expected to decline 11.5% in 2026 to around $3 as $1.3 billion in acquisition-related charges flow through, creating headline noise that can suppress multiple expansion even when normalized earnings are growing
- Comerica’s Southwest branches operate at an average of $30 million in deposits per branch versus Fifth Third’s target of $70-80 million, meaning the consumer deposit transformation is a multi-year project, not a 2026 event
- The $500 million revenue synergy target over five years is long-dated and dependent on Newline cross-sell into Comerica’s Tech and Life Sciences vertical, a build that management acknowledges requires the conversion to complete first
Should You Invest in Fifth Third Bancorp?
The only way to really know is to look at the numbers yourself. TIKR gives you free access to the same institutional-quality financial data that professional analysts use to answer exactly that question.
Pull up FITB stock and you’ll see years of historical financials, what Wall Street analysts expect for revenue and earnings in the quarters ahead, how valuation multiples have moved over time, and whether price targets are trending up or down.
You can build a free watchlist to track Fifth Third Bancorp alongside every other stock on your radar. No credit card required. Just the data you need to decide for yourself.
Access Professional Tools to Analyze FITB stock on TIKR for Free →


