Key Stats for Best Buy Stock
- 52-Week Range: $59 to $85
- Current Price: $62
- Street Mean Target: $73
- Street High Target: $90
- TIKR Model Target (Jan. 2031): $96
What Happened?
Best Buy (BBY), the largest specialty consumer electronics retailer in the United States, is navigating the most contested stretch of its investment story in years as Goldman Sachs issued a rare double downgrade to Sell on April 14, pushing Best Buy stock within striking distance of its $59.16 52-week low.
Goldman analyst Kate McShane cited a specific near-term risk: soaring memory component prices, driven by the AI buildout pulling supply away from consumer electronics, are expected to compress margins and push laptop and computer prices higher in the months ahead.
The timing is awkward, because Best Buy just delivered a Q4 FY26 adjusted EPS of $2.61, beating the $2.47 consensus by 5.7%, while also posting FY26 net earnings growth of 15.3% to $1.07 billion on revenue of $41.69 billion.
The Q4 beat was powered by Best Buy Ads, the company’s retail media business that generated just over $900 million in gross advertising collections in FY26, up more than 7%, and by Marketplace, the third-party seller platform that produced approximately $300 million in domestic gross merchandise value in Q4 alone.
CEO Corie Barry stated on the Q4 earnings call that “Increased demand for memory components is driving cost inflation and supply uncertainty,” adding that the company was bringing in inventory as aggressively as possible and narrowing assortments to protect in-stock levels across computing.
The platform businesses are the structural story that the Goldman downgrade risks obscuring: Best Buy guided FY27 gross profit rate improvement of approximately 30 basis points driven specifically by Ads and Marketplace growth, with management calling FY27 the last major investment year before more material operating income rate contribution begins in FY28 and FY29.
Wall Street’s Take on BBY Stock
The Goldman downgrade reframes the earnings beat: Best Buy stock posted a clean profit outperformance in Q4, but the question heading into FY27 is whether memory inflation will erode the product margins that offset the Ads and Marketplace investment cycle.
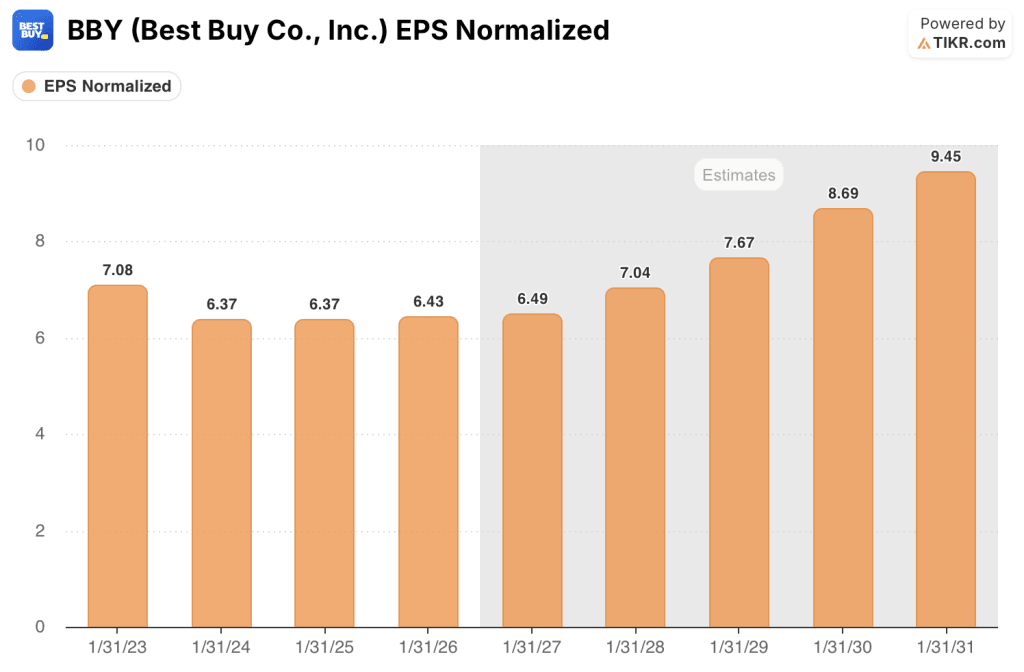
BBY’s EPS Normalized is expected to grow from $6.43 in FY26 to around $6 in FY27, essentially flat, before accelerating to around $7 in FY28 and around $8 in FY29, a trajectory driven by Ads and Marketplace reaching operating income contribution from their current investment phase.

The consensus picture is split: 7 analysts rate Best Buy stock a buy or outperform while 16 hold and 2 sit at underperform or sell, with a mean price target of $73 implying roughly 18% upside from $62.06 as Wall Street waits to see whether the memory headwind is a Q1 event or a multi-quarter earnings drag.
The spread between Goldman’s Street-low $59 and the Street-high $90 defines the debate precisely: the bears need memory costs to flow through in quantity during Q2 and Q3, while the bulls need the Ads and Marketplace gross profit contribution to absorb the product margin pressure.
Priced at roughly 9.6x forward earnings against a five-year average forward P/E closer to 12x, and with EPS expected to compound at around 8% annually through FY28 as the Ads platform scales, Best Buy stock appears undervalued relative to both its own history and the growth visibility its new profit streams provide.
Best Buy is currently the exclusive national retail partner for RGB television technology launching mid-FY27, a partnership with all major TV vendors that management described as the most significant home theater innovation since OLED debuted in 2013, providing a catalyst for home theater comp recovery that the Goldman downgrade does not fully account for.
If memory inflation proves worse than modeled, product margin rates in computing could fall below the flat assumption embedded in FY27 guidance, compressing EPS toward the low end of the $6.30 to $6.60 range and potentially breaking the bull case.
Q1 FY27 comparable sales and gross profit rate results, expected in May, are the key data points to watch: management guided around 1% comp growth and gross profit rate expansion of roughly 10 basis points year over year for the quarter, and the actual outcome will confirm or deny whether memory is manageable.
Best Buy Stock Financials
Best Buy generated operating income of $1.77 billion in FY26, representing a 4.2% operating margin on revenue of $41.69 billion, with operating income up 2.0% year over year as cost discipline offset a near-flat top line.

The gross profit story is the most important detail in the income statement: BBY held gross margins at 22.5% in FY26, matching FY22 levels after four consecutive years of compression, with the stabilization driven by Ads and Marketplace commissions offsetting lower product margin rates and heavier promotions.
The operating leverage trajectory is modest but real: BBY reduced SG&A from $8.54 billion in FY22 to $7.59 billion in FY26 while roughly maintaining revenue scale, a nearly $1 billion structural cost reduction that protects operating income even as product margins face near-term pressure from memory inflation.
What Does the Valuation Model Say?
The TIKR mid-case model, which embeds around 1.3% revenue CAGR and a 3.5% net income margin through FY31, generates a target price of around $96, implying 54% total return over approximately five years at a 9% annualized rate, a return profile that assumes Ads and Marketplace convert from investment-phase drag to operating income contributors starting in FY28.

With forward EPS of around $6 putting BBY at roughly 9.6x earnings against a five-year average P/E closer to 12x and a clear catalyst for multiple re-rating as the platform businesses exit their investment cycle, Best Buy stock is undervaluedrelative to its own earnings history.
The central tension for BBY investors is whether memory inflation is a Q1 speed bump or a multi-quarter margin event that delays the Ads and Marketplace payoff. The bull and bear cases both start from the same data, and they end in very different places.
Bull Case:
- Memory inflation peaks in Q1 FY27 and moderates as supply adjusts; BBY’s guidance range of -1% to +1% comps holds
- Best Buy Ads reaches around $1 billion in gross collections in FY27, up roughly 10%, with on-site inventory mix growing and driving incremental margin
- RGB television launch as exclusive national partner mid-FY27 drives home theater comp recovery, the one category that has weighed on comps most
- Marketplace GMV grows materially past $300 million per quarter as 1,100+ sellers scale; FY27 becomes last major investment year before FY28 operating income contribution begins
- Multiple re-rates from ~9.6x to closer to 11x-12x as platform profitability becomes visible, generating 30%-40% price appreciation
Bear Case:
- Memory cost inflation persists into Q2 and Q3 FY27, pushing product margins below the flat assumption in guidance and compressing adj. EPS toward or below $6.30
- Computing comps, which have grown for eight consecutive quarters, turn negative in Q2 as higher prices meet consumer budget constraints, removing BBY’s primary comp driver
- Goldman’s Street-low $59 price target proves directionally correct; stock drifts toward the 52-week low of $59.16 as FY27 estimates get cut
- Ads and Marketplace combined still only a 30 basis point gross profit rate contributor in FY27, insufficient to absorb product margin deterioration, delaying the operating margin recovery thesis by a year
Should You Invest in Best Buy Co., Inc.?
The only way to really know is to look at the numbers yourself. TIKR gives you free access to the same institutional-quality financial data that professional analysts use to answer exactly that question.
Pull up BBY stock and you’ll see years of historical financials, what Wall Street analysts expect for revenue and earnings in the quarters ahead, how valuation multiples have moved over time, and whether price targets are trending up or down.
You can build a free watchlist to track Best Buy Co., Inc. alongside every other stock on your radar. No credit card required. Just the data you need to decide for yourself.
Access Professional Tools to Analyze BBY stock on TIKR for Free →