Key Takeaways
- AppLovin trades at $263, 64% below its 52-week high, ahead of its November 4 third-quarter report.
- Second-quarter revenue rose 53% to $1.92 billion but missed consensus, and the guide’s midpoint landed below Street estimates.
- The third-quarter midpoint implies 7.8% sequential growth, roughly double the second quarter’s pace.
- At 14.2x forward earnings, the stock prices in an active SEC probe and a securities class action.
AppLovin (APP) now trades like a broken growth story. Its numbers tell a different one.
The stock closed at $263 on October 27, down 36.3% over three months and 64% below its 52-week high of $738. It sits just $8 above its 52-week low.
That is a severe markdown for a company that grew revenue 53% last quarter at an 84% adjusted EBITDA margin. Yet the market has a specific complaint, and the November 4 report will either confirm it or put it to rest.
A small miss with a large price tag
The second quarter missed by a rounding error. Revenue rose 53% to $1.92 billion, just under the roughly $1.94 billion consensus, and diluted EPS of $3.76 matched estimates.
The guide did more damage. AppLovin projected third-quarter revenue of $2.055 billion to $2.085 billion, with the midpoint shy of the $2.08 billion Street estimate.
Shares fell 17% after the release, and BofA cut the stock to neutral the following week.
Management was candid about the cause. It said meaningful model improvement ran lighter than normal in the quarter, so sequential growth slowed to about 4%.
That slowdown is easy to spot:
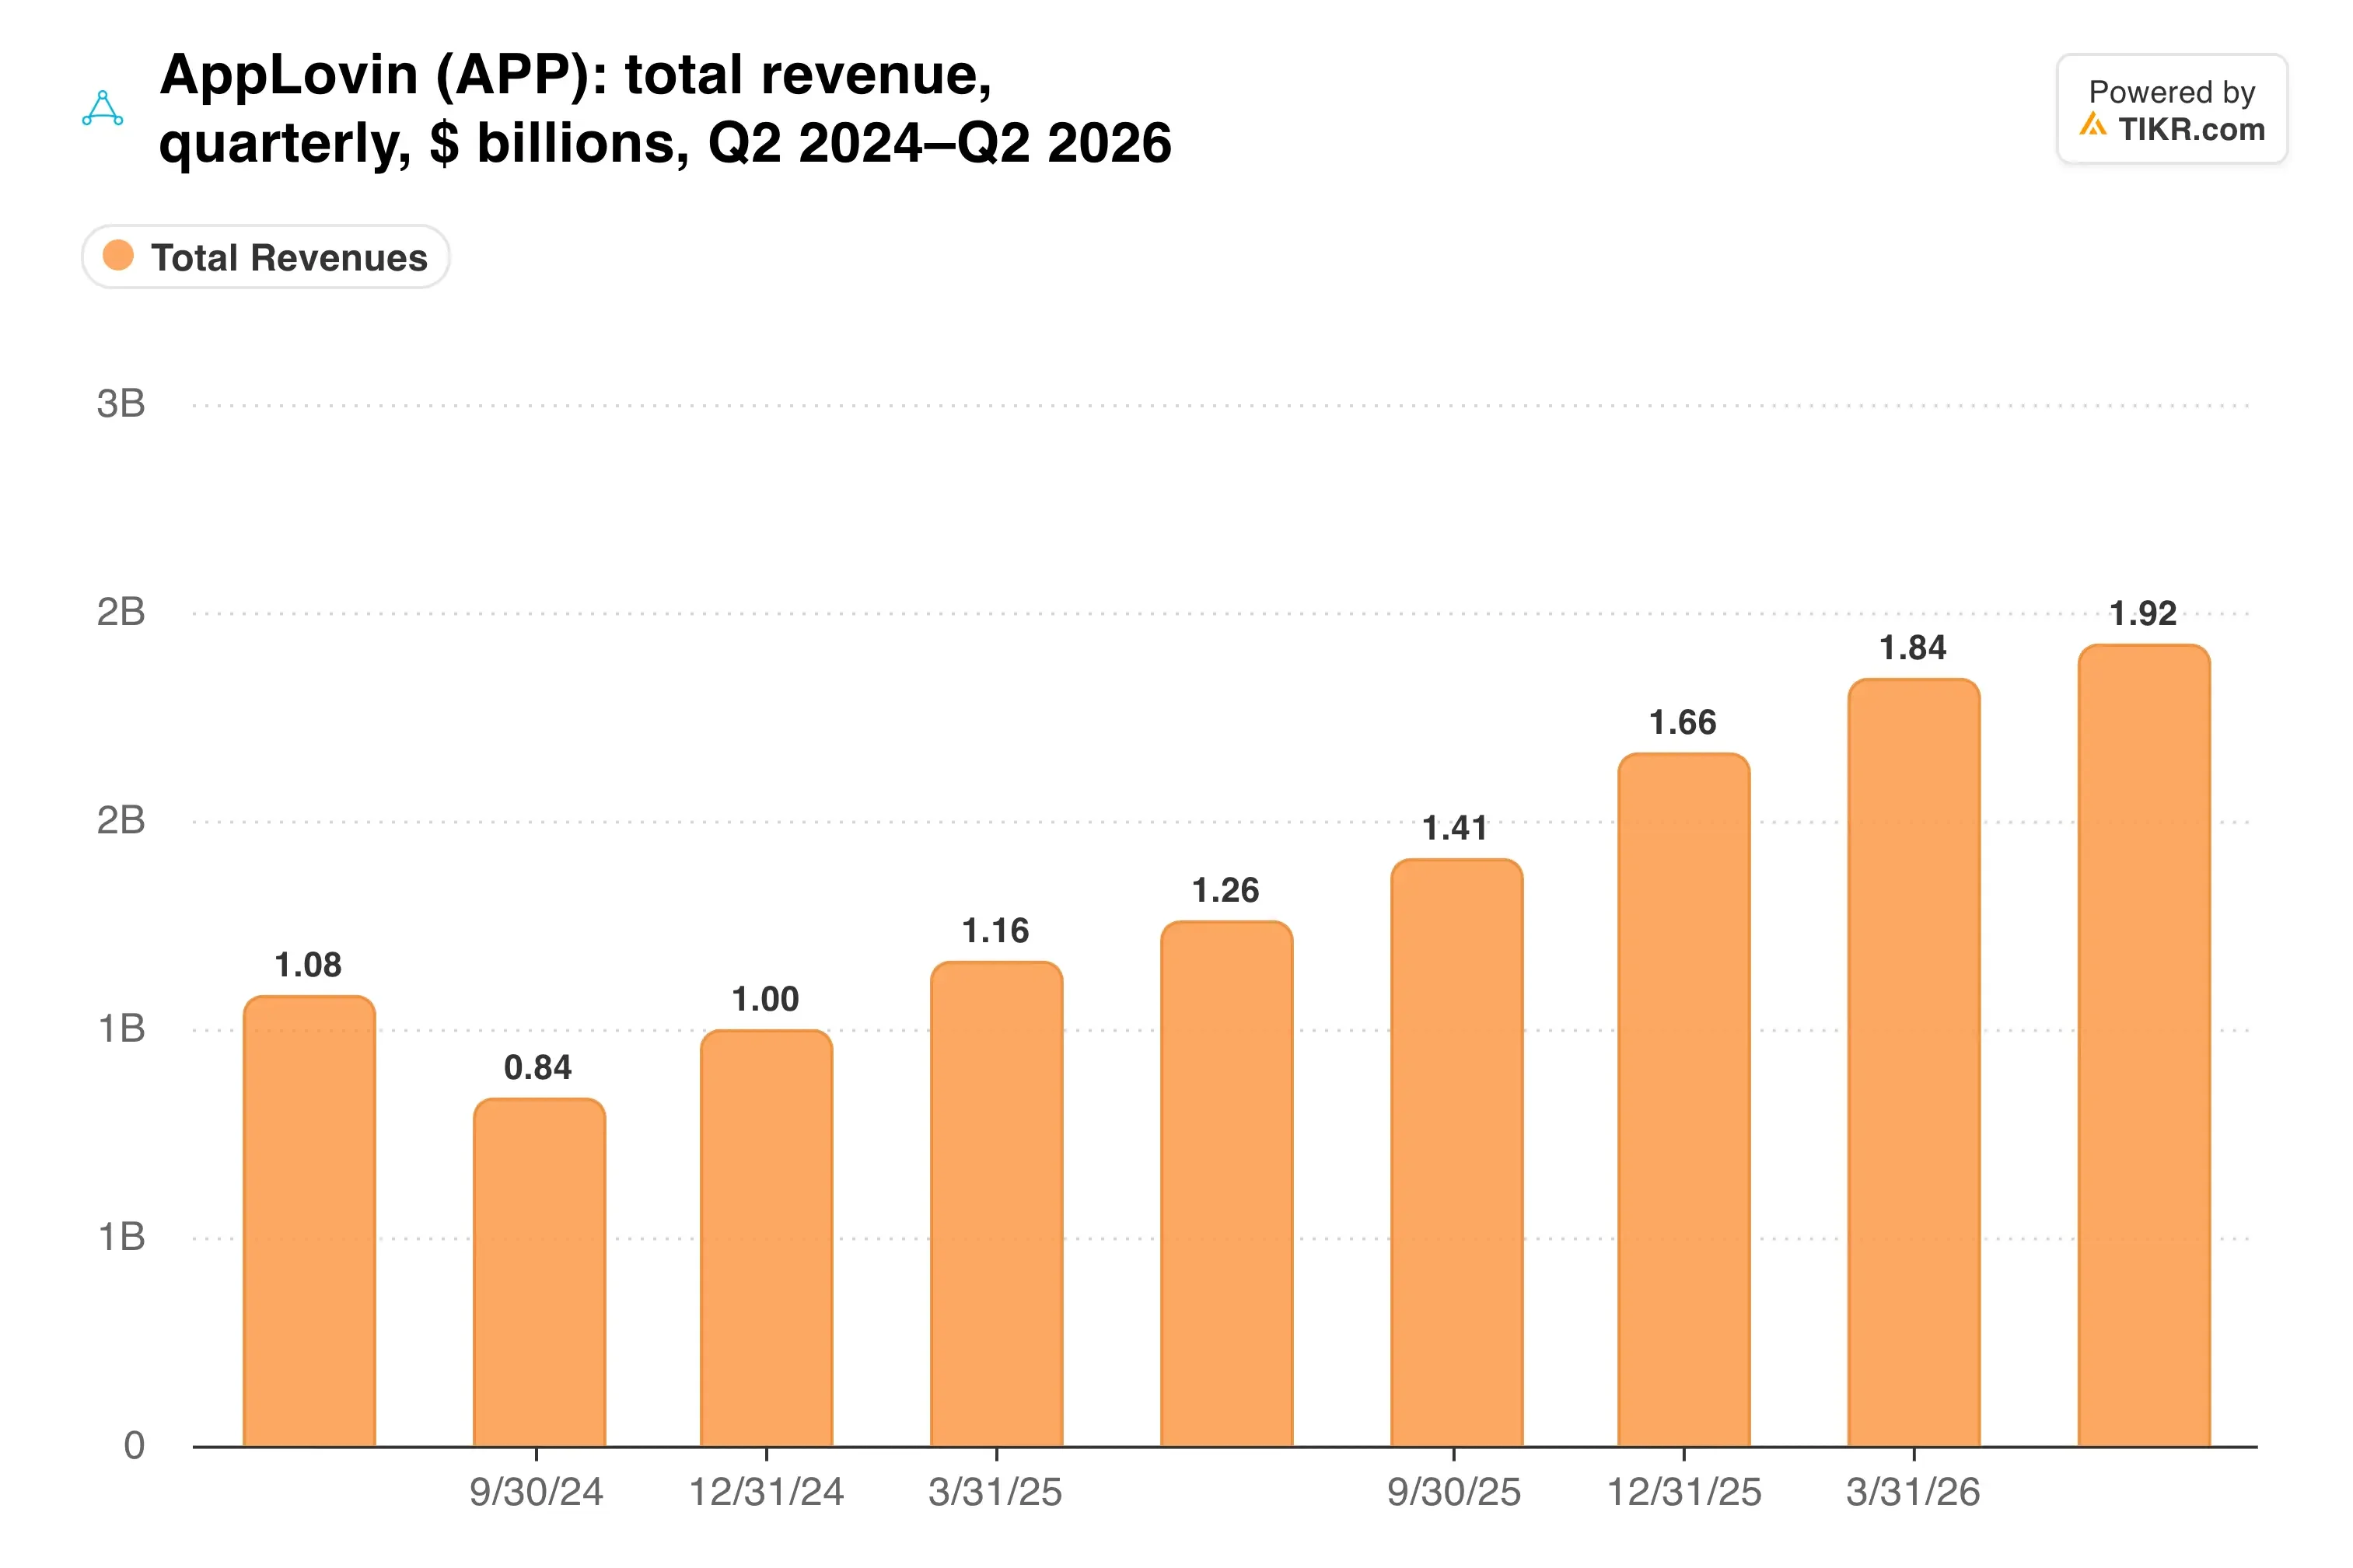
The quarterly trend still points up. What investors want to know is whether the slope can steepen again.
The model is the product
Everything at AppLovin runs through its ad engine. When the models improve, advertisers earn better returns and spend more, so revenue moves in steps tied to releases.
That makes the third-quarter guide more interesting than it first looks. The $2.07 billion midpoint implies 7.8% sequential growth, roughly double the second quarter’s pace.
Management also said the next model step-up landed just after quarter end. And the guide excludes releases not yet deployed, which leaves room for upside.
Meanwhile, the cash machine never slowed down.

Second-quarter free cash flow reached $863 million. AppLovin spent $551 million repurchasing and withholding 1.1 million shares in the same period.
TIKR tracks 33 analysts on AppLovin. How many say “Buy”?
See the full breakdown of Buy, Hold, and Sell ratings on AppLovin, along with Wall Street’s revenue and earnings estimates, all in one place. More than 500,000 investors use TIKR to research stocks like this one. See AppLovin’s Analyst Ratings
What a 14x multiple implies
AppLovin trades at 14.2x forward earnings and 11.6x forward EBITDA. Analysts model 38.9% annual EPS growth over the next two years.
Compare that with Reddit (RDDT), which trades at 16.0x forward earnings with a 28.2% EBIT margin against AppLovin’s 77.4%. The market is paying more for a less profitable ad business.
How far has the multiple actually fallen?

The discount has reasons. The SEC’s probe into AppLovin’s data-collection practices remains active, and a securities class action alleges the company overstated how steadily its models improve. Higher compute costs for training also pressured second-quarter margins.
My take: at 14.2x earnings, investors are pricing AppLovin as if model gains have stalled for good. The 7.8% sequential implication gives bulls a fair shot, but the regulatory overhang argues for a modest position size.
On November 4, the key figure is revenue against the $2.07 billion midpoint. A fourth-quarter guide that holds high single-digit sequential growth would show the model cadence is back.
So what is AppLovin stock actually worth?
TIKR lets you forecast the future price of any stock in less than a minute. Just enter a few assumptions into TIKR’s valuation model and see what AppLovin could be worth. Start from Wall Street consensus estimates, or adjust the inputs to reflect your own view of the business. It’s free to use.
Disclaimer:
Please note that the articles on TIKR are not intended to serve as investment or financial advice from TIKR or our content team, nor are they recommendations to buy or sell any stocks. We create our content based on TIKR Terminal’s investment data and analysts’ estimates. Our analysis might not include recent company news or important updates. TIKR has no position in any stocks mentioned. Thank you for reading, and happy investing!