
Key Stats for GOOGL Stock
- Past week performance: -3.1%
- 52-week range: $236 to $409
- Valuation model target price: $504
- Implied upside: 46.6% over 2.3 years
Dig into Google Cloud’s growth and margins with 10 years of segment data on TIK (It’s free) >>>
Big Ambitions Meet a Tougher Tape
Alphabet (GOOGL) slipped about 3% over the past week, closing Friday near $344. The stock now sits roughly 16% below its 52-week high of $409. Much of the pressure came from the broader market, as the 10-year Treasury yield hit its highest level since 2007. Investors aren’t doubting Google’s AI lead, but they are rethinking what the massive spending behind it is worth.
Company news cut both ways. Ireland’s privacy regulator fined Google €403 million over historical location-data practices under GDPR, Europe’s strict data protection law. Britain’s competition watchdog also proposed giving consumers more search choice, including AI assistant options on Android and Chrome. Neither threatens the core business, yet both add to the regulatory overhang.
On the growth side, BNP Paribas signed a five-year deal to run Gemini models on Google Cloud. Google also plans to launch a satellite carrying its Trillium TPUs, custom AI chips, around October 1 under Project Suncatcher. That test checks whether AI hardware can survive in orbit, so it’s a research bet rather than a revenue driver.

July’s blowout quarter remains the bigger story. Q2 revenue rose 24% to $119.8 billion, and Google Cloud revenue surged 82% to $24.8 billion. “Our AI investments are redefining what’s possible across every part of our business,” CEO Sundar Pichai said on the earnings call. If GOOGL stock is going to reclaim its high, Cloud must keep turning that spending into profit.
Track Alphabet’s capex against cloud revenue growth quarter by quarter on TIKR (It’s free) >>>
Cloud Acceleration Makes the Math Work

Under valuation model assumptions realized through 12/31/28, the stock is modeled using:
- Revenue Growth (CAGR): 22.3%
- Operating Margins: 35.3%
- Exit P/E Multiple: 23.2x
Based on these inputs, the model estimates a target price of $504, implying a 46.6% total return from the current share price of $344 and an annualized return of 18.4% over the next 2.3 years.
This is a revenue acceleration story. The model assumes 22.3% annual revenue growth, well above the 5-year average of 17.2% and last year’s 15.1%. That sounds aggressive until you look at Q2, when revenue grew 24%. Analysts land in the same zone, forecasting about 23.5% annual growth over the next two years.
Google Cloud powers that forecast. Its backlog, meaning contracted revenue not yet recognized, reached $514 billion. Management expects to recognize just over 50% of it within 24 months. Meanwhile, Cloud’s operating margin jumped to 35.6% from 20.7% a year earlier.
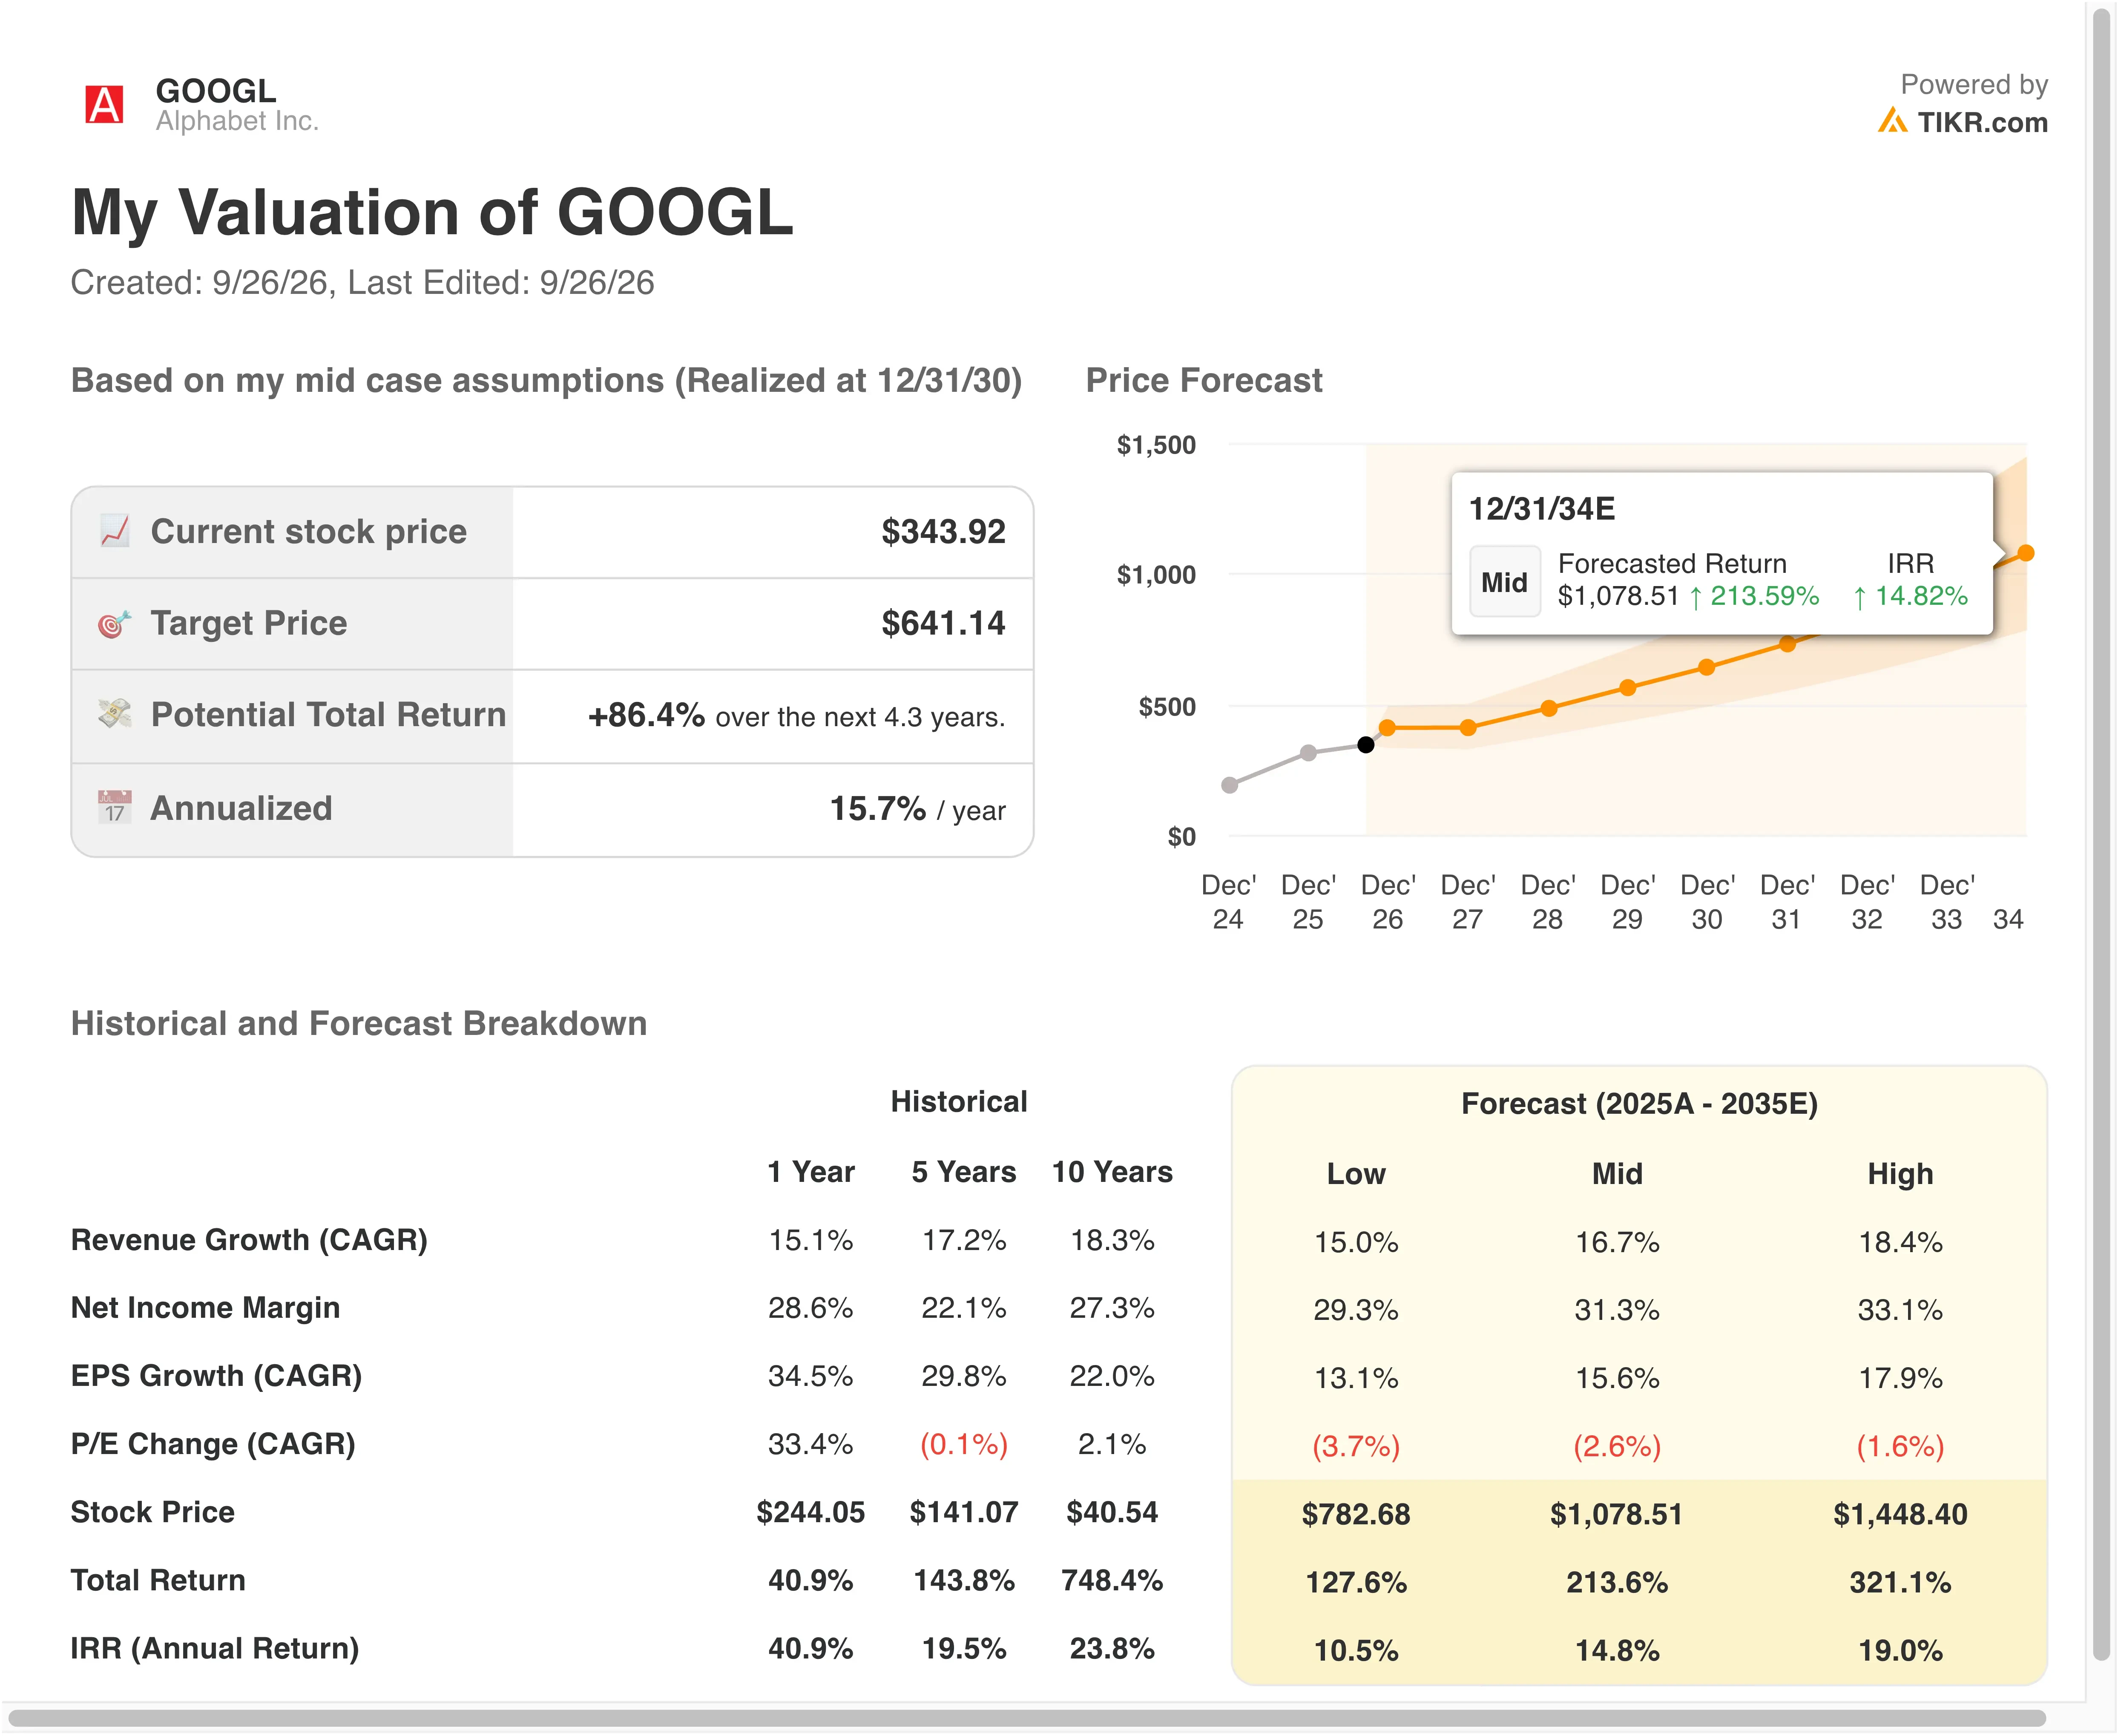
Margins and multiple look grounded. Operating margins of 35.3% sit only a few points above last year’s 32.1%. The exit P/E of 23.2x falls below today’s forward multiple of about 25.7x and last year’s 27.8x average. An 18.4% annualized return clears the 15% threshold for genuine undervaluation, but capital intensity is the catch. Alphabet raised 2026 capex guidance to $195 billion to $205 billion, and Q2 free cash flow came in at a $5.9 billion loss.
Pressure-test Alphabet’s 22% growth assumption with your own inputs (Free with TIKR) >>>
Google Cloud Is Winning the Growth Race
Microsoft (MSFT) remains a formidable rival. Azure and other cloud services grew 43% in its June quarter, and management guided to 45% growth next quarter. Azure also topped $100 billion in annual revenue for the first time, up 41%.
Amazon.com (AMZN) still runs the biggest cloud business. AWS revenue grew 36.7% to $42.2 billion in Q2, with a 39.4% operating margin and a $496 billion backlog. Google Cloud’s $24.8 billion quarter is smaller, but its 82% growth rate is roughly double both rivals, and its backlog now exceeds AWS’s.
Valuation favors Alphabet too. It trades at about 25.7x forward earnings, versus roughly 27.1x for Amazon. Alphabet’s trailing operating margin of 33.1% also nearly triples Amazon’s 12.1%, since Amazon carries a low-margin retail arm.
The balance sheet adds another edge. Alphabet holds about $122 billion in net cash, while Amazon carries roughly $129 billion in net debt. That flexibility lets Google fund its AI buildout without straining its finances, even as spending climbs.
Probe whether $175–$185 billion in 2026 capex can generate sufficient AI returns >>>
What’s Driving GOOGL Stock Going Forward?
Q3 earnings, expected around October 20, are the next test. Investors will watch Cloud growth, capex, and Search. CFO Anat Ashkenazi warned that Q3 will begin lapping an acceleration in Search performance, so growth there could look slower.
Gemini adoption is the core engine. The Gemini app reached 950 million monthly active users, and nearly 90% of Fortune 100 companies use Gemini Enterprise. Deals like BNP Paribas show regulated industries are now adopting Google’s AI at scale.
Regulation remains a steady headwind. Ireland gave Google six months to bring its location practices into compliance, and Britain’s search choice proposal could reshape default settings. On the positive side, a U.S. court rejected the Justice Department’s proposal to break apart Google’s ad tech tools.
Energy and compute capacity will decide how fast Cloud grows. Google signed a nuclear capacity deal with a Southern Co. unit in Georgia and reportedly plans at least €13 billion in Finnish AI infrastructure for 2027 and 2028. More power means more capacity, and capacity is what turns that $514 billion backlog into revenue.
Set alerts for Alphabet’s Q3 cloud results and estimate changes (Free with TIKR) >>>
Should You Invest in Alphabet?
The only way to really know is to look at the numbers yourself. TIKR gives you free access to the same institutional-quality financial data that professional analysts use to answer exactly that question.
Pull up GOOGL, and you’ll see years of historical financials, what Wall Street analysts expect for revenue and earnings in the quarters ahead, how valuation multiples have moved over time, and whether price targets are trending up or down.
You can build a free watchlist to track GOOGL alongside every other stock on your radar. No credit card required. Just the data you need to decide for yourself.
Analyze GOOGL stock on TIKR Free→
Disclaimer:
Please note that the articles on TIKR are not intended to serve as investment or financial advice from TIKR or our content team, nor are they recommendations to buy or sell any stocks. We create our content based on TIKR Terminal’s investment data and analysts’ estimates. Our analysis might not include recent company news or important updates. TIKR has no position in any stocks mentioned. Thank you for reading, and happy investing!