Key Stats for O Stock
- Past week performance: -2.0%
- 52-week range: $55 to $68
- Valuation model target price: $68
- Implied upside: 21.9% over 2.3 years
Screen Realty Income’s dividend history and payout trends alongside analyst forecasts on TIKR (It’s free) >>>
Rising Yields Drag the Monthly Dividend Giant to a 52-Week Low
Realty Income (O) fell about 2% over the past week, closing Friday near $56. That leaves the net-lease REIT, a real estate trust whose tenants pay most property costs, less than 1% above its 52-week low. Shares have now dropped roughly 11% since the company reported Q2 results on August 5. Investors are rethinking how much they’ll pay for bond-like income when Treasuries yield more.
The pressure is mostly macro. The 10-year Treasury yield climbed to its highest level since 2007 this week, and income stocks usually feel that first. Realty Income’s 5.9% dividend yield now competes directly with safer government bonds. The business itself looks healthy, however, with occupancy at 98.8% and full-year guidance recently raised.
Management kept executing through the slump. Realty Income agreed to sell KKR a 49% stake in 54 European properties for €528 million while keeping control and earning management fees. It also raised its monthly dividend to $0.2715 per share, its 136th consecutive monthly increase. In August, it closed a $1.0 billion convertible note offering, debt that can later turn into shares, at a 3.75% coupon.

Adjusted funds from operations (AFFO), the cash earnings measure REITs use, rose 3.8% to $1.09 per share in Q2. CEO Sumit Roy pointed to a new growth lane on the earnings call: “We believe the industry is still in the early stages of a multiyear digital infrastructure build-out driven by AI adoption, cloud computing, and broader digitization trends.” If O stock can show that data centers and private capital lift AFFO growth above 4%, the discount could narrow.
Chart Realty Income’s AFFO per share against its dividend payments on TIKR (It’s free) >>>
A Valuation Parked Near the Bottom of Its Range
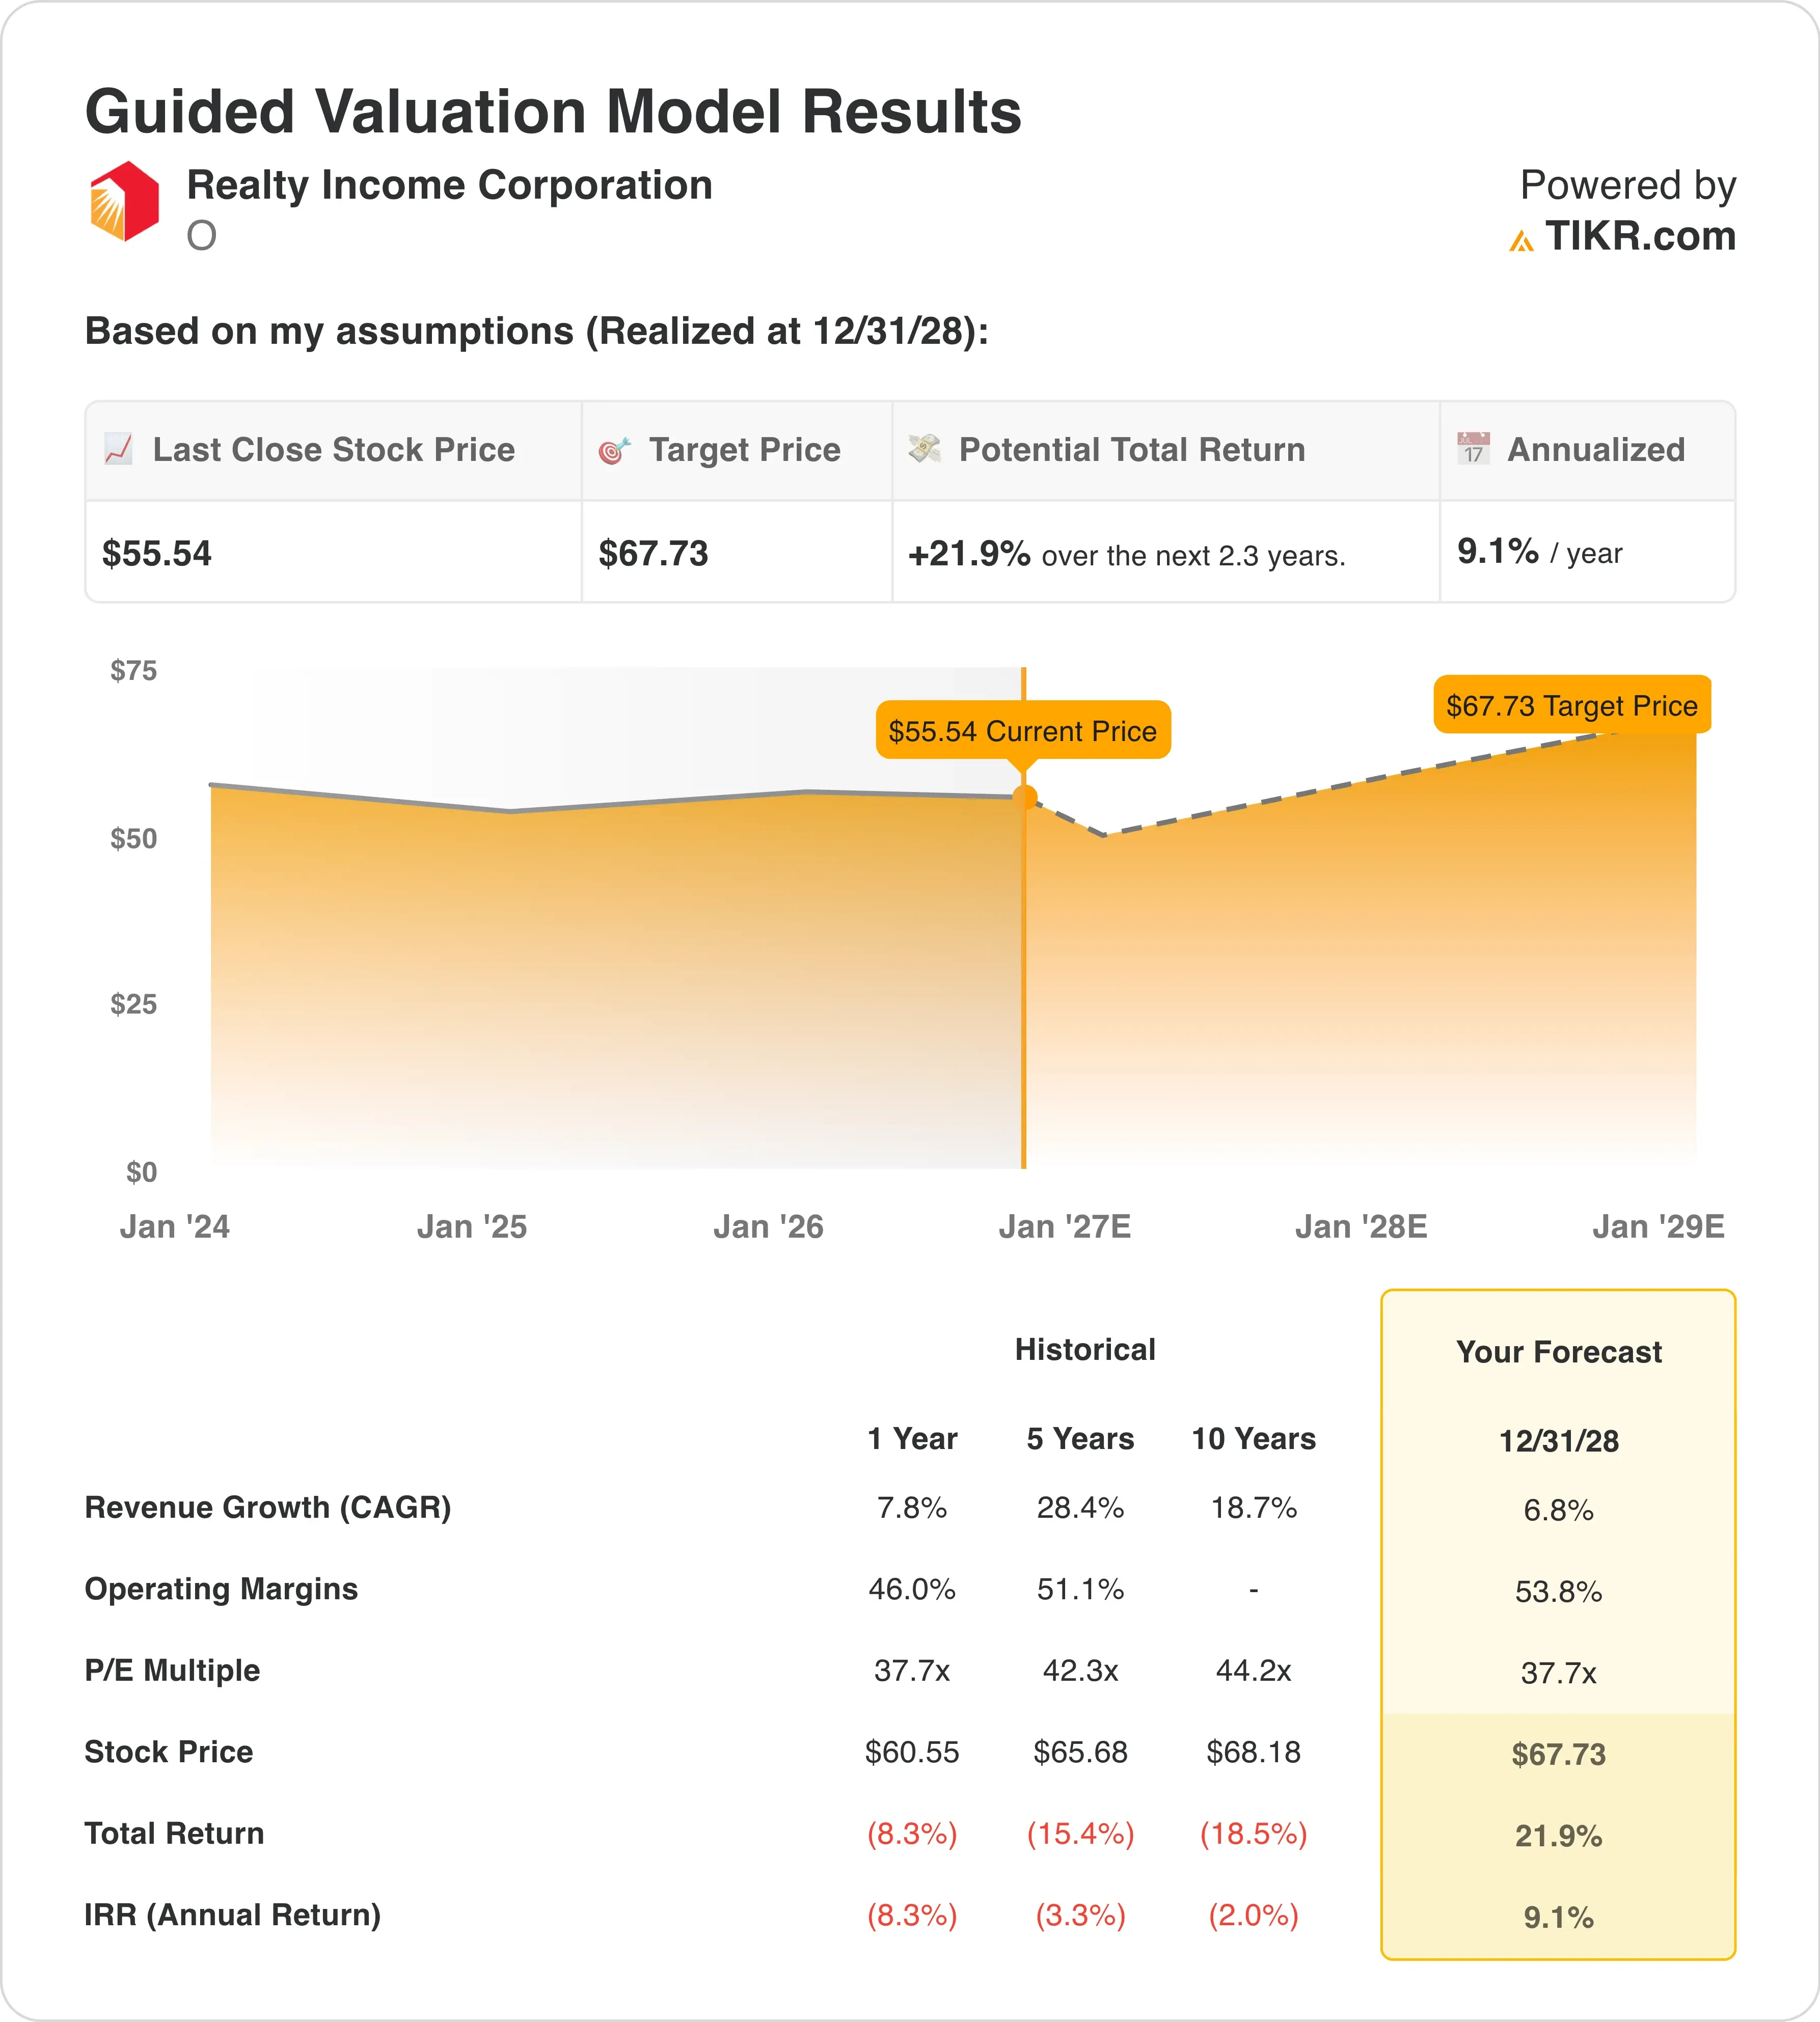
Under valuation model assumptions realized through 12/31/28, the stock is modeled using:
- Revenue Growth (CAGR): 6.8%
- Operating Margins: 53.8%
- Exit P/E Multiple: 37.7x
Based on these inputs, the model estimates a target price of $68, implying a 21.9% total return from the current share price of $56 and an annualized return of 9.1% over the next 2.3 years.
This is a multiple reset story more than a growth story. The exit P/E of 37.7x matches last year’s average but sits below the 5-year average of 42.3x and the 10-year average of 44.2x. P/E runs high for REITs because depreciation depresses reported profit. On AFFO, the stock trades near 12.5x the midpoint of 2026 guidance.
Growth assumptions look reasonable. Revenue growth of 6.8% trails last year’s 7.8% and the acquisition-fueled 28.4% pace of the past five years. Operating margins of 53.8% would top last year’s 46.0%, and that lift depends on higher-yielding industrial and data center deals. Q2 investments earned a 7.3% initial cash yield.
The 9.1% annualized return sits just under the 10% hurdle. However, the model tracks price only, so the 5.9% dividend yield sits on top of it. Combined, the potential return lands closer to 15% a year, which is solid for a stock with a beta of 0.72.
Smaller Net-Lease Rivals Are Growing a Little Faster
Agree Realty (ADC) raised its 2026 AFFO guidance to $4.57 to $4.59 per share, implying 5.8% growth at the midpoint. W. P. Carey (WPC) now expects $5.19 to $5.27, or about 5.2% growth. NNN REIT (NNN) guides to $3.55 to $3.59, implying roughly 3.8% growth.
Realty Income’s range of $4.44 to $4.45 implies about 4% growth. That places it behind Agree and W. P. Carey but slightly ahead of NNN. Scale explains the gap, because Realty Income plans roughly $10 billion in investments this year just to move the needle. Agree, by comparison, targets $1.6 billion to $1.8 billion.
Operating metrics tell a similar story. NNN’s occupancy reached 99.1%, just above Realty Income’s 98.8%. W. P. Carey reported net debt of 5.5x adjusted EBITDA, a leverage gauge comparing debt to annual cash earnings, slightly below Realty Income’s 5.7x.
Size still gives Realty Income a funding edge. Management cut public equity to 18% of investment funding this year, versus a 47% three-year average. Partnerships with GIC, Apollo, KKR, and Cloud Capital give it capital sources that smaller peers can’t easily match.
Determine if raised AFFO guidance can support future distribution growth >>>
What’s Driving O Stock Going Forward?
The KKR joint venture should close around September 30. KKR’s return is capped near a 6.3% to 6.5% internal rate of return, and Realty Income can buy back the stake between years 10 and 17. That structure recycles capital into new deals without issuing shares at depressed prices.
Q3 results arrive around November 4. Investors will watch whether the $10 billion investment target holds and whether AFFO stays on track for roughly 4% growth. Any improvement on 7.3% initial yields would signal a widening spread between property returns and funding costs.
The $6 billion hyperscale data center venture is the long-term wild card. Realty Income expects to invest up to $1.4 billion for a 45% stake in three Northern Virginia assets totaling 400 megawatts. Long leases to large cloud tenants could add a durable growth layer to a portfolio built on retail.
Rates remain the biggest swing factor, though. Yields at 2007 highs raise borrowing costs and pull income investors toward bonds. If yields ease, a 5.9% dividend yield from a company with 136 straight monthly increases would look compelling again.
Follow Realty Income’s Q3 AFFO estimates and set a price alert (Free with TIKR) >>>
Should You Invest in Realty Income?
The only way to really know is to look at the numbers yourself. TIKR gives you free access to the same institutional-quality financial data that professional analysts use to answer exactly that question.
Pull up O, and you’ll see years of historical financials, what Wall Street analysts expect for revenue and earnings in the quarters ahead, how valuation multiples have moved over time, and whether price targets are trending up or down.
You can build a free watchlist to track O alongside every other stock on your radar. No credit card required. Just the data you need to decide for yourself.
Disclaimer:
Please note that the articles on TIKR are not intended to serve as investment or financial advice from TIKR or our content team, nor are they recommendations to buy or sell any stocks. We create our content based on TIKR Terminal’s investment data and analysts’ estimates. Our analysis might not include recent company news or important updates. TIKR has no position in any stocks mentioned. Thank you for reading, and happy investing!