


Key Stats for BAC Stock
- Past week performance: -2.2%
- 52-week range: $46 to $65
- Valuation model target price: $72
- Implied upside: 27.6% over 2.3 years
Stress-test Bank of America’s earnings power with 5 years of analyst forecasts on TIKR (It’s free) >>>
A Quiet Pullback After a Record Quarter
Bank of America (BAC) slipped about 2% over the past week, closing Friday near $57. The dip came as the 10-year Treasury yield hit its highest level since 2007 and Wall Street broadly retreated. Nothing in the bank’s own news pointed to trouble, so the move looks like macro noise. Investors aren’t worried about the franchise, but they are rethinking how much good news the price already reflects.
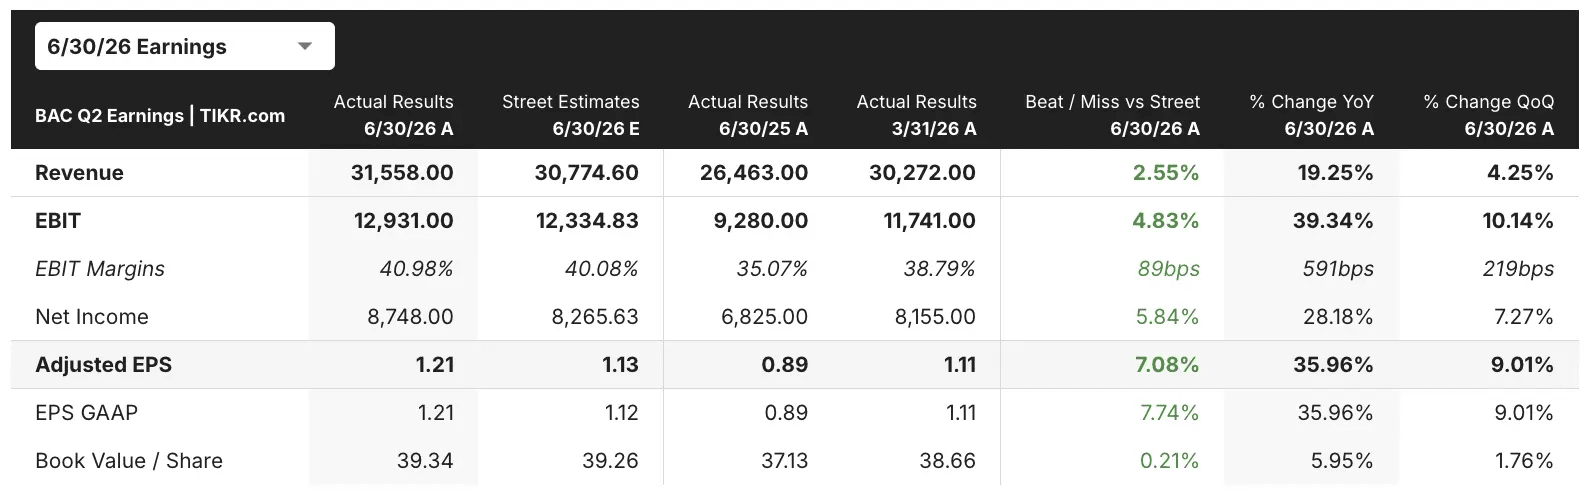
The backdrop remains strong. In July, the bank posted Q2 earnings per share (EPS) of $1.21, up 34% from a year earlier. Revenue climbed 15% to $31.6 billion, while net interest income (NII), the gap between what the bank earns on loans and pays on deposits, rose 9% to $16.2 billion. “Our results show organic growth, operating leverage, and efficiency ratio improvement in every business segment,” CEO Brian Moynihan said on the earnings call.
This week’s headlines were strategic rather than financial. Bank of America plans to hire 1,000 additional apprentices over two years and commit $150 million to workforce development. It also joined five global banks in publishing principles for agentic commerce, where AI agents shop and pay on a consumer’s behalf. Neither move changes near-term earnings, yet both show management preparing for how payments will work next.
Separately, the bank’s research team raised its second-half 2026 Brent oil forecast to $95 from $83. Higher oil could keep inflation and yields elevated, and that matters because Bank of America earns more when rates rise. Going forward, the bank estimates a 100 basis point rise in rates would lift NII by about $1.0 billion over 12 months.
Compare Bank of America’s NII trends against every major U.S. lender on TIKR (It’s free) >>>
Is BAC Stock Undervalued?
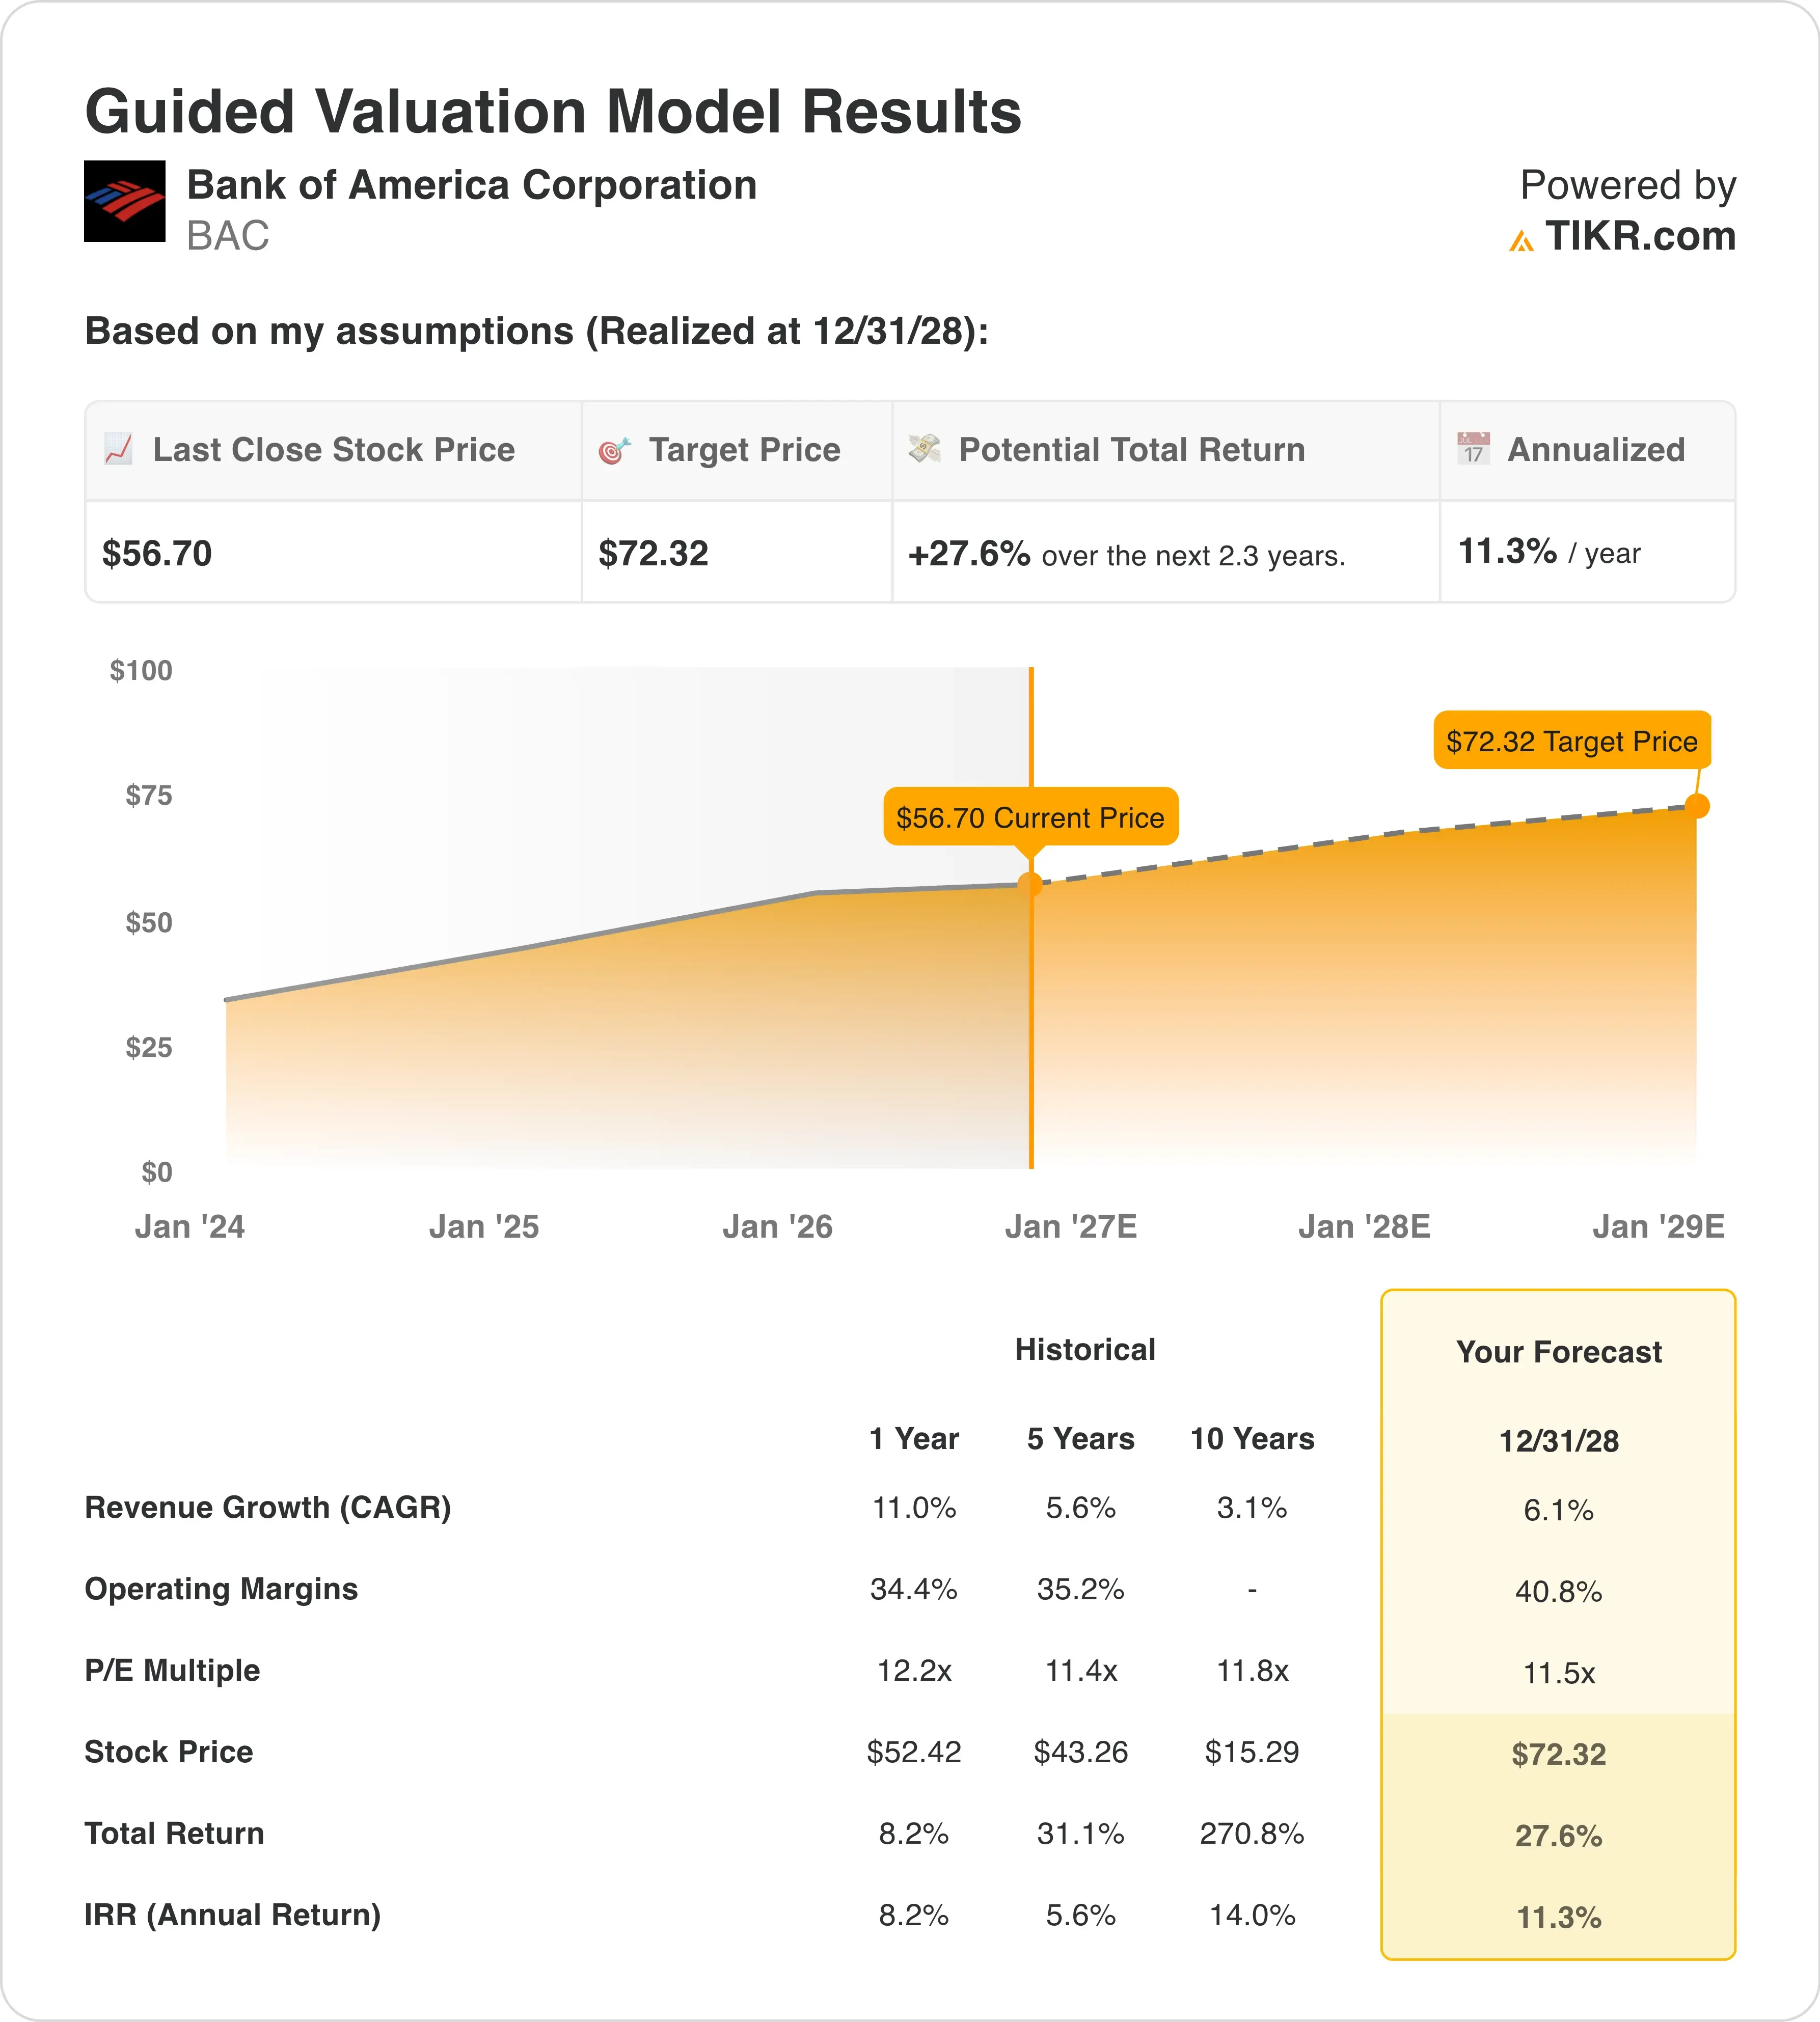
Under valuation model assumptions realized through 12/31/28, the stock is modeled using:
- Revenue Growth (CAGR): 6.1%
- Operating Margins: 40.8%
- Exit P/E Multiple: 11.5x
Based on these inputs, the model estimates a target price of $72, implying a 27.6% total return from the current share price of $57 and an annualized return of 11.3% over the next 2.3 years.
Those growth assumptions are modest. Revenue growth of 6.1% sits just above the 5-year average of 5.6%, and well below last year’s 11.0% pace. The exit multiple of 11.5x matches both the 5-year average of 11.4x and today’s forward P/E. So the model doesn’t need investors to pay more for each dollar of earnings.
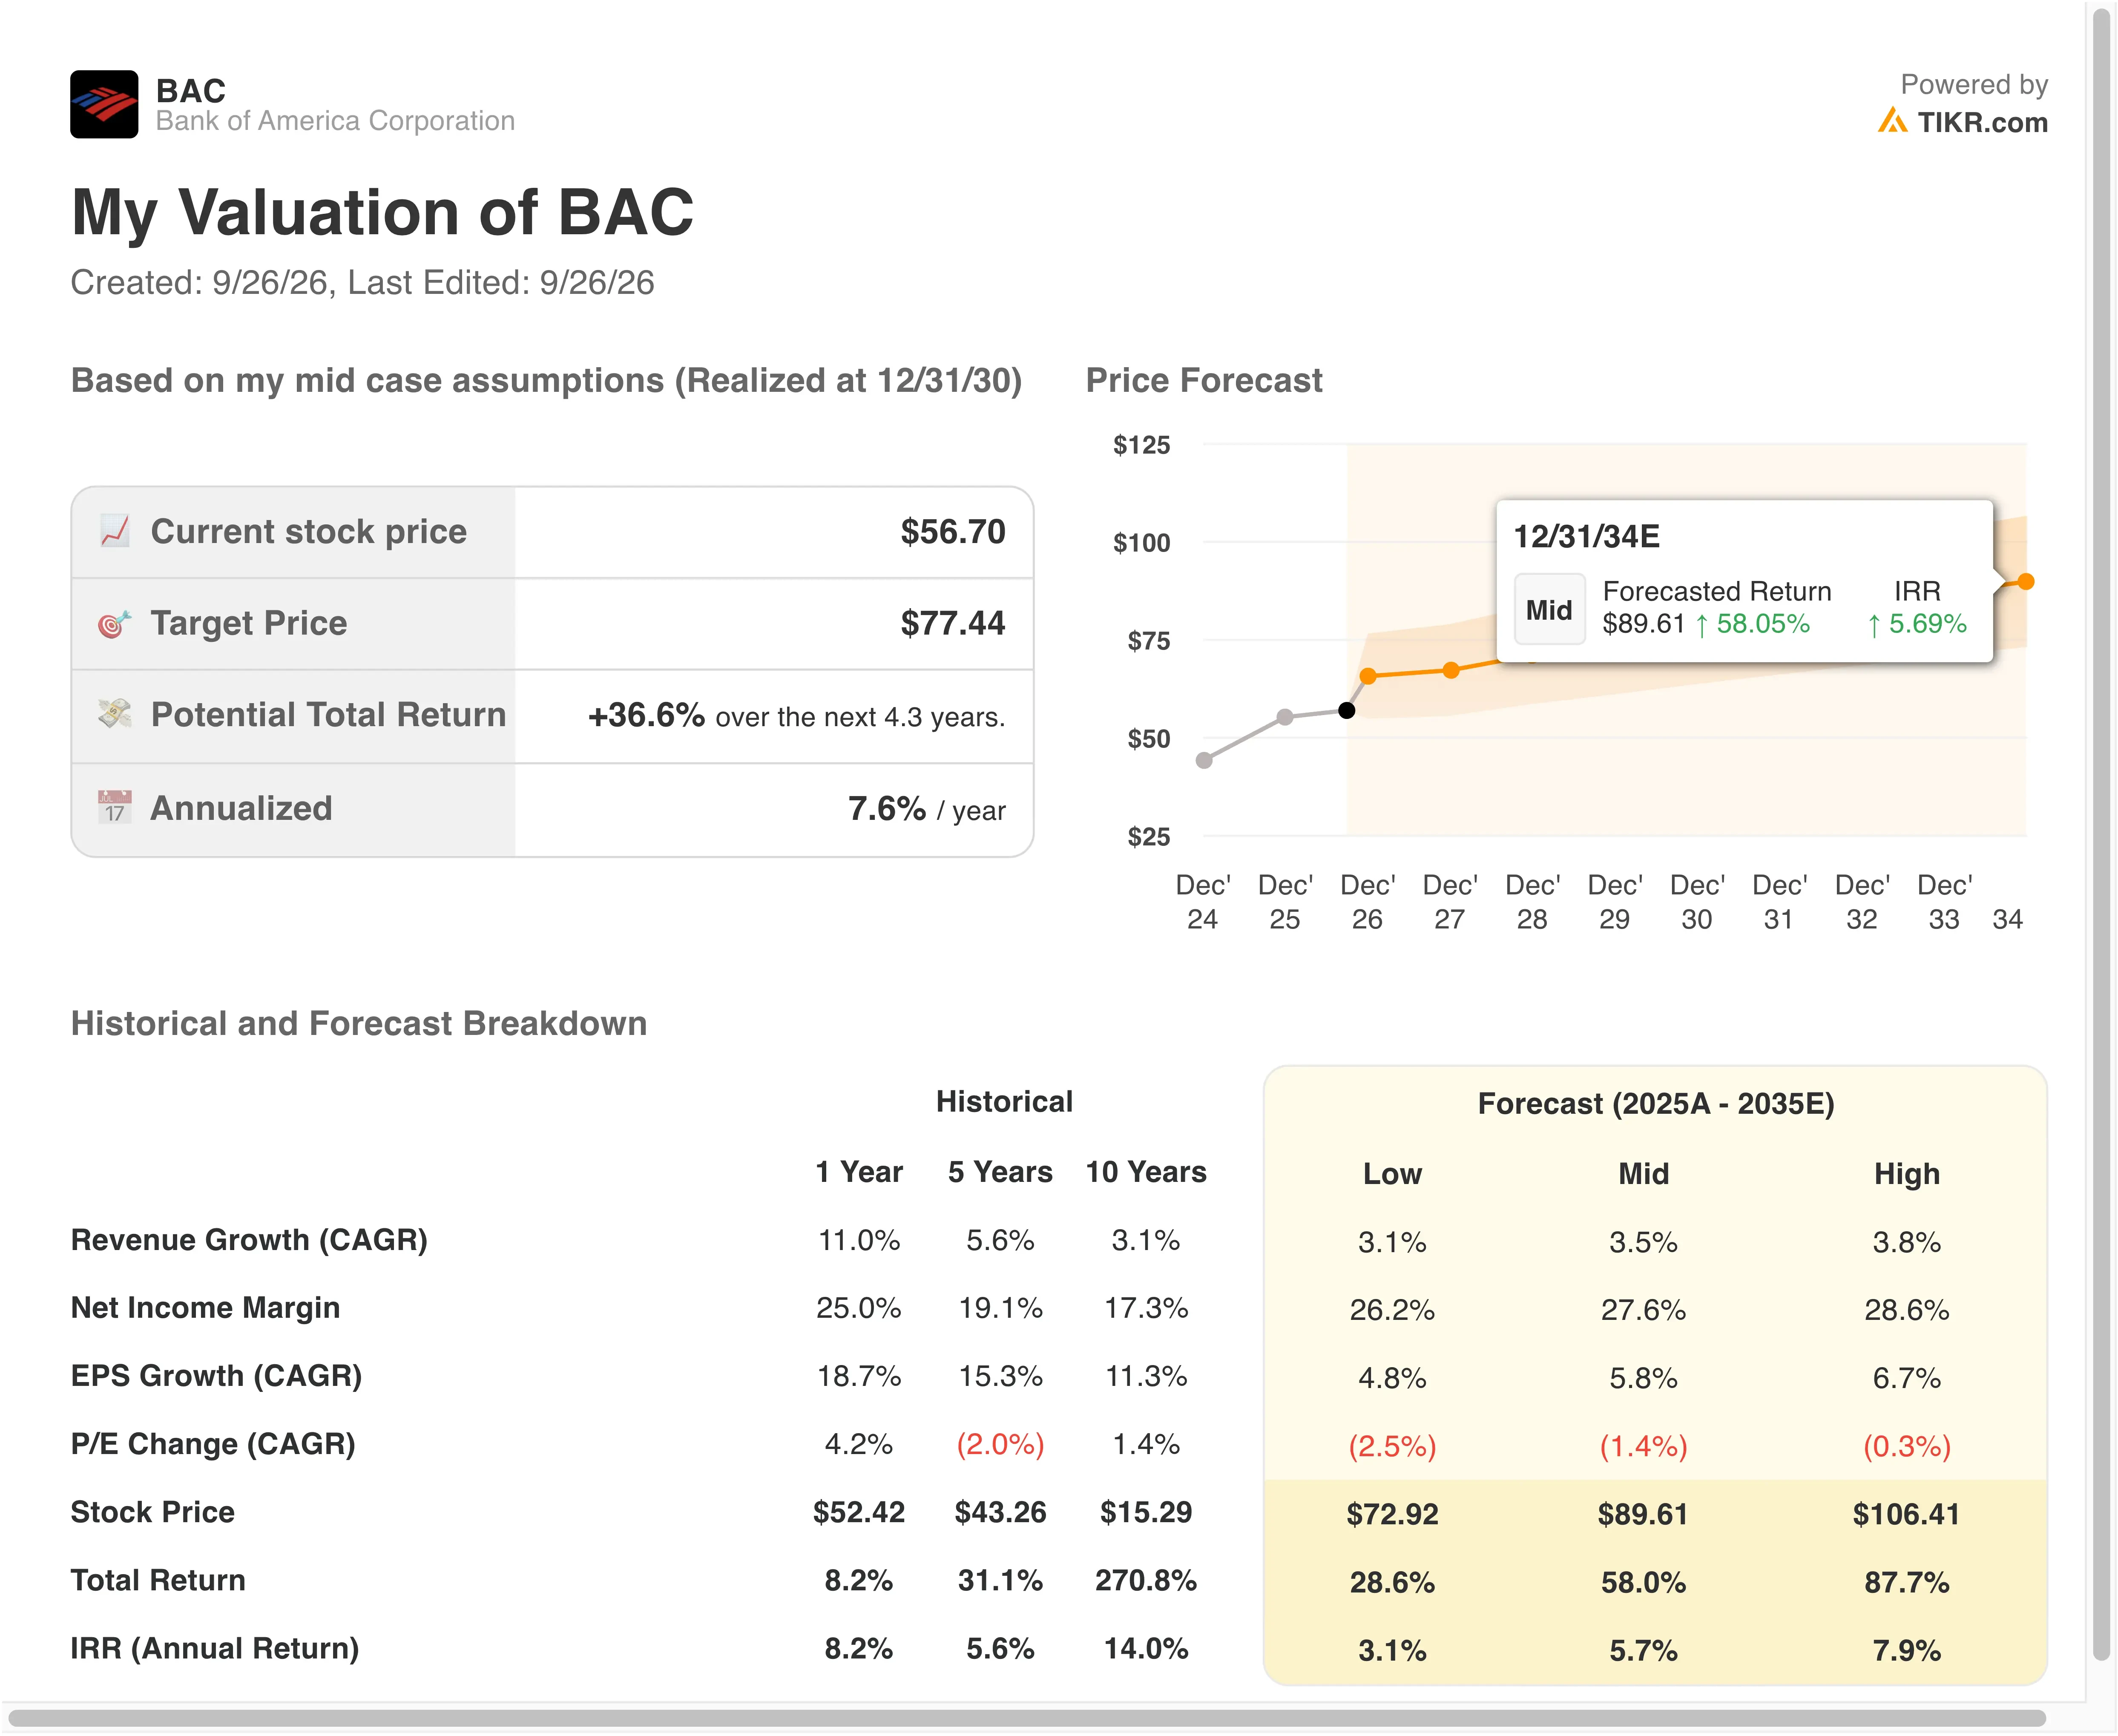
Margins carry the thesis instead. The model assumes operating margins reach 40.8%, up from 34.4% last year and 35.2% over five years. That makes this a margin expansion story, and Q2 offered early proof. Operating leverage, meaning revenue growing faster than costs, hit 6.6% in the quarter.
An 11.3% annualized return looks moderately attractive rather than deeply cheap. It clears the 10% bar but falls short of the 15% level that signals real undervaluation. The model also tracks price only, so the 2.2% dividend yield adds to that figure. If margins stall near 35%, however, the upside shrinks quickly because the thesis leans on efficiency, not rapid growth.
Estimate a company’s fair value instantly (Free with TIKR) >>>
How Bank of America Stacks Up Against Its Big-Bank Rivals
JPMorgan Chase (JPM) still sets the profitability standard. It reported record Q2 net income of $21.2 billion, or $16.9 billion excluding a Visa stake gain and other items. Its return on tangible common equity (ROTCE), which measures profit against shareholders’ hard capital, reached 23% on that adjusted basis. Bank of America posted a 17% ROTCE, so JPMorgan still converts capital into profit more efficiently.
Citigroup (C) grew fastest, but from a smaller base. Its Q2 net income jumped 45% to $5.8 billion on revenue of $24.8 billion, up 14%. Bank of America’s 27% profit growth trailed Citi, yet it came on a much larger $9.1 billion earnings base.
Wells Fargo (WFC) lagged both. Its net income rose 17% to $6.4 billion. Bank of America grew profit about 10 points faster, helped by a 33% jump in sales and trading revenue and a 50% rise in investment banking fees.
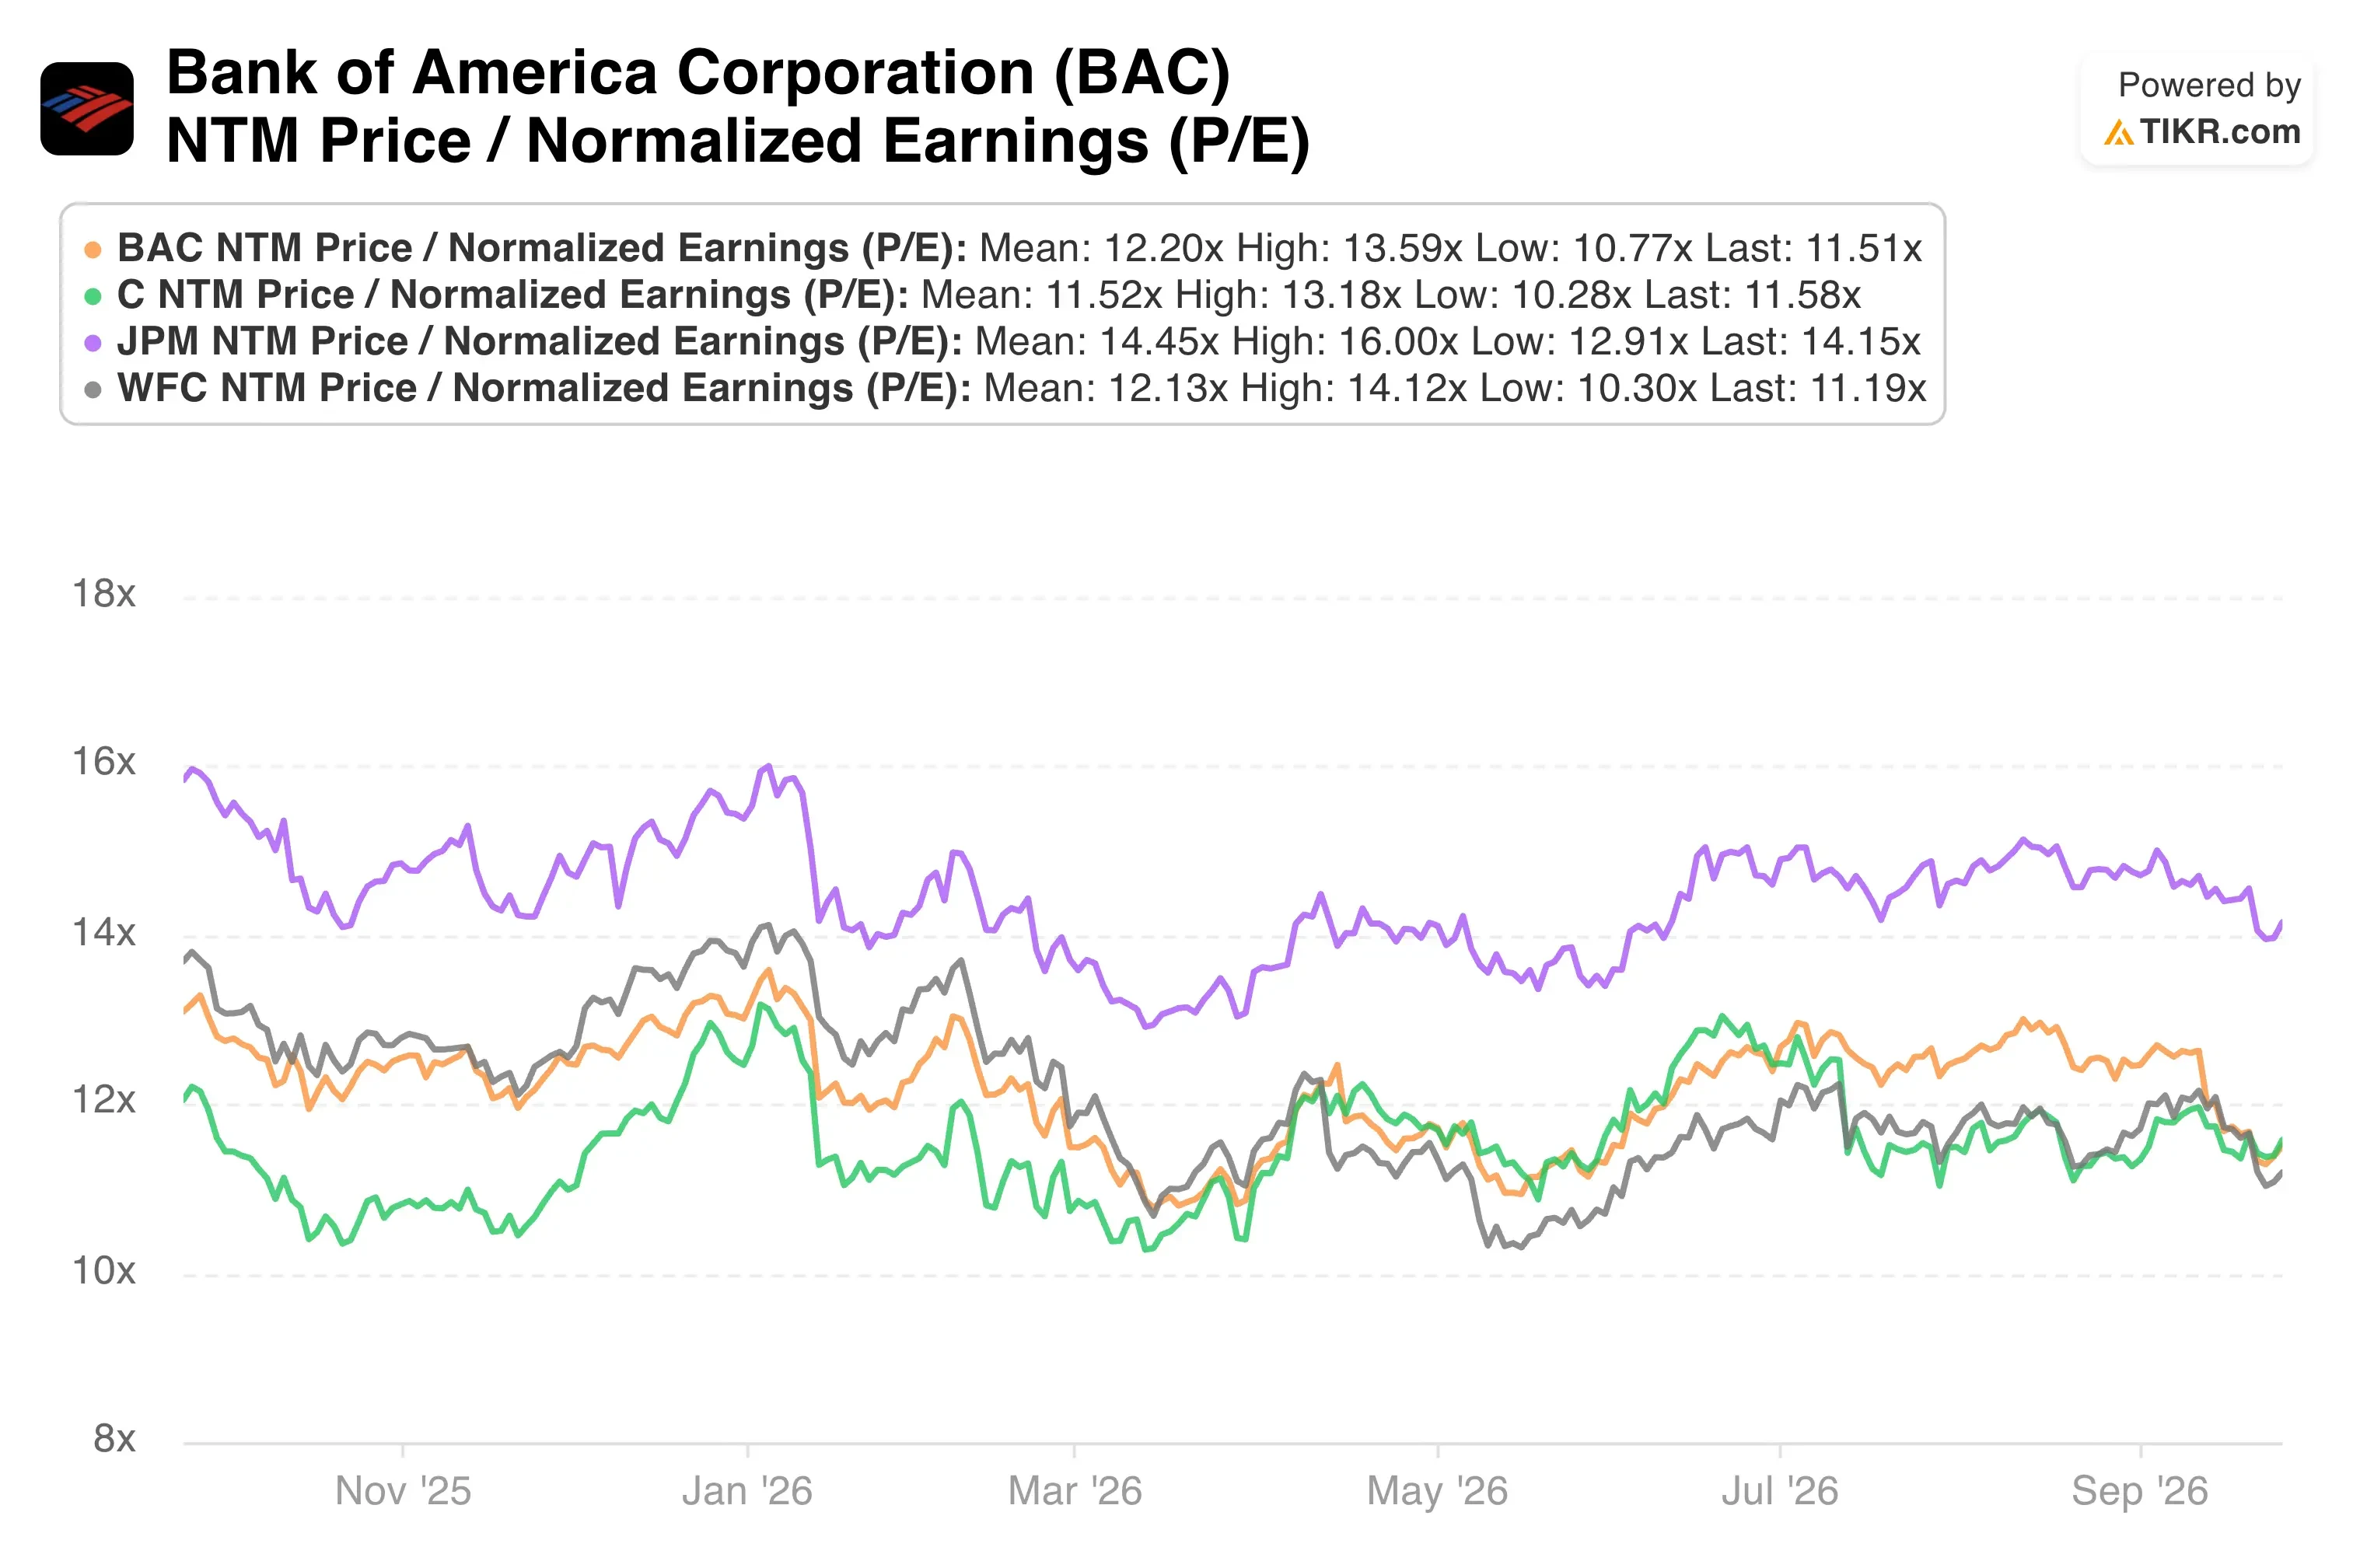
The takeaway is clear. Bank of America ranks mid-pack on returns but near the top on growth momentum. Its forward P/E near 11.5x leaves room for a re-rating if ROTCE keeps closing the gap with JPMorgan, although the model conservatively assumes none.
Assess whether Bank of America’s 37% rally is supported by its current valuation >>>
What’s Driving BAC Stock Going Forward?
Guidance sets the near-term bar. Management expects full-year 2026 NII growth at the upper end of its 6% to 8% range. It also raised operating leverage guidance to 300 to 400 basis points, so revenue should outrun expenses by a wide margin.
Rates are the swing factor. Bank of America is asset sensitive, which means its income rises when rates climb. With the 10-year yield at its highest since 2007, that sensitivity works in the bank’s favor. Higher rates can also strain borrowers, though, so credit trends deserve close attention.
Capital markets add upside. Investment banking fees topped $2.1 billion in Q2, while trading revenue reached $7.2 billion. Industry-wide, AI-driven capital spending has fueled equity issuance, M&A, and debt financing, and that pipeline could keep fees elevated into 2027.
Regulatory risk hasn’t disappeared. Federal prosecutors in Washington, D.C., subpoenaed several large banks, including Bank of America, in a probe into alleged debanking, the practice of closing accounts for non-financial reasons. Meanwhile, the apprentice push and agentic commerce principles are long-term bets on talent and payments rather than near-term earnings drivers.
Track Bank of America’s guidance updates and analyst revisions in one dashboard (Free with TIKR) >>>
Should You Invest in Bank of America?
The only way to really know is to look at the numbers yourself. TIKR gives you free access to the same institutional-quality financial data that professional analysts use to answer exactly that question.
Pull up BAC, and you’ll see years of historical financials, what Wall Street analysts expect for revenue and earnings in the quarters ahead, how valuation multiples have moved over time, and whether price targets are trending up or down.
You can build a free watchlist to track BAC alongside every other stock on your radar. No credit card required. Just the data you need to decide for yourself.
Analyze BAC stock on TIKR Free→
Disclaimer:
Please note that the articles on TIKR are not intended to serve as investment or financial advice from TIKR or our content team, nor are they recommendations to buy or sell any stocks. We create our content based on TIKR Terminal’s investment data and analysts’ estimates. Our analysis might not include recent company news or important updates. TIKR has no position in any stocks mentioned. Thank you for reading, and happy investing!


