
Key Stats for AMZN Stock
- Past week performance: -3.4%
- 52-week range: $196 to $287
- Valuation model target price: $381
- Implied upside: 52.7% over 2.3 years
Unpack Amazon’s segment margins across AWS, retail, and ads on TIKR (It’s free) >>>
AI Spending Jitters Overshadow a Busy Week of Expansion
Amazon.com (AMZN) fell about 3% over the past week, closing Friday near $250. The stock now trades roughly 13% below its 52-week high of $287. Rising Treasury yields weighed on tech, while fresh commentary questioned the durability of the AI data center boom. Investors aren’t doubting demand, but they are rethinking the cost of meeting it.
Company news centered on expansion. Amazon reportedly plans to invest $3 billion in India’s quick-commerce market by 2030, building out its Amazon Now network of neighborhood warehouses. Quick commerce means deliveries in minutes, and local rivals currently lead that race. Amazon hasn’t confirmed the figures.
Amazon also committed more than $100 million to a robotics manufacturing hub in Indiana, adding 300 jobs by 2028. Separately, it expanded its Fire TV partnership with Best Buy, opening Fire TV ad inventory to Best Buy’s ad business. Each move feeds a higher-margin engine, since automation lowers delivery costs and connected-TV ads monetize screens Amazon already reaches.

The core business is humming. In Q2, revenue rose 20% to $200.6 billion, and operating income jumped 43% to $27.5 billion. AWS grew 36.7%, its fastest pace in 18 quarters. CEO Andy Jassy addressed the spending debate on the earnings call: “We see the margins and returns in AI tracking what we saw with Core at the same point of evolution, actually a little ahead.” Going forward, investors will test that claim every quarter.
Measure Amazon’s AWS acceleration against its capex ramp on TIKR (It’s free) >>>
Margin Expansion Does the Heavy Lifting

Under valuation model assumptions realized through 12/31/28, the stock is modeled using:
- Revenue Growth (CAGR): 15.3%
- Operating Margins: 15.7%
- Exit P/E Multiple: 27.1x
Based on these inputs, the model estimates a target price of $381, implying a 52.7% total return from the current share price of $250 and an annualized return of 20.5% over the next 2.3 years.
This is a margin expansion story. The model assumes operating margins of 15.7%, up from 10.8% last year and a 5.9% average over five years. That jump sounds big, yet Q2 already delivered a 13.7% operating margin. AWS, ads, and robotics all shift the mix toward higher-profit businesses.
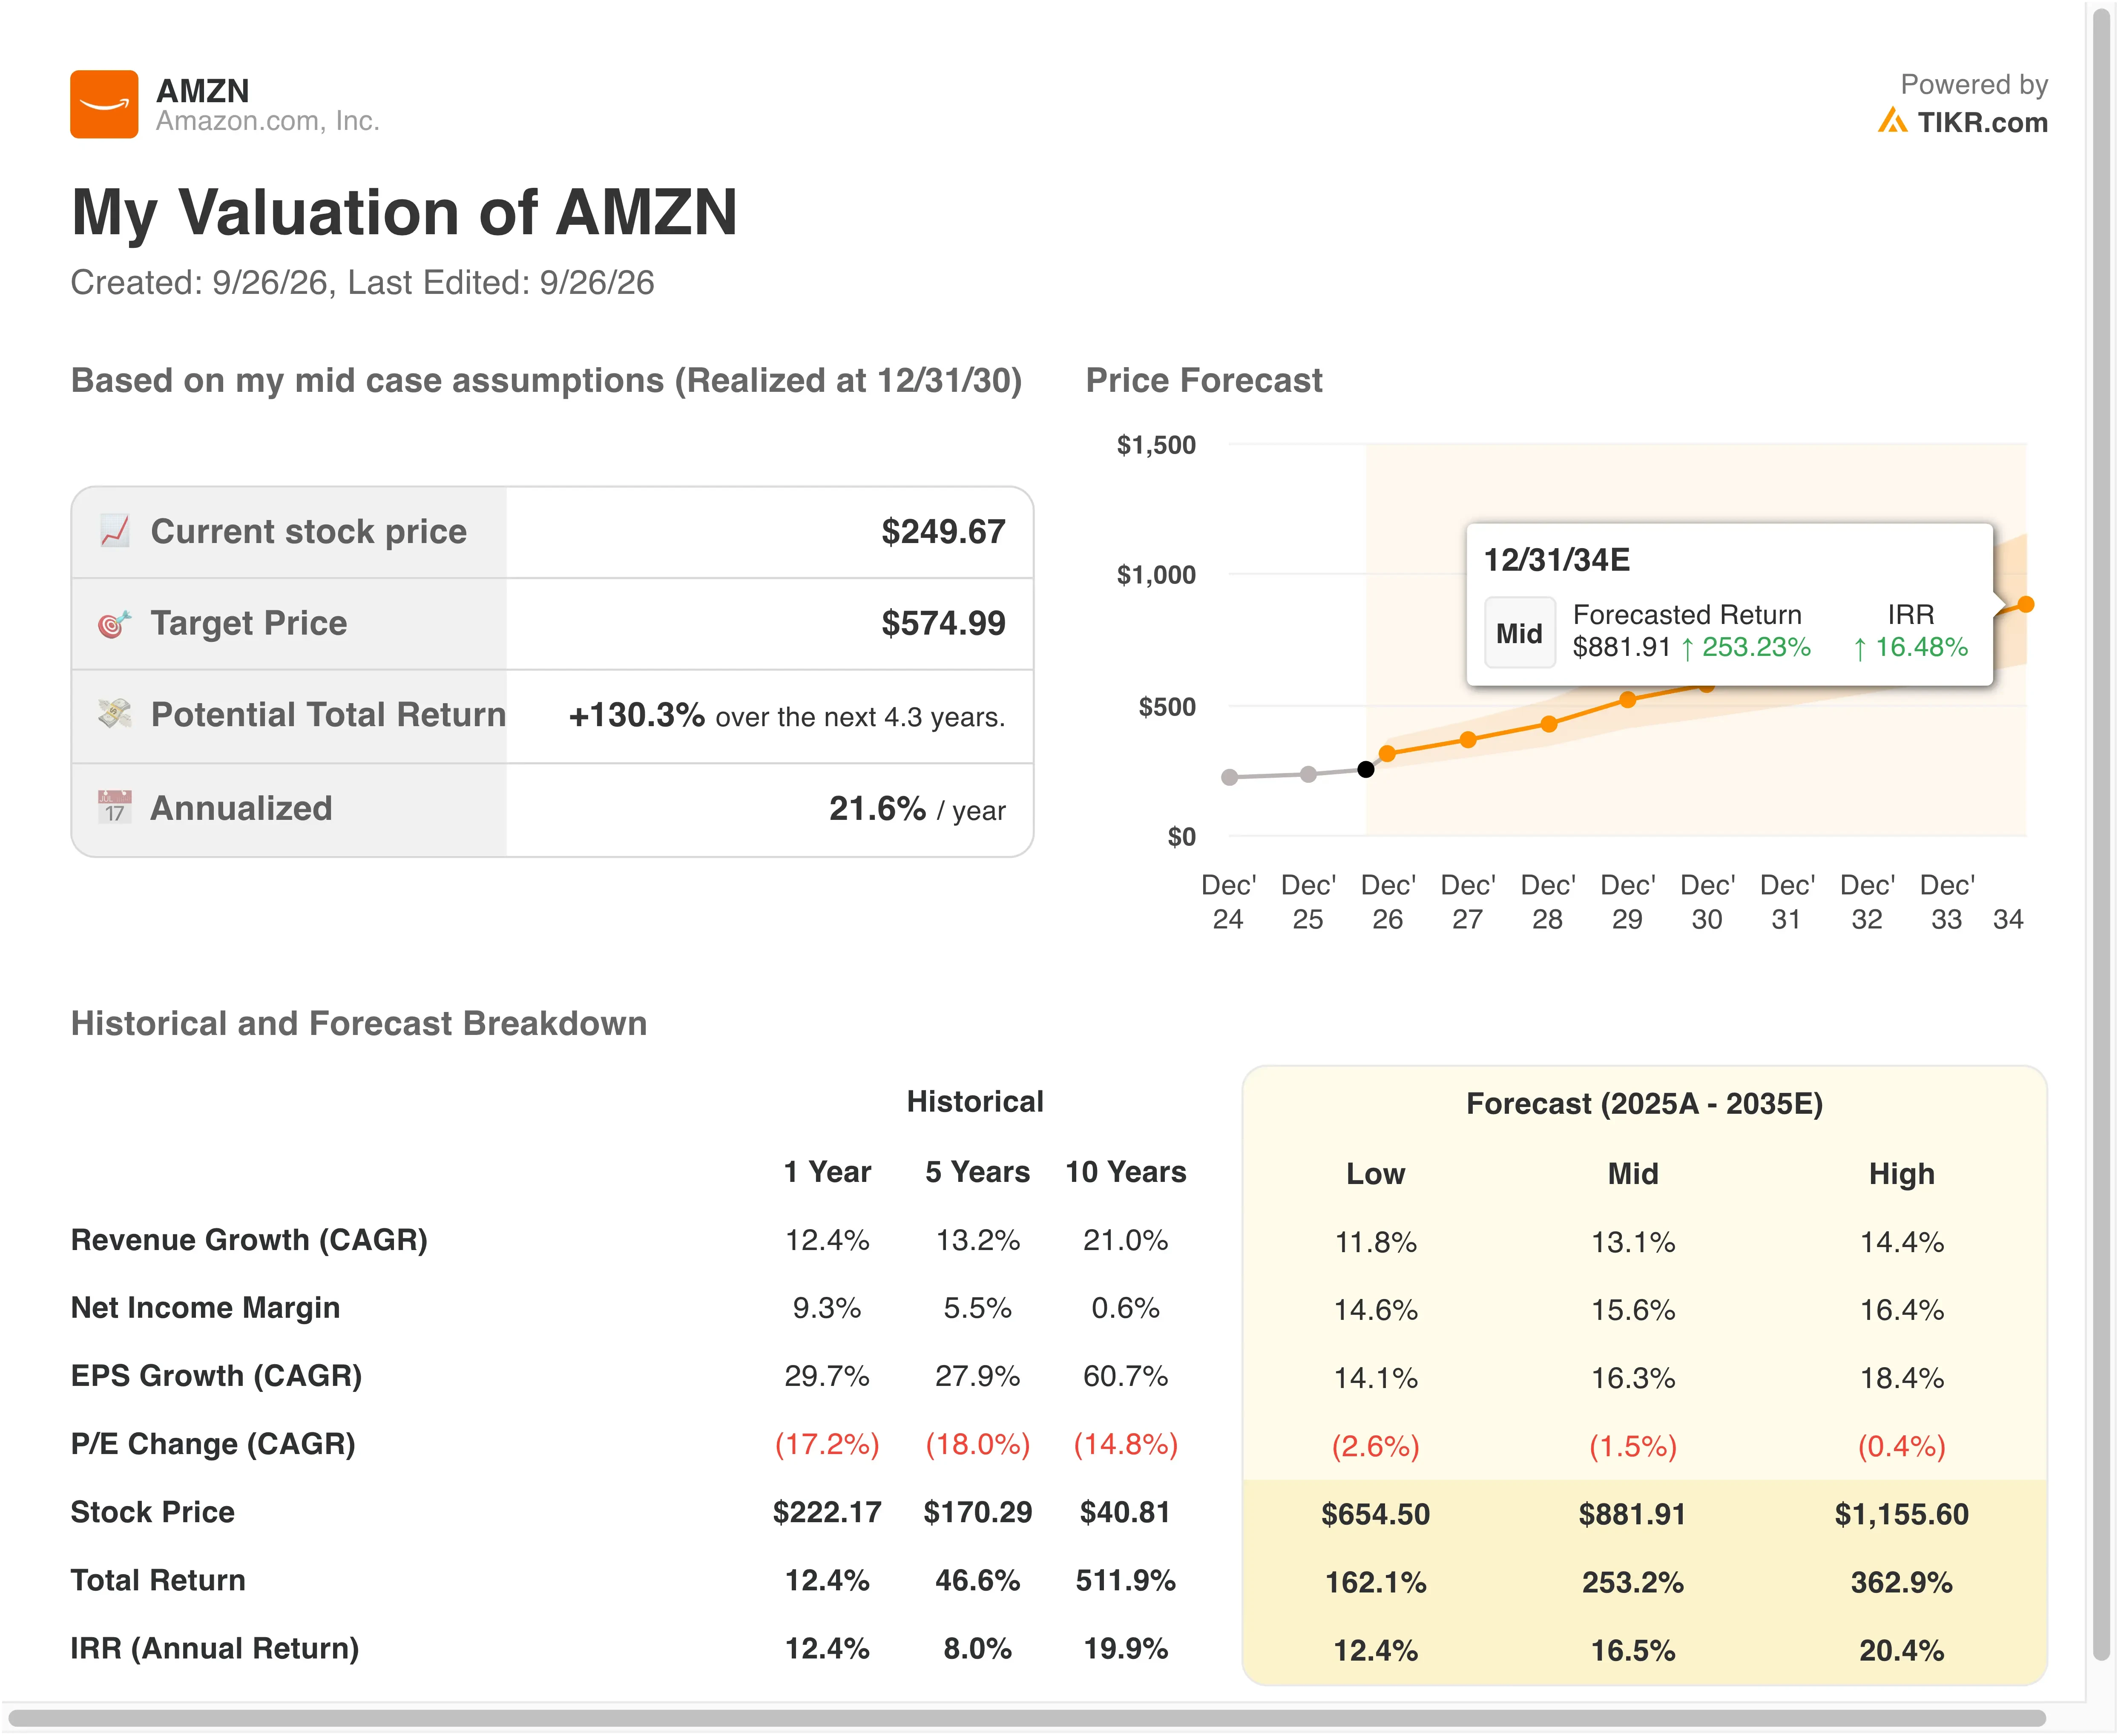
Revenue assumptions look reasonable. Growth of 15.3% sits above last year’s 12.4% but below the 10-year average of 21.0%. Analysts forecast about 15.0% annual growth over the next two years, so the model tracks consensus closely.
The multiple is the most conservative input. An exit P/E of 27.1x matches today’s forward multiple and sits below last year’s 30.0x and the 5-year average of 49.2x. A 20.5% annualized return clears the 15% threshold for genuine undervaluation. Spending is the risk, however, because cash capex should reach about $220 billion in 2026. If AWS demand cools before new capacity comes online, margins could stall.
Plug your own AWS growth and margin assumptions into Amazon’s valuation (Free with TIKR) >>>
AWS Faces a Faster Google and a Hungrier Microsoft
Microsoft (MSFT) is closing in. Azure and other cloud services grew 43% in its June quarter, and management guided to 45% next quarter. Azure topped $100 billion in annual revenue for the first time, still behind AWS’s $169 billion run rate.
Alphabet (GOOGL) is growing fastest. Google Cloud revenue surged 82% to $24.8 billion in Q2, and its $514 billion backlog now edges past AWS’s $496 billion. AWS keeps the profitability lead, though, with a 39.4% operating margin versus Google Cloud’s 35.6%.
Valuation looks similar across the two. Amazon trades at about 27.1x forward earnings, compared with roughly 25.7x for Alphabet. Alphabet’s trailing operating margin of 33.1% dwarfs Amazon’s 12.1%, but that gap is exactly what the margin thesis aims to narrow.
Amazon’s moat extends beyond cloud. Advertising revenue grew 26% to $19.8 billion in Q2, and its custom chips business now runs at more than $25 billion a year. No rival combines logistics, ads, and cloud at this scale.
Weigh whether AWS, advertising, and retail margins can propel Amazon toward $327 by 2027 >>>
What’s Driving AMZN Stock Going Forward?
Q3 guidance sets a clear bar. Amazon expects net sales of $197 billion to $202 billion and operating income of $22.5 billion to $26.5 billion. Results should arrive around October 29. Prime Day shifted into Q2 this year, so the sequential comparison will look softer.
Capacity is the defining theme. Jassy said that even with $220 billion in capex, Amazon “will still not have enough capacity to meet all the demand” in 2026. Every new data center that comes online should convert directly into AWS revenue.
Regulation could pressure the ad engine. The FTC and more than 20 states sued Amazon over alleged hidden ad surcharges, a claim Amazon called “patently false.” Because advertising is one of its fastest-growing profit streams, investors will follow the case closely.
Labor costs are rising too. Amazon lifted minimum starting pay for full-time operations workers to $20 an hour and invested another $1.9 billion in its delivery partner program. Robotics hubs like Indiana are the long-term offset, since automation lowers the cost of every package.
Stay ahead of Amazon’s Q3 report with live consensus estimates (Free with TIKR) >>>
Should You Invest in Amazon?
The only way to really know is to look at the numbers yourself. TIKR gives you free access to the same institutional-quality financial data that professional analysts use to answer exactly that question.
Pull up AMZN, and you’ll see years of historical financials, what Wall Street analysts expect for revenue and earnings in the quarters ahead, how valuation multiples have moved over time, and whether price targets are trending up or down.
You can build a free watchlist to track AMZN alongside every other stock on your radar. No credit card required. Just the data you need to decide for yourself.
Analyze AMZN stock on TIKR Free→
Disclaimer:
Please note that the articles on TIKR are not intended to serve as investment or financial advice from TIKR or our content team, nor are they recommendations to buy or sell any stocks. We create our content based on TIKR Terminal’s investment data and analysts’ estimates. Our analysis might not include recent company news or important updates. TIKR has no position in any stocks mentioned. Thank you for reading, and happy investing!