Key Stats for Zillow Group Stock
- Current Price: $33.03
- Target Price (Mid): ~$53
- Street Target: ~$47
- Potential Total Return: ~59% (over ~4 years)
- Annualized Return: ~11% / year
Now Live: Discover how much upside your favorite stocks could have using TIKR’s new Valuation Model (It’s free) >>>
What Happened?
Zillow Group (ZG) closed at $33.03 on September 8, down 6.48% in a single session and back within about four dollars of its 52-week low of $29.03. No earnings release, downgrade, or legal ruling landed that day to explain it. What did land was weak housing data: Zillow’s own August Market Report, out that morning, showed home sales slipping 0.6% year-over-year and falling sharply from July, with mortgage rates holding above 6.5%, their highest in a year. A stock already down more than 50% in 2026 sold off again into that backdrop.
The business keeps posting numbers that look nothing like the chart: revenue grew 18% last quarter, yet the stock trades closer to its low than its high. Is the selling tracking something real in the fundamentals, or is a growing company getting punished for a housing market it does not control?
A 6% Drop on a Housing Day
Zillow’s revenue is tied to transaction activity, and transaction activity is stuck. The investor relations materials show a business still compounding, but the August report described a soft close to 2026: weak sales, weaker pending sales, and rates that have pushed the typical mortgage payment above year-ago levels.
On the Q2 call, management cut its assumption for the purchase mortgage market to down low-to-mid single digits from a prior view of flat. As CFO and COO, Jeremy Hofmann put it, “affordability challenges continue to have a larger impact on mortgage buyers than cash buyers.” Because most Zillow buyers use a mortgage, a higher-rate world squeezes exactly the customer Zillow monetizes most.
The legal cloud that shadowed the stock all spring has largely lifted, which sharpens the point. Zillow settled the FTC’s rental-advertising antitrust case on August 24, and the parallel suits from five state attorneys general were resolved in the same stipulated order. A separate securities class action over the Redfin deal is still outstanding on allegations that remain unproven. With the antitrust matter closed on both the federal and state fronts, the September selloff reads as a housing-cycle reaction.

See historical and forward estimates for Zillow Group stock (It’s free!) >>>
The Business Underneath the Chart
Q2 revenue reached $772 million, up 18% and above the high end of guidance, beating the Street’s $758 million. Adjusted EBITDA was $176 million, a 23% margin, and adjusted net income was $118 million, or $0.52 per diluted share, up from $0.40 a year earlier. The engine is Zillow’s shift to its integrated “Preferred” model, which earns revenue across the transaction rather than selling a lead and watching the customer leave. That model now generates 23% more revenue per connection than the old advertising approach, and management expects 35% by year-end.
Total traffic fell 2% year-over-year in Q2 to 239 million average monthly unique users, and visits fell 2% to 2.5 billion, which management pins on rising rates and frames against Comscore data showing the category fell faster. What holds up is the direct relationship: the average buyer who ends up transacting with a Preferred agent partner visits Zillow nearly 100 times, totaling 15 hours, before ever contacting one. That is why CEO Jeremy Wacksman brushed off Google’s push into real estate listings: “80% of our traffic comes directly to us,” he said, “single-digit share of traffic comes from things like paid search.”
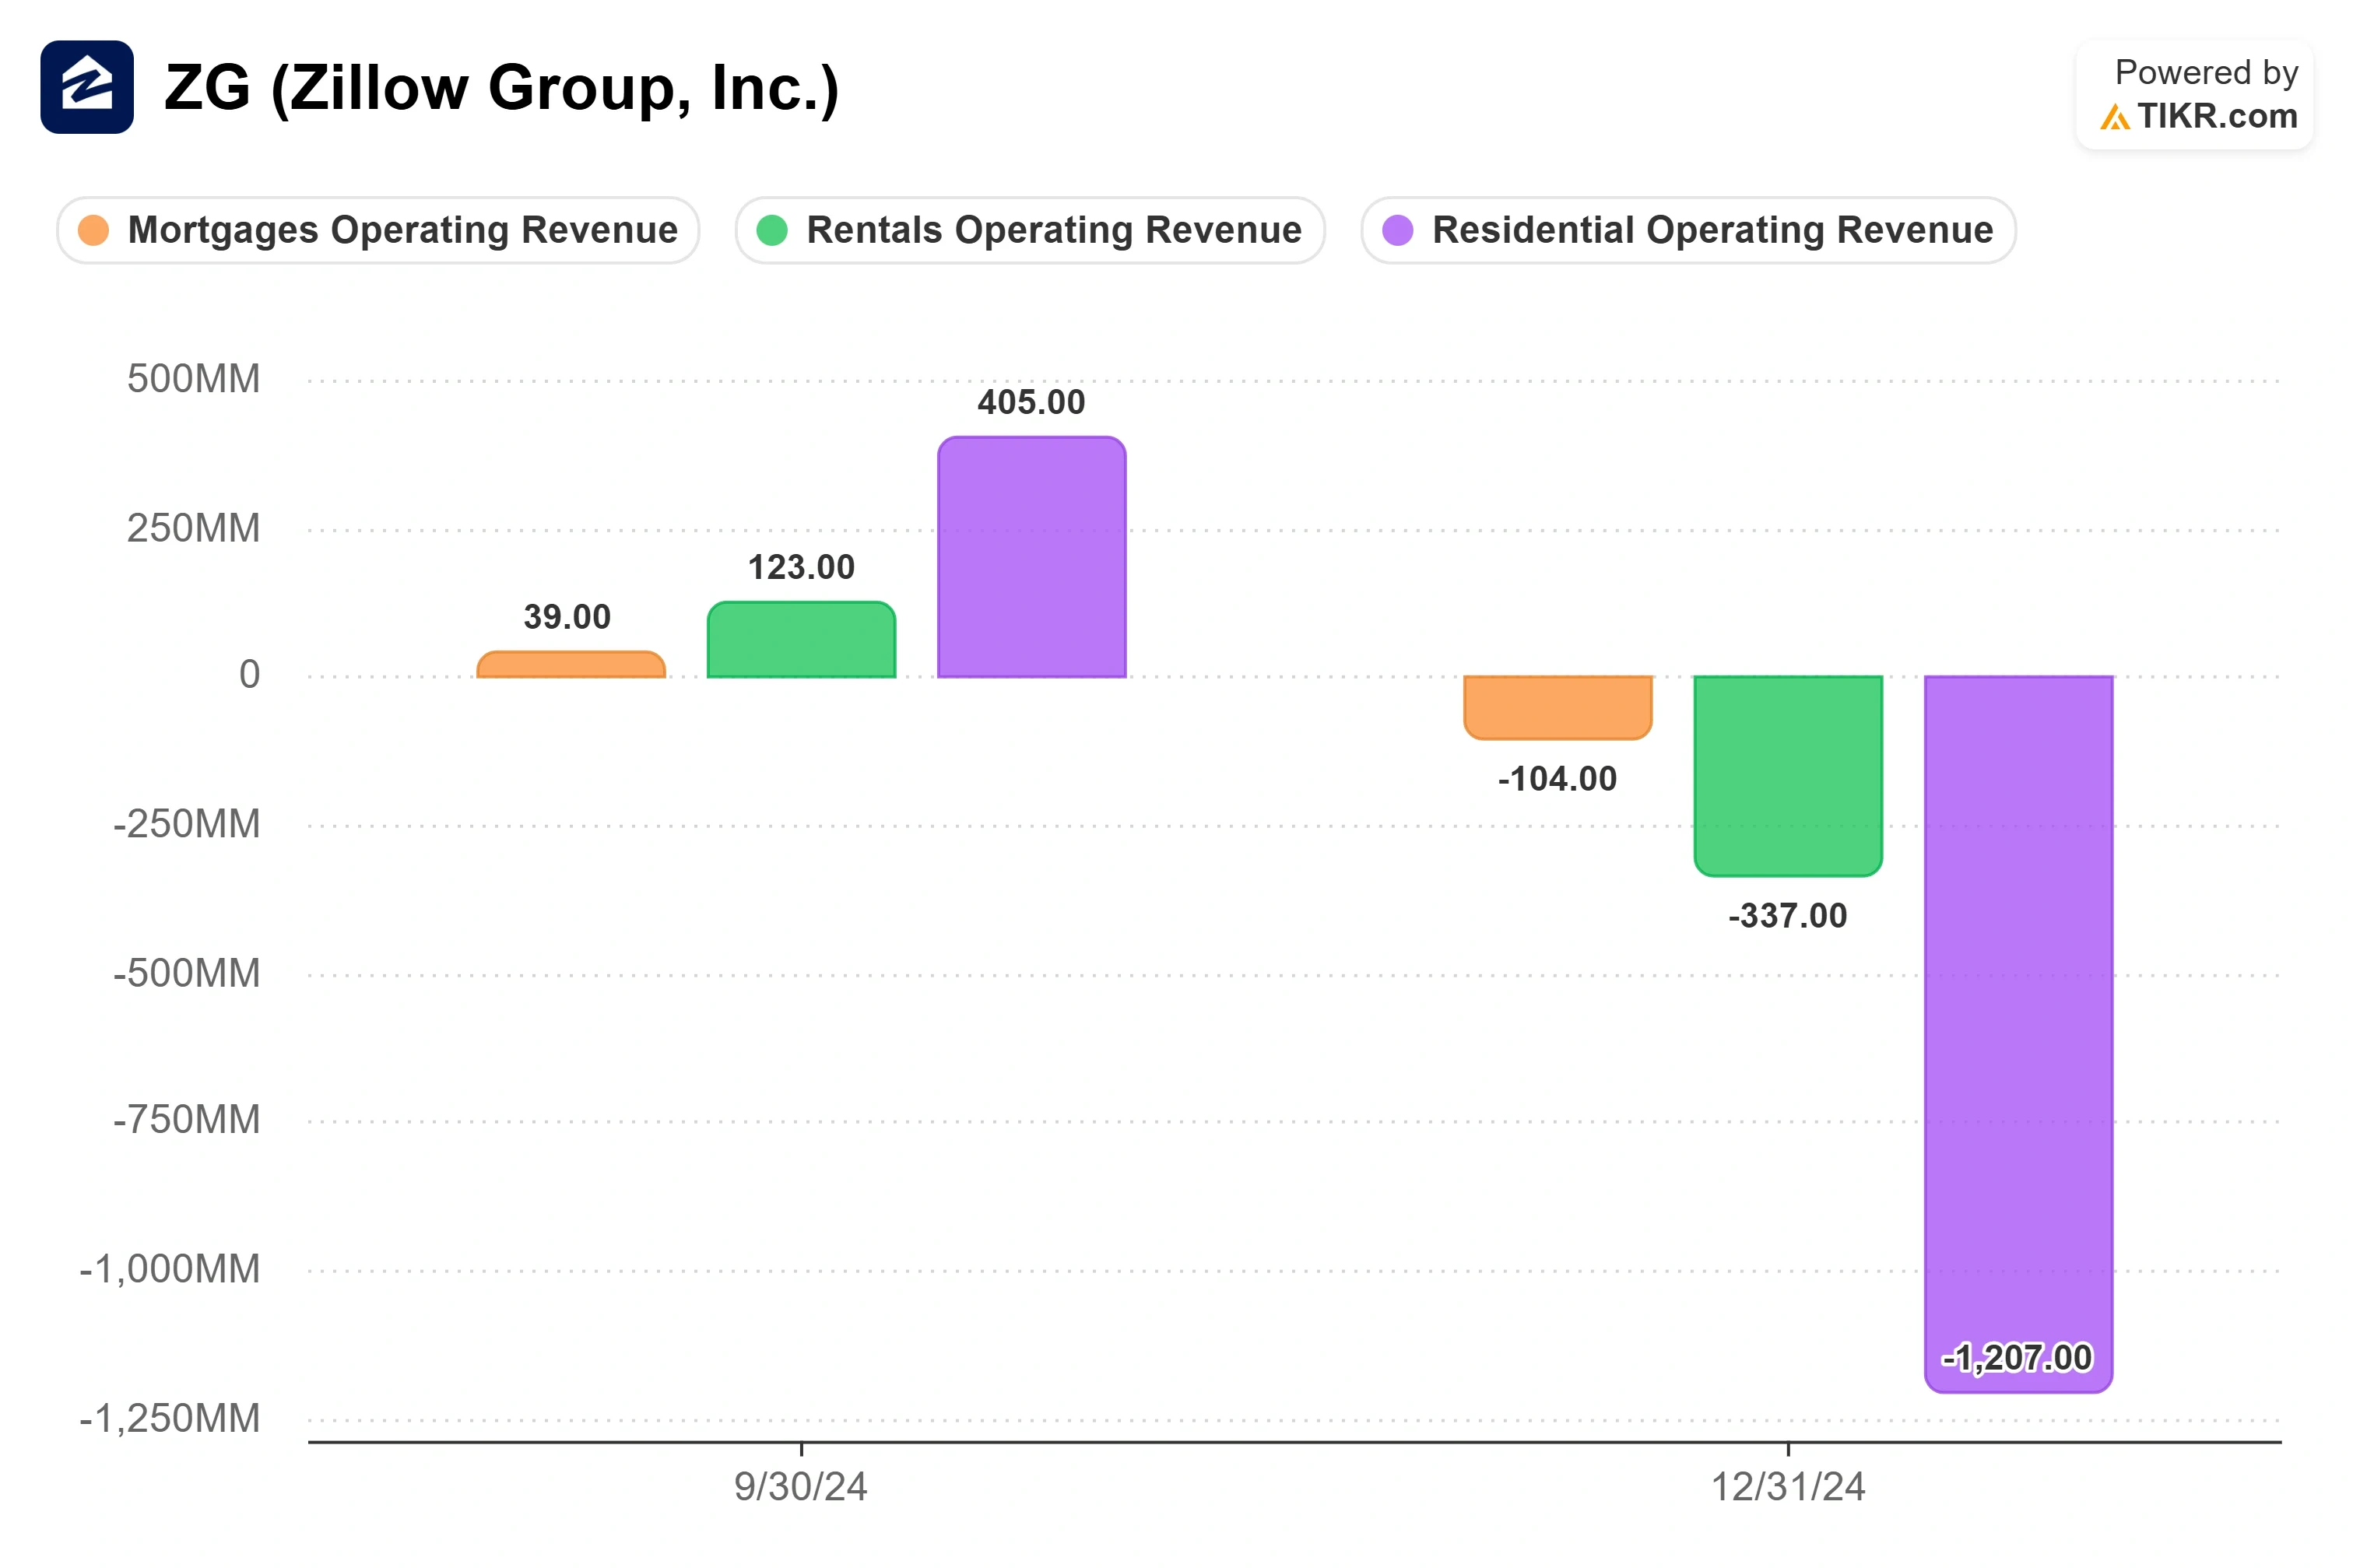
The Preferred shift moves revenue from residential into mortgages, delays recognition by six to twelve months, and adds a seasonal Q4 headwind, dropping guided Q3 growth to about 11% from 18%. The strategy is sound, but it makes the next two quarters harder to read, and a market nervous about housing has little patience for “trust the transition.” Valuation reflects that: Zillow trades near 8.6 times forward EV/EBITDA, below Colliers International at 10.4 times, even with a mid-cycle target of 45% EBITDA margins.
See how Zillow Group performs against its peers in TIKR (It’s free!) >>>
TIKR Advanced Model Analysis
- Current Price: $33.03
- Target Price (Mid): ~$53
- Potential Total Return: ~59% (over ~4 years)
- Annualized Return: ~11% / year

See analysts’ growth forecasts and price targets for Zillow Group stock (It’s free!) >>>
Using the mid-case scenario, TIKR’s model points to a target of around $53, a total return near 59%, and an annualized return of about 11% by the end of 2030. The revenue drivers are mortgages, where purchase origination is nearly doubling, and rentals, where multifamily compounds are above 40% toward a $1 billion goal. The margin driver is operating leverage from the Preferred model, aided by roughly $140 million in restructuring savings. The primary risk is the housing market: if rates stay above 6.5% and volumes keep sliding, the recovery the model assumes never shows up.
The upside is that rates ease, volume returns, and the integrated model captures far more per customer than lead-gen ever did. The downside is that a frozen market drags into 2027 while investors keep discounting a growth story they cannot yet see in reported revenue. Even the more conservative Street mean of about $47 sits well above today’s price, so the model and the analysts disagree on magnitude, not direction.
Conclusion
The next test is Zillow’s Q3 report, expected in early November. Management guided to $745 million to $760 million, so the high end would show the Preferred transition is not costing as much growth as feared, while a print below $745 million hands bears proof the housing freeze is reaching the top line. Watch mortgages: management expects over 50% growth, and if origination keeps compounding while rentals hold near 30%, the two engines carry the story even with residential soft. If both decelerate at once, near 52-week lows stops looking like an overreaction and starts looking like the market seeing something first.
See what stocks billionaire investors are buying so you can follow the smart money with TIKR.
Should You Invest in Zillow Group?
The only way to really know is to look at the numbers yourself. TIKR gives you free access to the same institutional-quality financial data that professional analysts use to answer exactly that question.
Pull up Zillow Group, and you’ll see years of historical financials, what Wall Street analysts expect for revenue and earnings in the quarters ahead, how valuation multiples have moved over time, and whether price targets are trending up or down.
You can build a free watchlist to track Zillow Group alongside every other stock on your radar. No credit card required. Just the data you need to decide for yourself.
Analyze Zillow Group on TIKR Free →
Looking for New Opportunities?
- See what stocks billionaire investors are buying so you can follow the smart money.
- Analyze stocks in as little as 5 minutes with TIKR’s all-in-one, easy-to-use platform.
- The more rocks you overturn… the more opportunities you’ll uncover. Search 100K+ global stocks, global top investor holdings, and more with TIKR.
Disclaimer:
Please note that the articles on TIKR are not intended to serve as investment or financial advice from TIKR or our content team, nor are they recommendations to buy or sell any stocks. We create our content based on TIKR Terminal’s investment data and analysts’ estimates. Our analysis might not include recent company news or important updates. TIKR has no position in any stocks mentioned. Thank you for reading, and happy investing!