
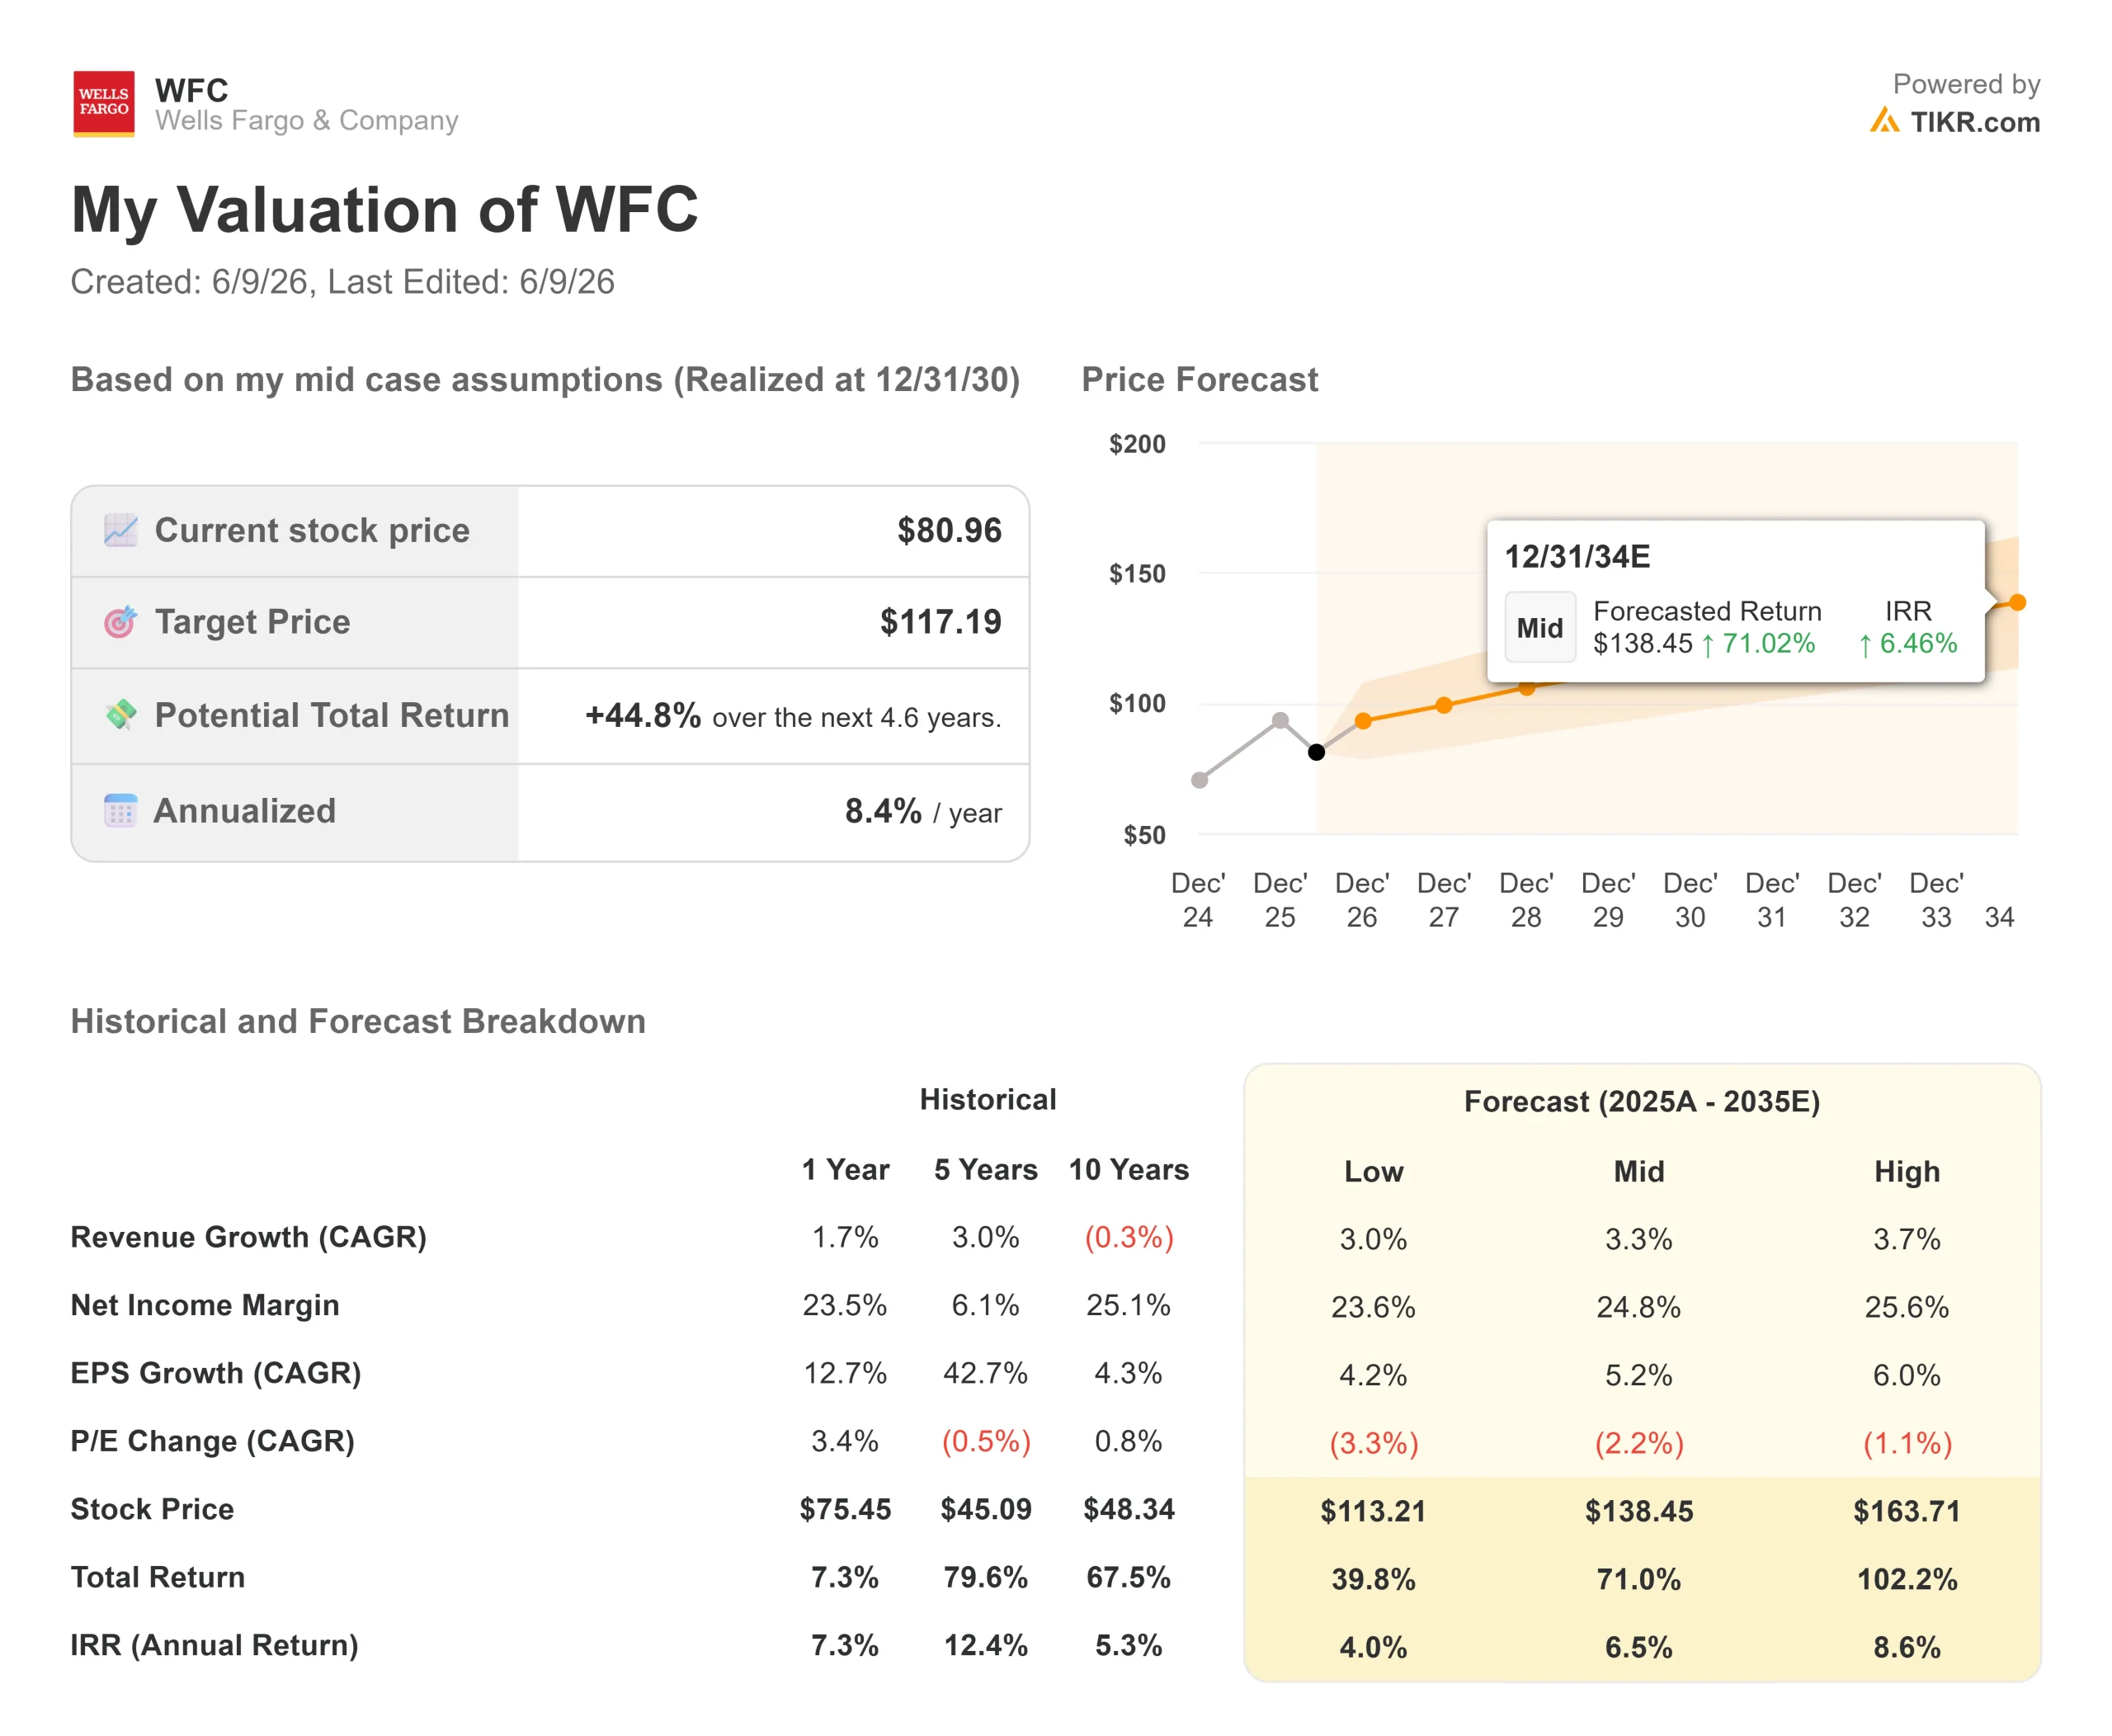
Key Stats for Wells Fargo Stock
- Current Price: $81.44
- Target Price (Mid): ~$117 (12/31/30)
- Street Target: ~$96
- Potential Total Return: ~45%
- Annualized IRR: ~8% / year
- Earnings Reaction: -1.73% (4/14/26)
- Max Drawdown: 23.83% on 5/15/26
Now Live: Discover how much upside your favorite stocks could have using TIKR’s new Valuation Model (It’s free) >>>
What Happened?
Wells Fargo & Company (WFC) is in a peculiar spot: a bank posting 15% EPS growth, a CFO openly confident about full-year guidance, and a share price sitting 17% off its 52-week high. CFO Mike Santomassimo stepped into that gap at the Morgan Stanley US Financials Conference on June 9, spending close to an hour making the case that the business is performing better than the stock price suggests.
The central tension for investors is whether Wells Fargo’s post-asset-cap growth story is real and durable, or whether the easy re-rating has already happened. The stock peaked at $97.76, pulled back after Q1 earnings disappointed on revenue, and now trades at $81.44, well below the Street’s consensus target of $96.11.
What the CFO Said That the Market Is Underpricing
Santomassimo opened with a direct read on the consumer: debit and credit card spend was up 9% year-on-year in May, even with gas prices absorbing roughly $1 billion of incremental spend. “We’re not seeing any real changes in the other aggregate categories of any substance,” he said. Credit performance, he noted, is “a little bit better than we model each month, not a little bit worse and that’s been a continuing trend now for a while.”
On net interest income (NII, the difference between what the bank earns on loans and what it pays depositors), Santomassimo was unequivocal: “We’re very confident in our $50 billion target.” Q2 NII will step up from Q1’s $12.1 billion, he said, consistent with the full-year trajectory. The rate environment has shifted since January, with fewer expected Fed cuts, but he characterized the net impact as modest and roughly neutral for the full year. That confidence, delivered while the stock trades more than 10% below Street consensus, is the core signal here.
The Credit Card Machine Is Just Getting Started
One of the clearest multi-year earnings drivers is the credit card vintage maturation curve. Wells Fargo rebuilt its entire card lineup from scratch, launching 13 new products over the past five years. The 2022 and 2023 vintages are now profitable. The 2024 vintage is close. The 2025 and 2026 vintages, where originations grew more than 20% last year and continue growing this year, will mature over the next two to three years.
The bottom line: the card business is flipping from an earnings drag to an earnings contributor, and that contribution grows each year with each vintage season. “We’re transitioning from the acquisition of these new vintages being a drag on profitability to contributing positively to profitability this year, and that will start to build as we go over the next couple of years,” Santomassimo said.
The auto business adds another layer. With 70% of the portfolio at 700-plus FICO scores and a VW/Audi partnership driving new volume, Wells Fargo re-entered auto lending with a prime-focused book. Santomassimo confirmed returns on new originations are tracking to underwriting assumptions.

See historical and forward estimates for Wells Fargo stock (It’s free!) >>>
The Wall Street Build Is Working
Since the asset cap was lifted, Wells Fargo has grown its market balance sheet by roughly $180 billion. In Q1 2026, equity revenues rose 15% year-on-year, and fixed income revenues rose 20%. Total Markets revenue climbed 21%. For Q2, Santomassimo guided for mid-teens market revenue growth year-over-year.
The investment banking push runs alongside it. According to Dealogic, Wells Fargo jumped from 17th to 8th in the global M&A league table by volume in 2025, the biggest single-year jump among major banks. Commercial banking clients alone generate between $2 billion and $4 billion in annual investment banking fees, and Santomassimo said market share there is rising each year, with more room to go. Nine of the top 10 financing clients are now doing more business with Wells Fargo than before the balance sheet expansion.
On the wealth side, roughly 2,500 branch-based advisers are already deployed through Wells Fargo Premier (the bank’s combined banking and wealth offering for affluent clients). Adviser attrition has stabilized, recruiting is pulling teams from across Wall Street, and a new adviser workstation has rolled out firm-wide. Deposit and investment flows from that channel are just starting to show up in the numbers.
Taken together, these are three revenue streams: markets, investment banking, and wealth that were either capped or underdeveloped for seven years. They are all growing simultaneously now.
Valuation-wise, WFC trades at 11.18x NTM P/E (next twelve months earnings, per TIKR). JPMorgan (JPM) trades at 14.07x, Bank of America (BAC) at 11.79x, and Citigroup (C) at 12.00x. The sector mean across TIKR’s bank peer set sits at 11.67x. Wells Fargo trades at a discount to that mean despite having an idiosyncratic earnings ramp that JPM, BAC, and C do not have: the credit card vintage curve, the post-cap commercial deposit build, and the nascent investment banking platform are all adding revenue that wasn’t there two years ago.

See how Wells Fargo performs against its peers in TIKR (It’s free!) >>>
TIKR Advanced Model Analysis
- Current Price: $81.44
- Target Price (Mid): ~$117 (12/31/30)
- Potential Total Return: ~45%
- Annualized IRR: ~8% / year
See analysts’ growth forecasts and price targets for Wells Fargo stock (It’s free!) >>>
The TIKR mid-case assumes a revenue CAGR of around 3.3% and a net income margin expanding to around 25%, both modest by bank standards and arguably conservative given the current growth trajectory. The two primary revenue drivers are NII growth from the expanding loan and deposit base, and fee revenue acceleration from investment banking, wealth, and a maturing card portfolio. The margin driver is operating leverage: more than 20 consecutive quarters of headcount reductions, with expense guidance confirmed at ~$55.7 billion for 2026.
The primary risk is NIM (net interest margin, the bank’s lending spread expressed as a percentage of assets) compression as the mix shifts toward lower-yielding interest-bearing commercial deposits. Santomassimo guided for 3 to 4 basis points of NIM compression into Q2, acknowledged, but framed as a mix-shift outcome from successful deposit gathering, not a sign of pricing pressure. In Q1, the bank repurchased $4.0 billion of common stock with its CET1 ratio (a key measure of capital adequacy) at 10.3%, within its 10%–10.5% target range. The dividend yield sits at 2.4% at current prices.
If NII ramps toward $50 billion, the card vintages contribute from 2027, and the investment bank keeps gaining wallet share, free cash flow improves faster than the model assumes, and the ~45% total return is conservative. If credit quality in the newer consumer portfolios deteriorates as those vintages age, or if rates stay higher in a way that pressures loan demand, the timeline stretches.
Conclusion
The Q2 2026 earnings report, expected in mid-July, is the next checkpoint. Santomassimo guided for a step-up in NII from Q1’s $12.1 billion, and mid-teens market revenue growth. The number that matters is NII excluding markets, which needs to be tracking toward ~$48 billion for the full year. If it is, the $50 billion target moves from confident guidance to probable outcome, the 17–18% ROTCE roadmap has a defined timeline, and the gap between $81 and the Street’s $96 target starts to look like an opportunity rather than a warning. If NII disappoints again, the market’s skepticism gets another data point to lean on.
See what stocks billionaire investors are buying so you can follow the smart money with TIKR.
Should You Invest in Wells Fargo?
The only way to really know is to look at the numbers yourself. TIKR gives you free access to the same institutional-quality financial data that professional analysts use to answer exactly that question.
Pull up Wells Fargo, and you’ll see years of historical financials, what Wall Street analysts expect for revenue and earnings in the quarters ahead, how valuation multiples have moved over time, and whether price targets are trending up or down.
You can build a free watchlist to track Wells Fargo alongside every other stock on your radar. No credit card required. Just the data you need to decide for yourself.
Analyze Wells Fargo on TIKR Free →
Looking for New Opportunities?
- See what stocks billionaire investors are buying so you can follow the smart money.
- Analyze stocks in as little as 5 minutes with TIKR’s all-in-one, easy-to-use platform.
- The more rocks you overturn… the more opportunities you’ll uncover. Search 100K+ global stocks, global top investor holdings, and more with TIKR.
Disclaimer:
Please note that the articles on TIKR are not intended to serve as investment or financial advice from TIKR or our content team, nor are they recommendations to buy or sell any stocks. We create our content based on TIKR Terminal’s investment data and analysts’ estimates. Our analysis might not include recent company news or important updates. TIKR has no position in any stocks mentioned. Thank you for reading, and happy investing!