


Key Takeaways
- On Oct. 8, PepsiCo cut its fiscal 2026 core EPS growth outlook to 2.5% to 3.5%, while Verizon expects its free cash flow to grow 9% to 10% in 2026.
- Verizon yields 6.2% and paid 54% of its free cash flow as dividends over the twelve months to June 30, 2026.
- PepsiCo yields 4.7% and raised its dividend 6.9% a year from fiscal 2020 to fiscal 2025, but those dividends took all of its free cash flow in fiscal 2024 and 2025.
- At their 5-year growth rates, $10,000 in PepsiCo would pay about $19,100 over 20 years, and the same amount in Verizon about $15,000, so the question is whether each pace can hold.
On Oct. 8, PepsiCo (PEP) cut its outlook for the year. It now expects core EPS to grow 2.5% to 3.5% in fiscal 2026, down from the low end of 5% to 7%, as input costs rise. Chairman and CEO Ramon Laguarta was blunt about it on the call: “We’re not satisfied with the performance in the U.S.”
That’s a gut check for anyone counting on PepsiCo’s 4.7% yield, and it’s why Verizon Communications (VZ) belongs in the comparison. Verizon’s 6.2% yield pays more today, and Verizon expects its free cash flow to grow 9% to 10% this year.
So if you could hold only one of these dividends for the next 20 years, which one should it be?
| Metric | Verizon (VZ) | PepsiCo (PEP) |
|---|---|---|
| Dividend yield | 6.2% | 4.7% |
| Annual dividend, current rate | $2.83 | $5.92 |
| Dividend growth, fiscal 2020–2025 | 1.9% a year | 6.9% a year |
| Cash dividend payout ratio (TTM) | 54% (to June 30, 2026) | 75% (to Sept. 16, 2026) |
| Net debt/EBITDA | 3.35x | 1.89x |
| Interest coverage (EBIT/interest) | 4.36x | 14.88x |
Source: TIKR and StockAnalysis, Oct. 9, 2026.
Verizon’s check comes with room to spare
Verizon’s dividend rose 1.9% a year from fiscal 2020 to fiscal 2025, from $2.48 to $2.73 a share, and on its first-quarter call management called it “the 20th consecutive year of dividend increases, a track record we’re extremely proud of.”
What makes this dividend sturdy is the cash behind it. Over the twelve months to June 30, 2026, Verizon’s dividends took a well-covered 54% of its free cash flow. Free cash flow did fall short of the dividend in fiscal 2016 and 2017, but it has run well ahead of it every year since…

It’s still climbing. Free cash flow was $6.4 billion in the second quarter of 2026, up 24.4% from a year before.
In that quarter, mobility and broadband service revenue rose 2.8% to about $23.4 billion, and adjusted EBITDA reached a record $13.7 billion, up 7.2%.
The risk is debt: at 3.35x EBITDA, Verizon has to keep paying it down while it raises the dividend.
PepsiCo’s raises have outrun its cash
PepsiCo’s dividend has grown much faster than Verizon’s. It rose 6.9% a year from fiscal 2020 to fiscal 2025, from $4.02 to $5.62 a share.
The cash behind it hasn’t kept pace. PepsiCo’s free cash flow was $7.62 billion in fiscal 2016 and $7.67 billion in fiscal 2025. Over the same years, the dividends it paid rose from $4.23 billion to $7.64 billion…

That left a risky cash dividend payout ratio of 100.6% in fiscal 2024 and 99.6% in fiscal 2025. Coverage has improved to 75% over the twelve months to Sept. 16, 2026.
The business is mixed. Net revenue rose 5.6% in the third quarter of 2026, organic revenue rose 3.1%, and every international segment grew. Core EPS rose just 2%, to $2.34 from $2.29, as core operating margin shrank on higher costs. North American soft drinks are still struggling.
So which dividend wins?
If I could hold only one of these for the next 20 years, it’s Verizon.
At first glance, the income math points the other way. At their 5-year growth rates, $10,000 in PepsiCo would pay about $19,123 over 20 years, against about $14,974 in Verizon, and PepsiCo’s yearly income would pass Verizon’s around 2032. Still, those totals lean on two decades of 6.9% raises from a dividend that used up all of PepsiCo’s free cash flow in fiscal 2024 and 2025, at a company whose free cash flow was no higher in fiscal 2025 than in fiscal 2016.
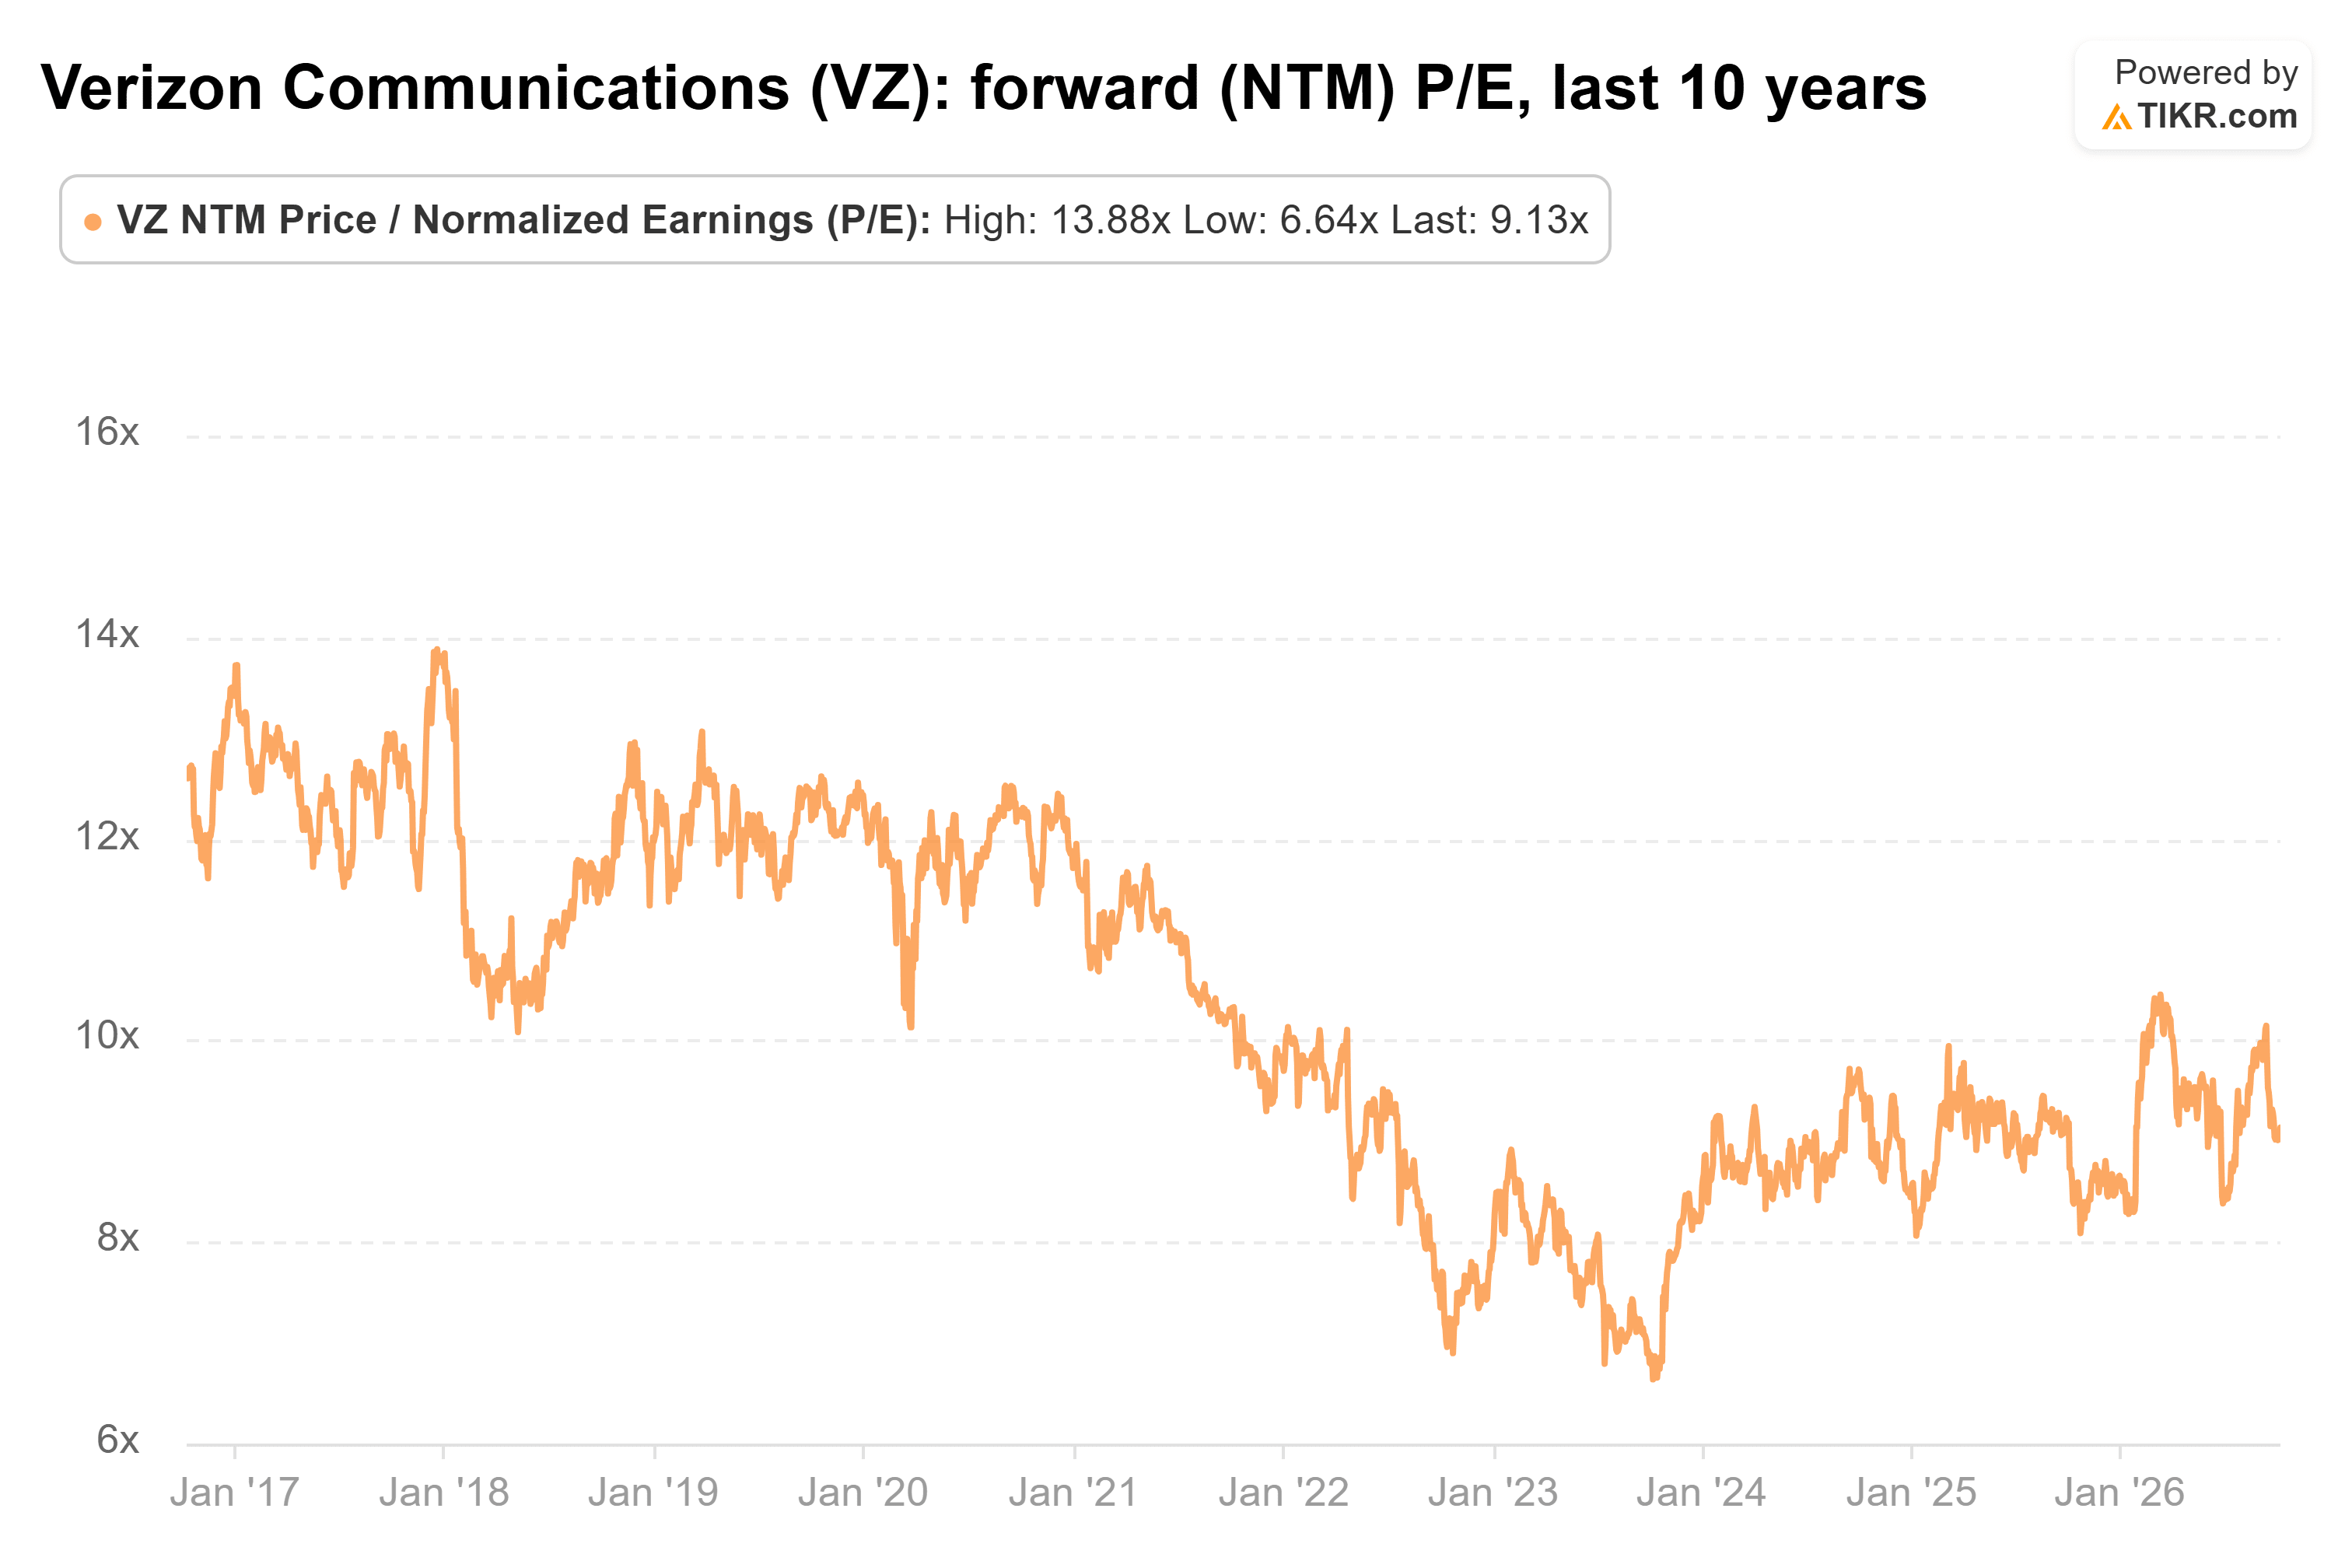
Verizon’s 1.9% pace is slow, but it holds up. At that rate, $10,000 would pay about $893 in year 20, roughly an 8.9% yield on your cash today. You also don’t pay a premium for it: Verizon trades at 9.1x forward earnings, below its 10-year average of 10.3x and well below its 13.9x high from December 2017…
To be fair, PepsiCo’s dividend isn’t in trouble. Its international business is growing, its balance sheet is the stronger one, and its coverage has improved to 75%. Over 20 years, though, I’d rather own the dividend that already has cash to spare.
PepsiCo is still working out the structural cost cuts it announced on Oct. 8, and if it gets its free cash flow growing again, the case for its faster raises gets much stronger.
So what is Verizon stock actually worth?
TIKR lets you forecast the future price of any stock in less than a minute. Just enter a few assumptions into TIKR’s valuation model and see what Verizon could be worth. Start from Wall Street consensus estimates, or adjust the inputs to reflect your own view of the business. It’s free to use.
Disclaimer:
Please note that the articles on TIKR are not intended to serve as investment or financial advice from TIKR or our content team, nor are they recommendations to buy or sell any stocks. We create our content based on TIKR Terminal’s investment data and analysts’ estimates. Our analysis might not include recent company news or important updates. TIKR has no position in any of the stocks mentioned. Thank you for reading, and happy investing!


