Key Takeaways
- Duke Energy yields 3.8% to Coca-Cola’s 2.5%, but Coca-Cola’s dividend grew 4.5% a year from fiscal 2020 to fiscal 2025, against 2.0% for Duke.
- Coca-Cola’s dividend took 77% of its free cash flow in the twelve months to July 3, 2026, after free cash flow fell short of the dividend in fiscal 2024 and 2025.
- Duke’s dividend was 67% of normalized EPS in fiscal 2025, but its net debt is 5.4x EBITDA as it builds new generation.
- At each stock’s 5-year rate, $10,000 in Duke pays about $1,432 more over 20 years, while Coca-Cola’s yearly income would pass Duke’s around 2044.
Duke Energy (DUK) raised its quarterly dividend by 2% in July. On its Aug. 4 call, Duke said that raise marked “over 20 years of consecutive annual dividend increases.”
That 2% matters because Coca-Cola (KO) has raised its dividend more than twice as fast: 4.5% a year from fiscal 2020 to fiscal 2025, against 2.0% for Duke. Duke pays the bigger check today, though, at a 3.8% yield to Coca-Cola’s 2.5%.
So if only one of them gets my dividend dollars for the next 20 years, which should it be?
| Metric | Coca-Cola (KO) | Duke Energy (DUK) |
|---|---|---|
| Dividend yield | 2.5% | 3.8% |
| Current dividend | $2.12 a year | $4.34 a year |
| Dividend growth, fiscal 2020–2025 | 4.5% a year | 2.0% a year |
| Coverage, on its own measure | Cash dividend payout ratio: 77% (TTM to July 3, 2026) | Payout ratio of normalized EPS: 67% (fiscal 2025) |
| Net debt/EBITDA (LTM) | 1.6x | 5.4x |
| Interest coverage (LTM) | 10.19x | 2.35x |
Source: TIKR, Oct. 9, 2026; current dividends from StockAnalysis.
Coca-Cola’s brands are pulling their weight
In the second quarter of 2026, Coca-Cola’s net revenues grew 7% to $13.4 billion against the same quarter a year before, and comparable EPS grew 11% to $0.97. Management guides for about 5% organic revenue growth in 2026.
The dividend’s coverage has been bumpier. Free cash flow came up short of dividends in four of the last ten fiscal years, including fiscal 2024 and 2025, when dividends took 176% and 166% of it…
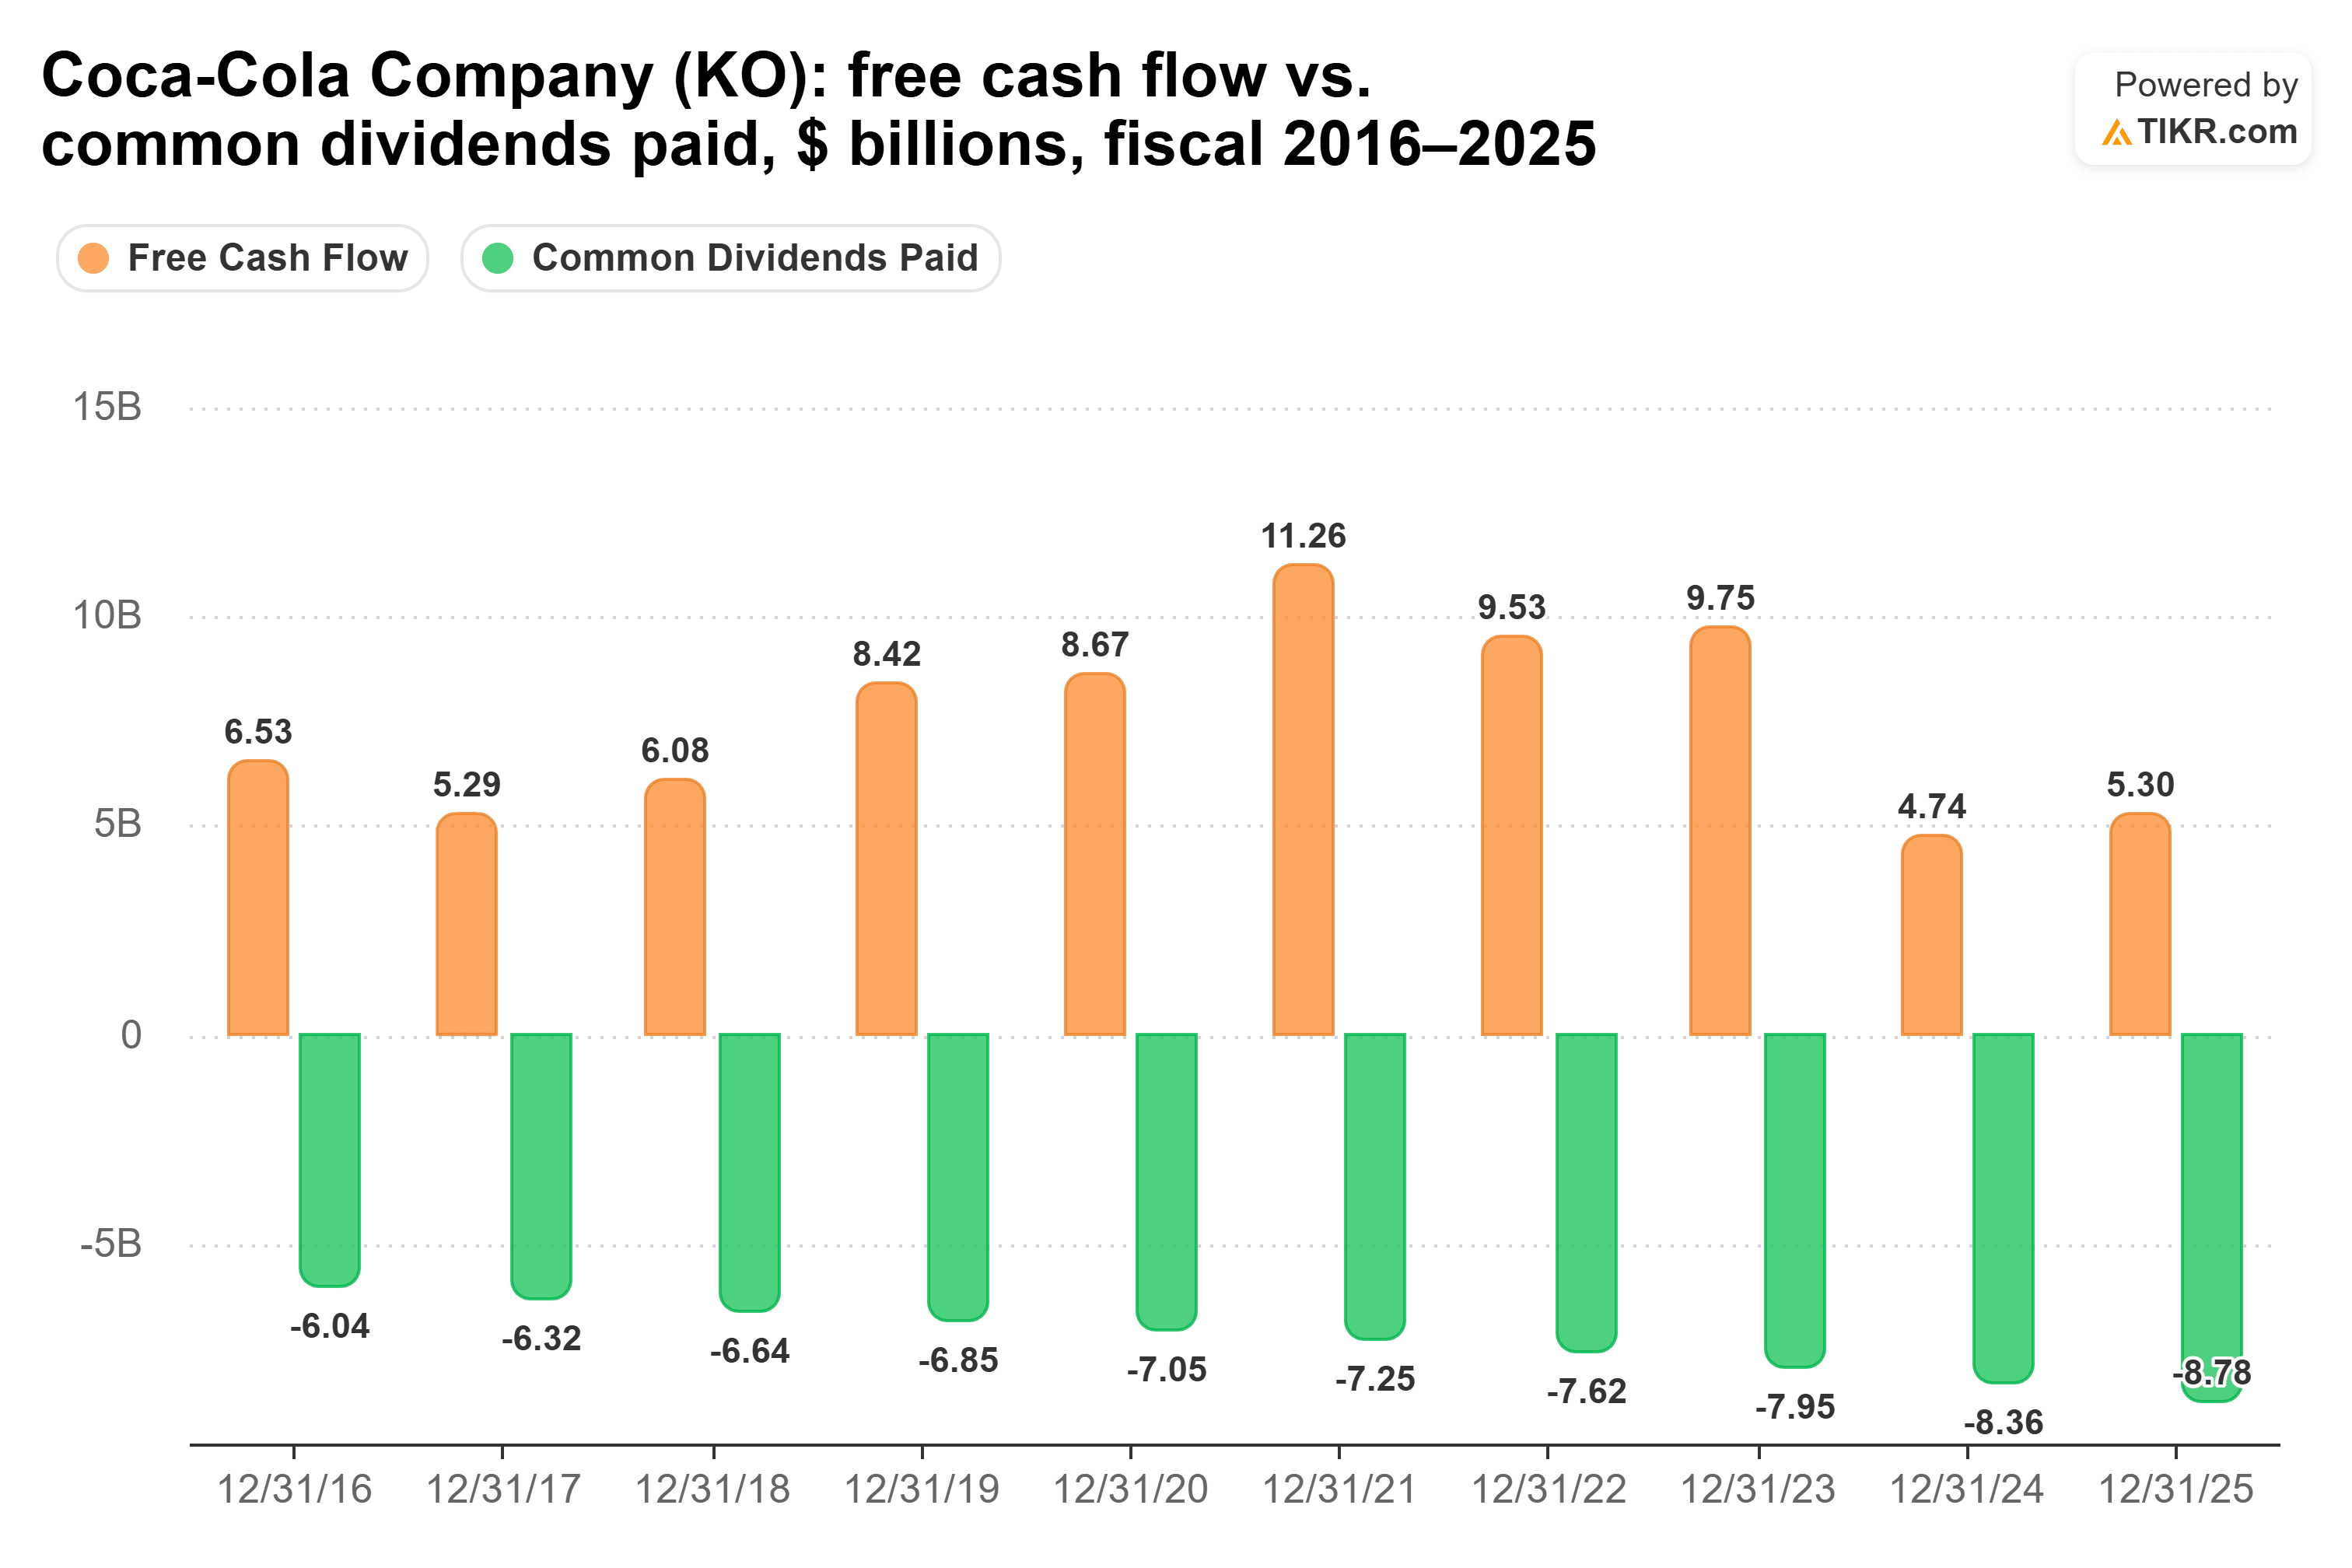
…but the twelve months to July 3, 2026 look much healthier: $14.30 billion of free cash flow against $11.06 billion of dividends, a cash dividend payout ratio of 77%. That’s covered, though not by a wide margin.
President and CFO John Murphy points to “the strength of our balance sheet” as the reason Coca-Cola can both reinvest and return capital. The numbers agree: over the last twelve months, net debt is 1.6x EBITDA and EBIT covers interest 10.19x.
The risk is that those twelve months turn out to be the exception after two weak years.
Duke’s dividend rides a data center build
Duke’s coverage has followed a smoother path than Coca-Cola’s. As a regulated utility, Duke is judged on its payout ratio of normalized EPS. That ratio fell from 77% in fiscal 2018 to a comfortable 67% in fiscal 2025, as normalized EPS grew from $4.72 to $6.31…

Duke’s growth is coming from data centers. The company has signed 7.8 gigawatts of electric service agreements with data center customers and plans 15 gigawatts of new generation capacity by 2031, and management expects adjusted EPS to grow 5% to 7% a year through 2030, starting from the $6.30 midpoint of its 2025 guidance.
The dividend, for now, is growing more slowly than that.
The risk is the debt behind the build. Net debt is 5.4x EBITDA, and EBIT covers interest just 2.35x, which means operating profit is only a little more than twice the interest bill.
So which one gets my dividend dollars?
Coca-Cola gets my dividend dollars for the next 20 years, because over two decades I care most about how long a dividend can keep growing.
$10,000 in Coca-Cola pays $250 a year today, against $380 in Duke. But at each stock’s 5-year rate, Coca-Cola’s income passes Duke’s around 2044 and reaches about $573 in year 20, a 5.7% yield on your original cash.
Duke’s growth needs outside money. Its capital spending has topped its operating cash flow in four of the last five fiscal years and matched it in the fifth. In fiscal 2025, capex was $14.0 billion against $12.3 billion of operating cash flow…

On the Aug. 4 call, Executive Vice President and CFO Brian Savoy said Duke is “taking a proactive approach to equity funding,” which is a polite way of saying the company expects to lean on outside money to pay for the build.
To be fair, Duke’s dividend is safe, and it pays the bigger check today. Its payout ratio has come down from 77% in fiscal 2018 to 67% in fiscal 2025, and at these rates Duke even pays about $1,432 more over the 20 years. Still, 20 years is a long time, and I’d rather own the faster-growing dividend backed by the stronger balance sheet, with the bigger check by year 20.
Coca-Cola has something to prove as well, since its free cash flow trailed its dividend in fiscal 2024 and 2025. The next few reports need to show that 77% is holding up.
So what is Coca-Cola stock actually worth?
TIKR lets you forecast the future price of any stock in less than a minute. Just enter a few assumptions into TIKR’s valuation model and see what Coca-Cola could be worth. Start from Wall Street consensus estimates, or adjust the inputs to reflect your own view of the business. It’s free to use.
Disclaimer:
Please note that the articles on TIKR are not intended to serve as investment or financial advice from TIKR or our content team, nor are they recommendations to buy or sell any stocks. We create our content based on TIKR Terminal’s investment data and analysts’ estimates. Our analysis might not include recent company news or important updates. TIKR has no position in any of the stocks mentioned. Thank you for reading, and happy investing!