


Key Takeaways
- General Mills yields 7.7% against 3.7% for Hershey, but General Mills plans to hold its dividend flat in the near term while it pays down debt.
- Hershey raised its dividend 11.7% a year from fiscal 2020 to fiscal 2025, against 3.9% a year at General Mills from fiscal 2021 to fiscal 2026.
- General Mills paid out 85% of its free cash flow as dividends over the twelve months to Aug. 30, 2026, against 50% at Hershey over the twelve months to June 28, 2026.
- General Mills carries net debt of 3.7x EBITDA, above its own 3x target, against 1.8x at Hershey.
A 7.7% yield is hard for any income investor to pass up. General Mills (GIS) pays one, though on Sept. 23 its CFO said the company expects to hold its dividend flat in the near term while it pays down debt.
Hershey (HSY), meanwhile, yields 3.7%. But it raised its dividend 11.7% a year from fiscal 2020 to fiscal 2025 ($3.15 to $5.48 a share), against 3.9% a year at General Mills from fiscal 2021 to fiscal 2026 ($2.02 to $2.44).
So if you put $10,000 into one of them today, which pays you more over the next 10 years?
| Metric | General Mills (GIS) | Hershey (HSY) |
|---|---|---|
| Dividend yield | 7.7% | 3.7% |
| Annual dividend | $2.44 | $5.81 |
| 5-year dividend growth | 3.9% a year (fiscal 2021–2026) | 11.7% a year (fiscal 2020–2025) |
| Cash dividend payout ratio (TTM) | 85% (to Aug. 30, 2026) | 50% (to June 28, 2026) |
| Net debt / EBITDA | 3.67x | 1.84x |
| Interest coverage | 4.94x | 9.64x |
| Forward P/E (NTM) | 10.4x | 17.3x |
General Mills is paying down debt first
In the first quarter of fiscal 2027, which ended Aug. 30, 2026, General Mills’ net sales fell 3% to $4.4 billion. The company puts the drop down to selling its U.S. yogurt business, and organic sales were flat. For fiscal 2027, it guides to organic sales between down 1.5% and up 0.5%, with at least $750 million in cost savings.
The cash behind the dividend has thinned too. Free cash flow fell from $2.29 billion in fiscal 2025 to $1.63 billion in fiscal 2026 (the year to May 2026). Dividends paid were $1.34 billion and $1.32 billion in those years, so the cash dividend payout ratio jumped from 58% to 81%.

Over the twelve months to Aug. 30, 2026, it’s a thin 85%.
CFO Kofi Bruce was clear about the priority: “we remain fully committed to our dividend, and in the near term, we expect to maintain the current rate per share while we prioritize deleverage.”
The risk is cash. First-quarter operating cash flow was $298 million, down from $397 million a year earlier and short of the $330 million the company paid in dividends.
Hershey has room behind its dividend
Hershey offers less income today, with a growing business behind it. Net sales rose 6.6% to $2.79 billion in the second quarter of 2026, which ended June 28. For 2026, it guides to net sales growth of 4.5% to 5%.
Dividends paid more than doubled, from $0.50 billion in fiscal 2016 to $1.09 billion in fiscal 2025, while free cash flow grew from $0.74 billion to $1.82 billion.

Over the twelve months to June 28, 2026, its cash dividend payout ratio is a comfortable 50%.
Cocoa is the risk. The International segment swung to a $5.1 million loss in the second quarter, which the company puts down to higher raw material and manufacturing costs and more advertising.
So which dividend wins?
General Mills pays you more over the next 10 years. At each company’s 5-year rate, $10,000 in General Mills pays about $9,181 in all, against about $6,403 in Hershey. At each dividend’s pace now (General Mills up 1.7% in fiscal 2026, Hershey with no rise in fiscal 2025), it’s about $8,304 against $3,700.
The catch is that General Mills won’t be raising for a while. Net debt rose from 2.7x EBITDA in fiscal 2022 to 3.7x in fiscal 2026, above the company’s own 3x target…
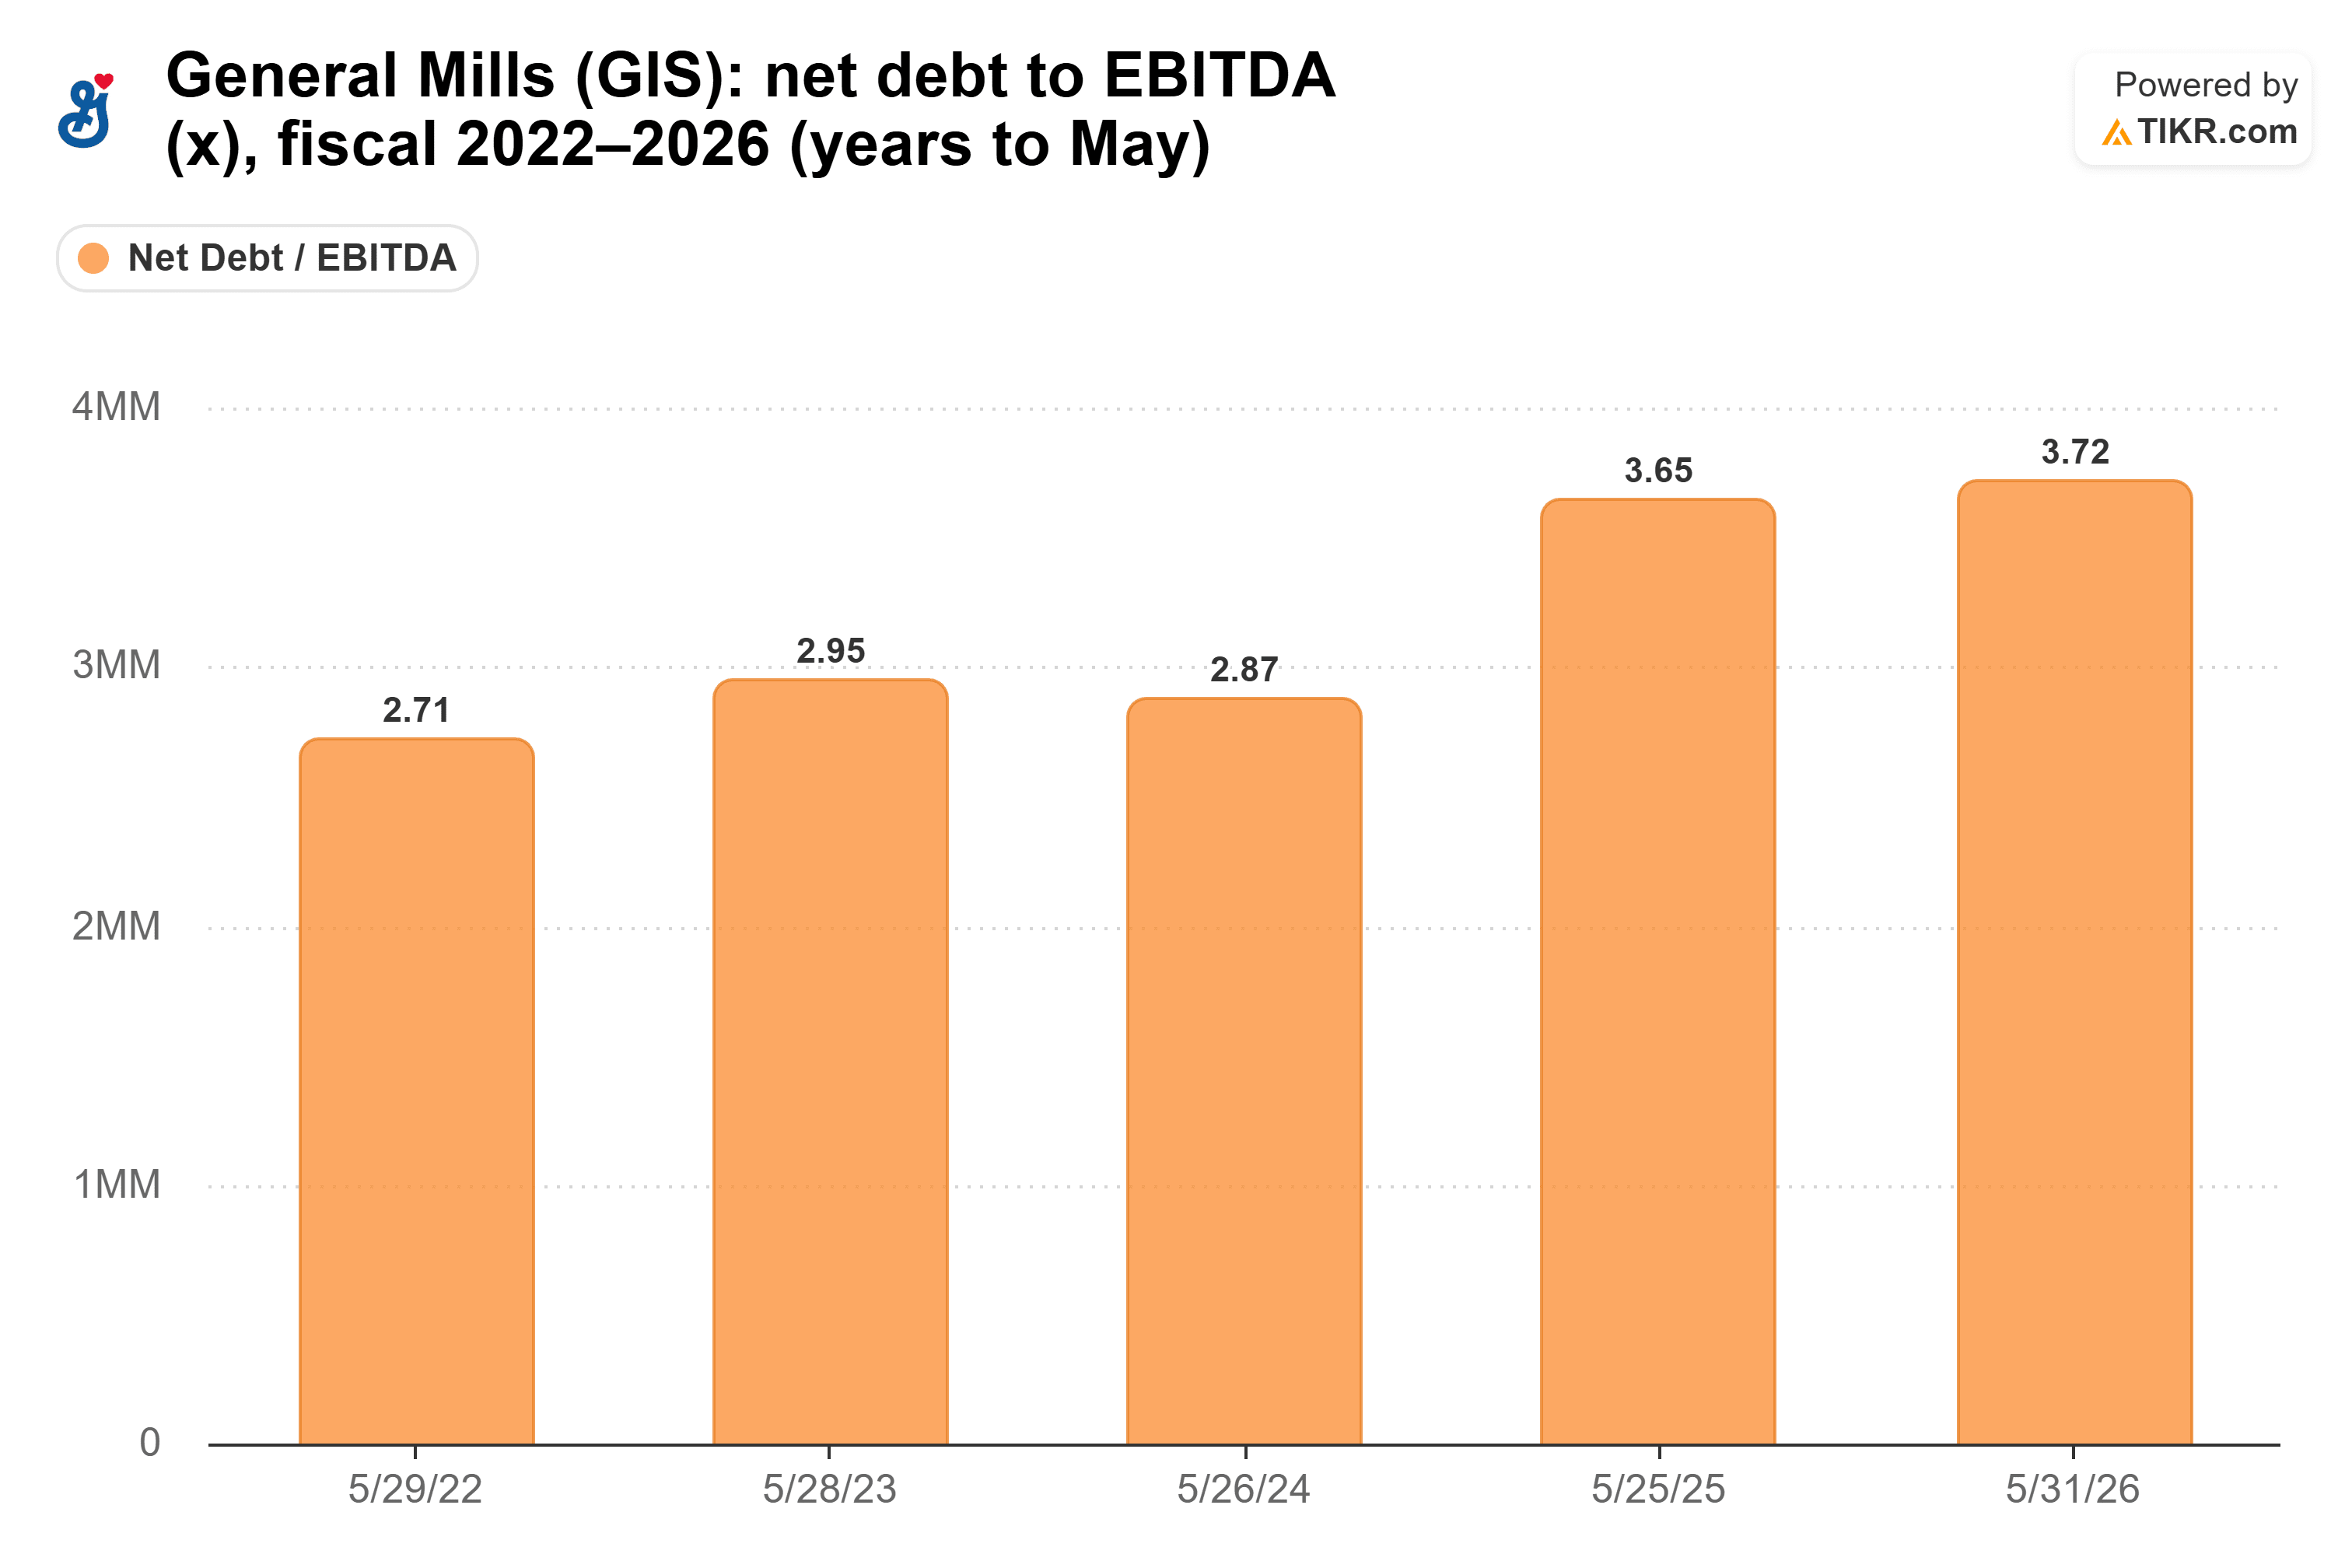
…and Bruce expects it to take “at least a couple of years to work ourselves back to our target of 3x net debt to EBITDA.”
The math still holds. If General Mills never raised its dividend again, $10,000 would pay $770 a year, or $7,700 over 10 years. That’s more than the $6,403 or so Hershey would pay growing 11.7% a year. Even at that pace, Hershey’s yearly income only passes General Mills’s around 2037.
That’s no knock on Hershey’s dividend. It’s covered twice over, Hershey carries half the leverage, its sales are growing, and its current rate of $5.81 a year is already above the $5.48 a share it paid in fiscal 2025. It’s just that a $770 head start against $370 is too much ground to make up in 10 years, and General Mills doesn’t need a single raise to win this one.
Of course, all of that rests on the dividend holding at $2.44 a year, so the thing to watch is whether General Mills’ $750 million in fiscal 2027 savings shows up in its cash flow.
So what is General Mills stock actually worth?
TIKR lets you forecast the future price of any stock in less than a minute. Just enter a few assumptions into TIKR’s valuation model and see what General Mills could be worth. Start from Wall Street consensus estimates, or adjust the inputs to reflect your own view of the business. It’s free to use.
Disclaimer:
Please note that the articles on TIKR are not intended to serve as investment or financial advice from TIKR or our content team, nor are they recommendations to buy or sell any stocks. We create our content based on TIKR Terminal’s investment data and analysts’ estimates. Our analysis might not include recent company news or important updates. TIKR has no position in any of the stocks mentioned. Thank you for reading, and happy investing!


