Key Stats for United Airlines Stock
- Current Price: $115.35
- Target Price (Mid): ~$118
- Street Target: ~$162
- Potential Total Return: ~2%
- Annualized IRR: ~0.4% / year
- Max Drawdown: 27.50% (March 30, 2026)
Now Live: Discover how much upside your favorite stocks could have using TIKR’s new Valuation Model (It’s free) >>>
What Happened?
United Airlines Holdings (UAL) raised its full-year 2026 adjusted earnings guidance to $9 to $11 a share, lifting the floor by $2 from the prior $7 to $11 range. It also guided third-quarter earnings to $2.50 to $3.50, a midpoint below most Street estimates. Results landed after the close on July 15, and shares fell 1.79% the following session. Second-quarter adjusted earnings of $1.99 beat the $1.85 consensus but fell from $3.87 a year earlier, and adjusted EBITDA of $1.74 billion missed the $1.79 billion estimate. At $115.35, the stock sits roughly 17% under the $138.77 high it set on June 30.
The guidance assumes an all-in fuel price of about $3.69 a gallon, drawn from the Gulf Coast jet fuel forward curve as of July 14. Realized Q2 fuel averaged $4.19. Management said results would exceed the high end of both the third-quarter and full-year ranges if fuel returns to early-July levels, which is a conditional, not a forecast.
Kirby Puts 90% of the Fare Increase on Costs Other Than Fuel
CEO Scott Kirby used the call to argue a specific breakdown of what is driving pricing, and it is worth reading as the CEO’s case rather than a neutral one. He attributed roughly 10% of the second-quarter price increase to slower capacity growth. The remaining 90% he assigned to cost inflation and cost harmonization: airport fees up by something like 60% since COVID, labor escalation, and maintenance he described as off the charts.
Because those costs hit every carrier identically, he expects four of the eight publicly traded U.S. commercial airlines will probably lose money this year. His supporting evidence was behavioral: “There was another fare increase this week as airfares — as fuel started to go back up, and there were no fare decreases when fuel went down.”
The distinction carries the thesis. Fares driven by fuel fall when fuel falls. Fares driven by a permanently reset cost base hold. Kirby noted fares remain 13% below pre-pandemic levels in real terms, implying the catch-up is unfinished.
Chief Commercial Officer Andrew Nocella supplied the demand evidence: total revenue per available seat mile rose 12.1%, contracted business revenue flown climbed 27%, cargo gained 22.6%, and consolidated fourth-quarter yield is tracking up 19% year over year against 5% for the third quarter at the equivalent point in the booking curve.

See historical and forward estimates for United Airlines stock (It’s free!) >>>
The Street Split $48 Apart on the Same Quarter
Analyst reaction scattered unusually widely. JPMorgan raised its target to $203 from $156 and kept an Overweight rating, Morgan Stanley moved to $190 from $185, and Goldman Sachs to $165 from $162. Going the other way, Jefferies cut to $155 from $160, and Susquehanna trimmed to $165 from $172. The raised full-year floor is the likeliest explanation for the split: analysts weighting the 2027 margin path moved up, while those weighting the near-term fuel line moved down.
Per TIKR’s Street Targets data as of July 23, the recommendation split stands at 19 Buys, 4 Outperforms, 2 Holds, 1 Underperform, and no Sells, with a high target of $205 and a low of $102. That $103 gap between the highest and lowest estimate is doing more work than the mean.
Two structural items drew less attention. CFO Michael Leskinen said the company raised $3.7 billion in new fixed-rate bank debt priced in the low 5% range, prepaid roughly $1 billion of higher-cost legacy debt, and expects net debt below two turns, calling an investment-grade rating “right on the precipice.” Separately, Nocella said the FAA extended flight caps at Chicago O’Hare and New York, holding United to roughly 650 daily O’Hare departures into 2027 and pushing growth toward larger aircraft rather than more flights.
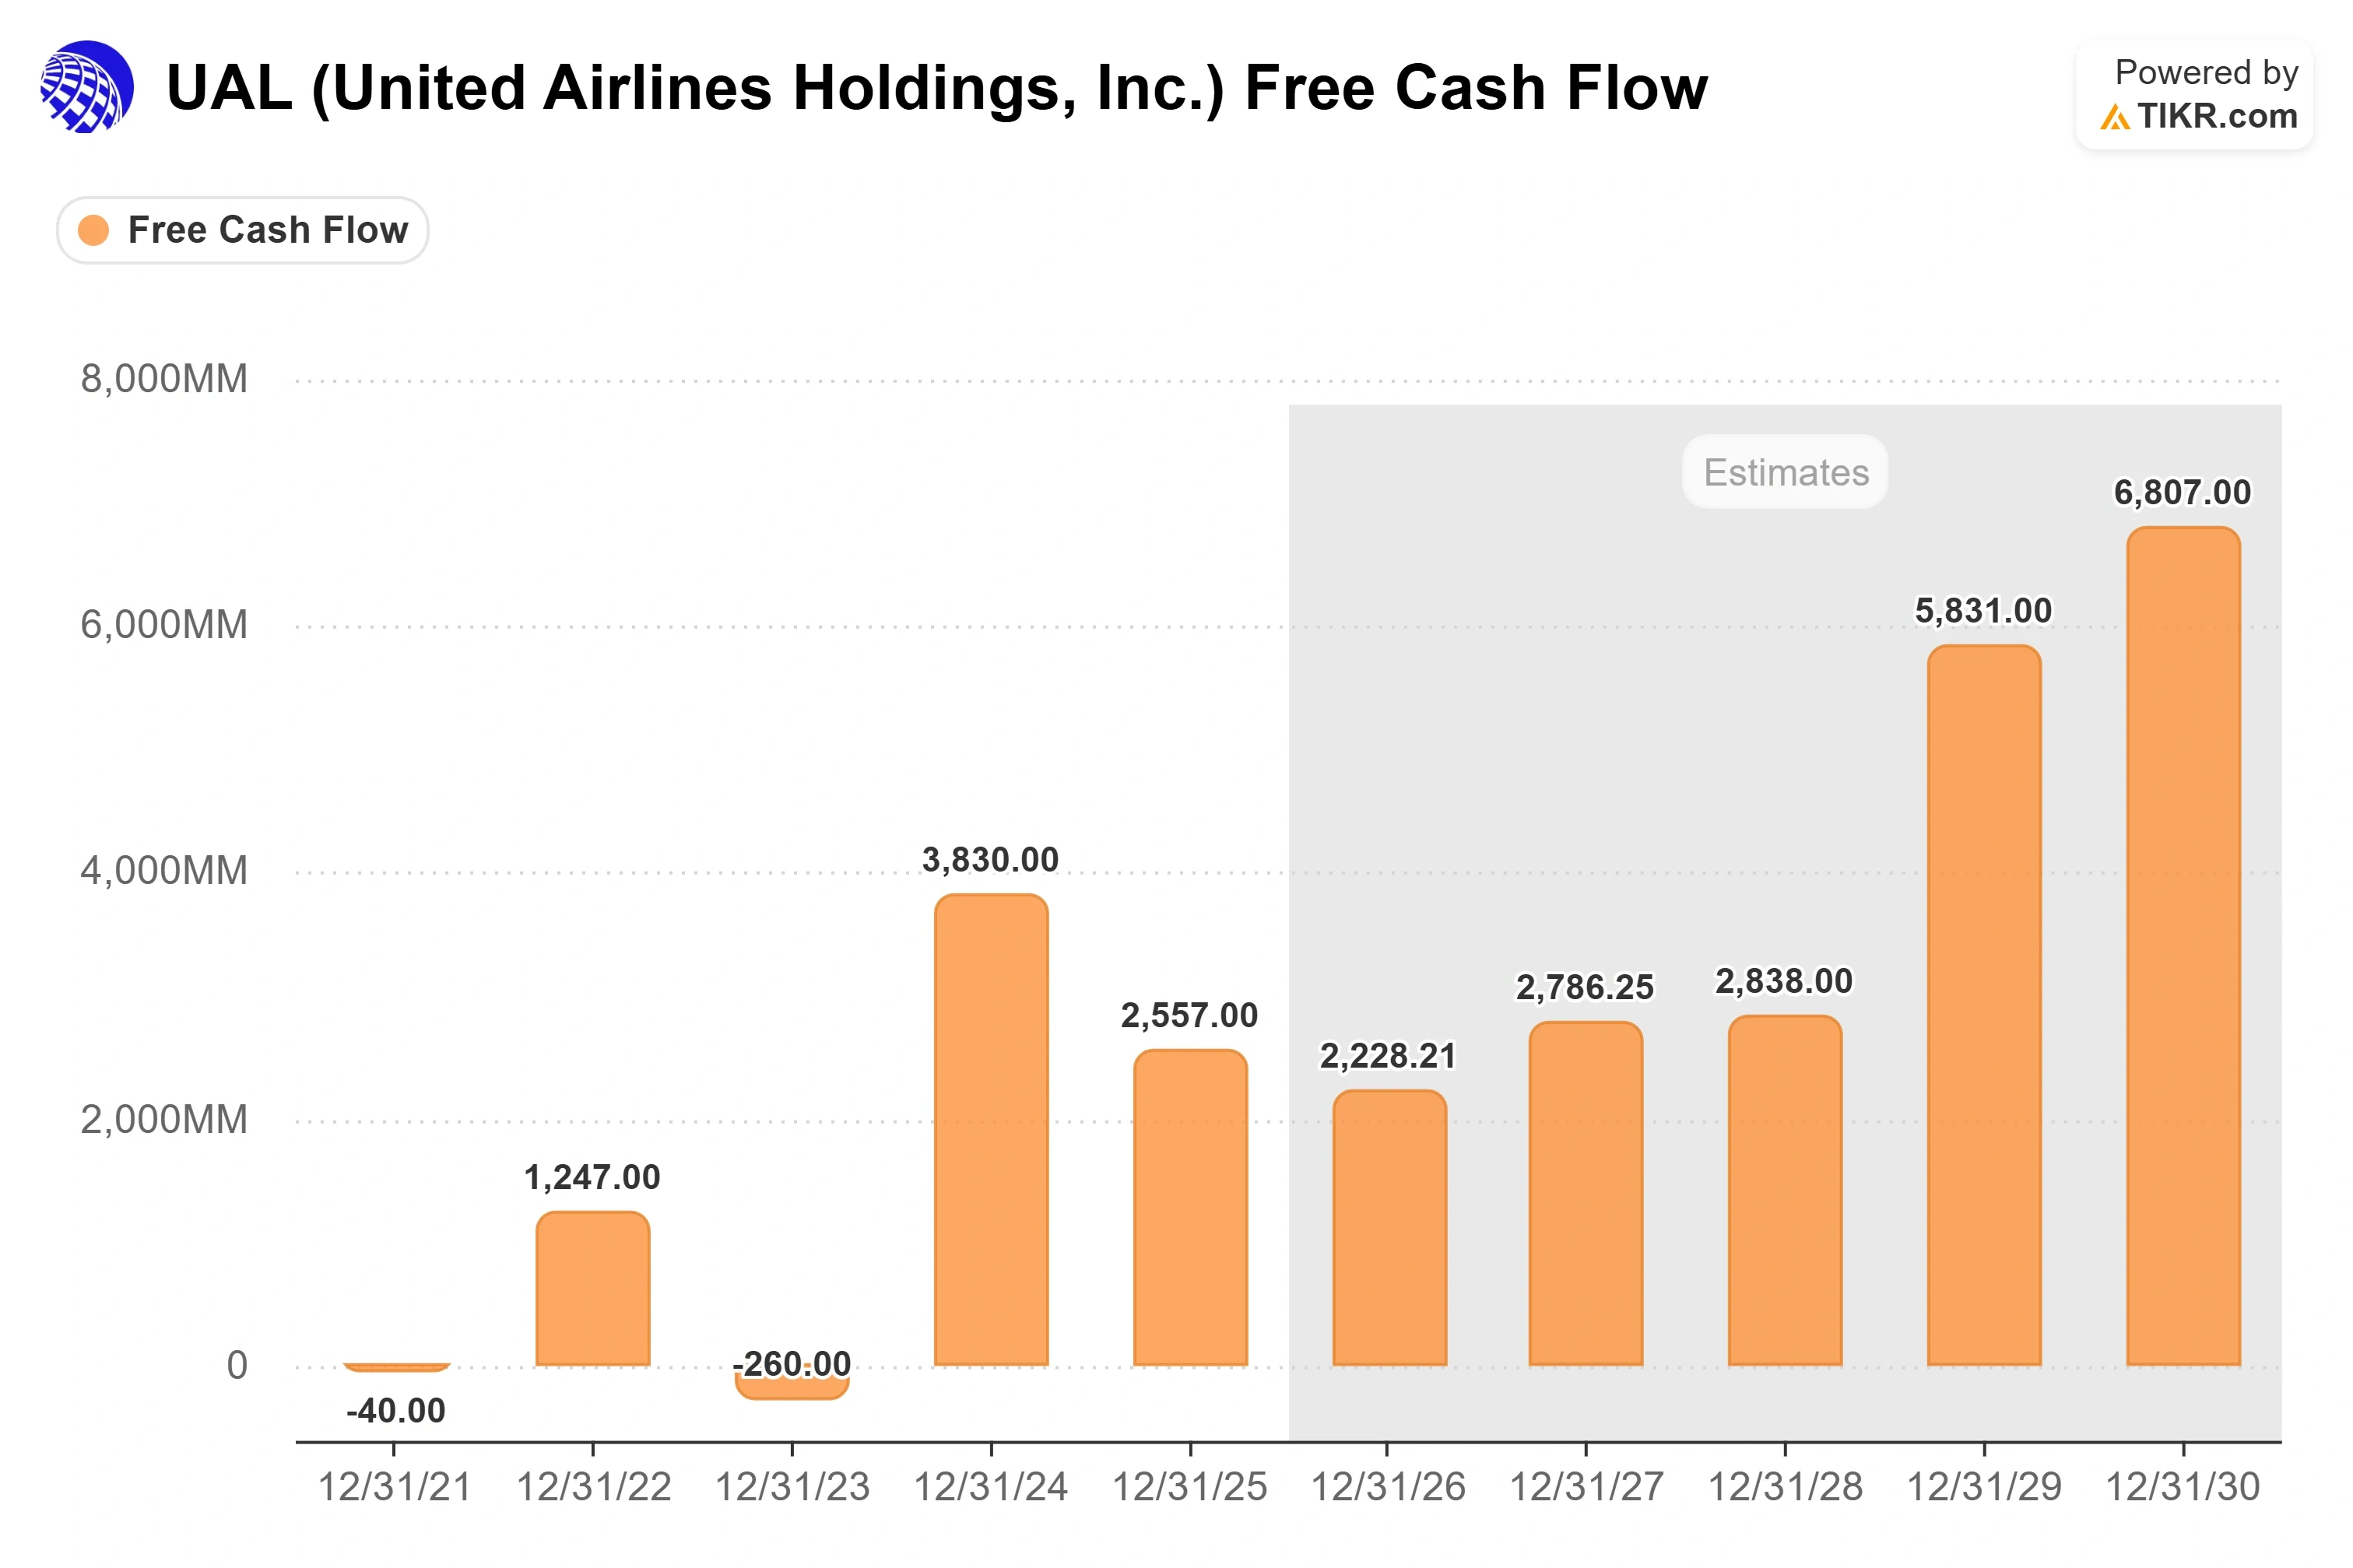
See how United Airlines performs against its peers in TIKR (It’s free!) >>>
TIKR Advanced Model Analysis
- Current Price: $115.35
- Target Price (Mid): ~$118
- Potential Total Return: ~2%
- Annualized IRR: ~0.4% / year

See analysts’ growth forecasts and price targets for United Airlines stock (It’s free!) >>>
Two assumptions do the work: revenue CAGR around 2%, and a P/E contracting about 3% a year from today’s 8.4x forward multiple. Net income margin still expands toward 7% on premium mix and the 2% to 3% CASM-ex target, but that cannot carry a stock when the multiple compresses against it.
The distance from the Street is worth naming rather than splitting. The model prices a mature airline growing near GDP with no re-rating; the Street prices the 2027 margin recovery arriving on schedule. Low case lands near $96, high case near $136.
Upside comes if margins reach management’s targets and the market pays more for earnings that held through a fuel shock. Downside is that oil stays elevated, the fare catch-up stalls, and 8x proves correct for a carrier carrying $17.0 billion in net debt.
Conclusion
United reports third-quarter results on October 14. Two numbers decide it, and neither is EPS.
First, fuel recapture: management committed to recovering 80% to 90% of the fuel increase in the third quarter. Second, whether unit revenue growth exceeds the second quarter’s 12.1%, which is what Kirby’s cost-harmonization argument requires if it holds. Clear both, and the guidance gap was a curve artifact. Miss recapture while unit revenue decelerates, and the 90% of pricing Kirby attributes to permanent cost inflation starts to look like the 10% he attributes to capacity.
See what stocks billionaire investors are buying so you can follow the smart money with TIKR.
Should You Invest in United Airlines?
The only way to really know is to look at the numbers yourself. TIKR gives you free access to the same institutional-quality financial data that professional analysts use to answer exactly that question.
Pull up United Airlines, and you’ll see years of historical financials, what Wall Street analysts expect for revenue and earnings in the quarters ahead, how valuation multiples have moved over time, and whether price targets are trending up or down.
You can build a free watchlist to track United Airlines alongside every other stock on your radar. No credit card required. Just the data you need to decide for yourself.
Analyze United Airlines on TIKR Free →
Looking for New Opportunities?
- See what stocks billionaire investors are buying so you can follow the smart money.
- Analyze stocks in as little as 5 minutes with TIKR’s all-in-one, easy-to-use platform.
- The more rocks you overturn… the more opportunities you’ll uncover. Search 100K+ global stocks, global top investor holdings, and more with TIKR.
Disclaimer:
Please note that the articles on TIKR are not intended to serve as investment or financial advice from TIKR or our content team, nor are they recommendations to buy or sell any stocks. We create our content based on TIKR Terminal’s investment data and analysts’ estimates. Our analysis might not include recent company news or important updates. TIKR has no position in any stocks mentioned. Thank you for reading, and happy investing!