Key Stats for American Airlines Stock
- Current Price: $13.56
- Target Price (Mid): ~$18
- Street Target: ~$20
- Potential Total Return: ~35%
- Annualized IRR: ~7% / year
- Max Drawdown: 37.39% (March 30, 2026)
Now Live: Discover how much upside your favorite stocks could have using TIKR’s new Valuation Model (It’s free) >>>
What Happened?
American Airlines Group (AAL) reported record second-quarter revenue of $16.735 billion on July 23, up 16.3% year over year. The stock closed down 8.35% at $13.56.
The number explaining that reaction never appeared in the press release. CFO Devon May told analysts that three weeks earlier, American expected to guide to full-year pretax earnings approaching $1.5 billion, roughly four times its 2025 pretax income. The fuel curve took it before the quarter was reported.
The Cost Line Is Repricing by the Week
Fuel expense rose more than $2.2 billion in the second quarter, an 83% increase year over year, as jet fuel prices roughly doubled following the closure of the Strait of Hormuz. Revenue recovered nearly half of it.
May’s detail on pace matters more than the magnitude. Since the beginning of July, the expected third-quarter fuel expense has risen by more than $700 million and by nearly $1.6 billion for the remainder of 2026. In the last week alone, the forecast moved another $230 million higher for the third quarter and nearly $550 million for the rest of the year.
That is a guidance range chasing a moving target. Full-year adjusted EPS now runs from a loss of $0.65 to a profit of $0.65, the second cut in three months, down from a loss of $0.40 to a profit of $1.10 in April. Third quarter guides to an adjusted loss of $0.70 to $0.10, against a Street expectation near $0.28 in profit reported by CNBC. American does not hedge fuel, and May said roughly 65% of supply comes from the Gulf. Delta and United shares fell alongside American on the print.
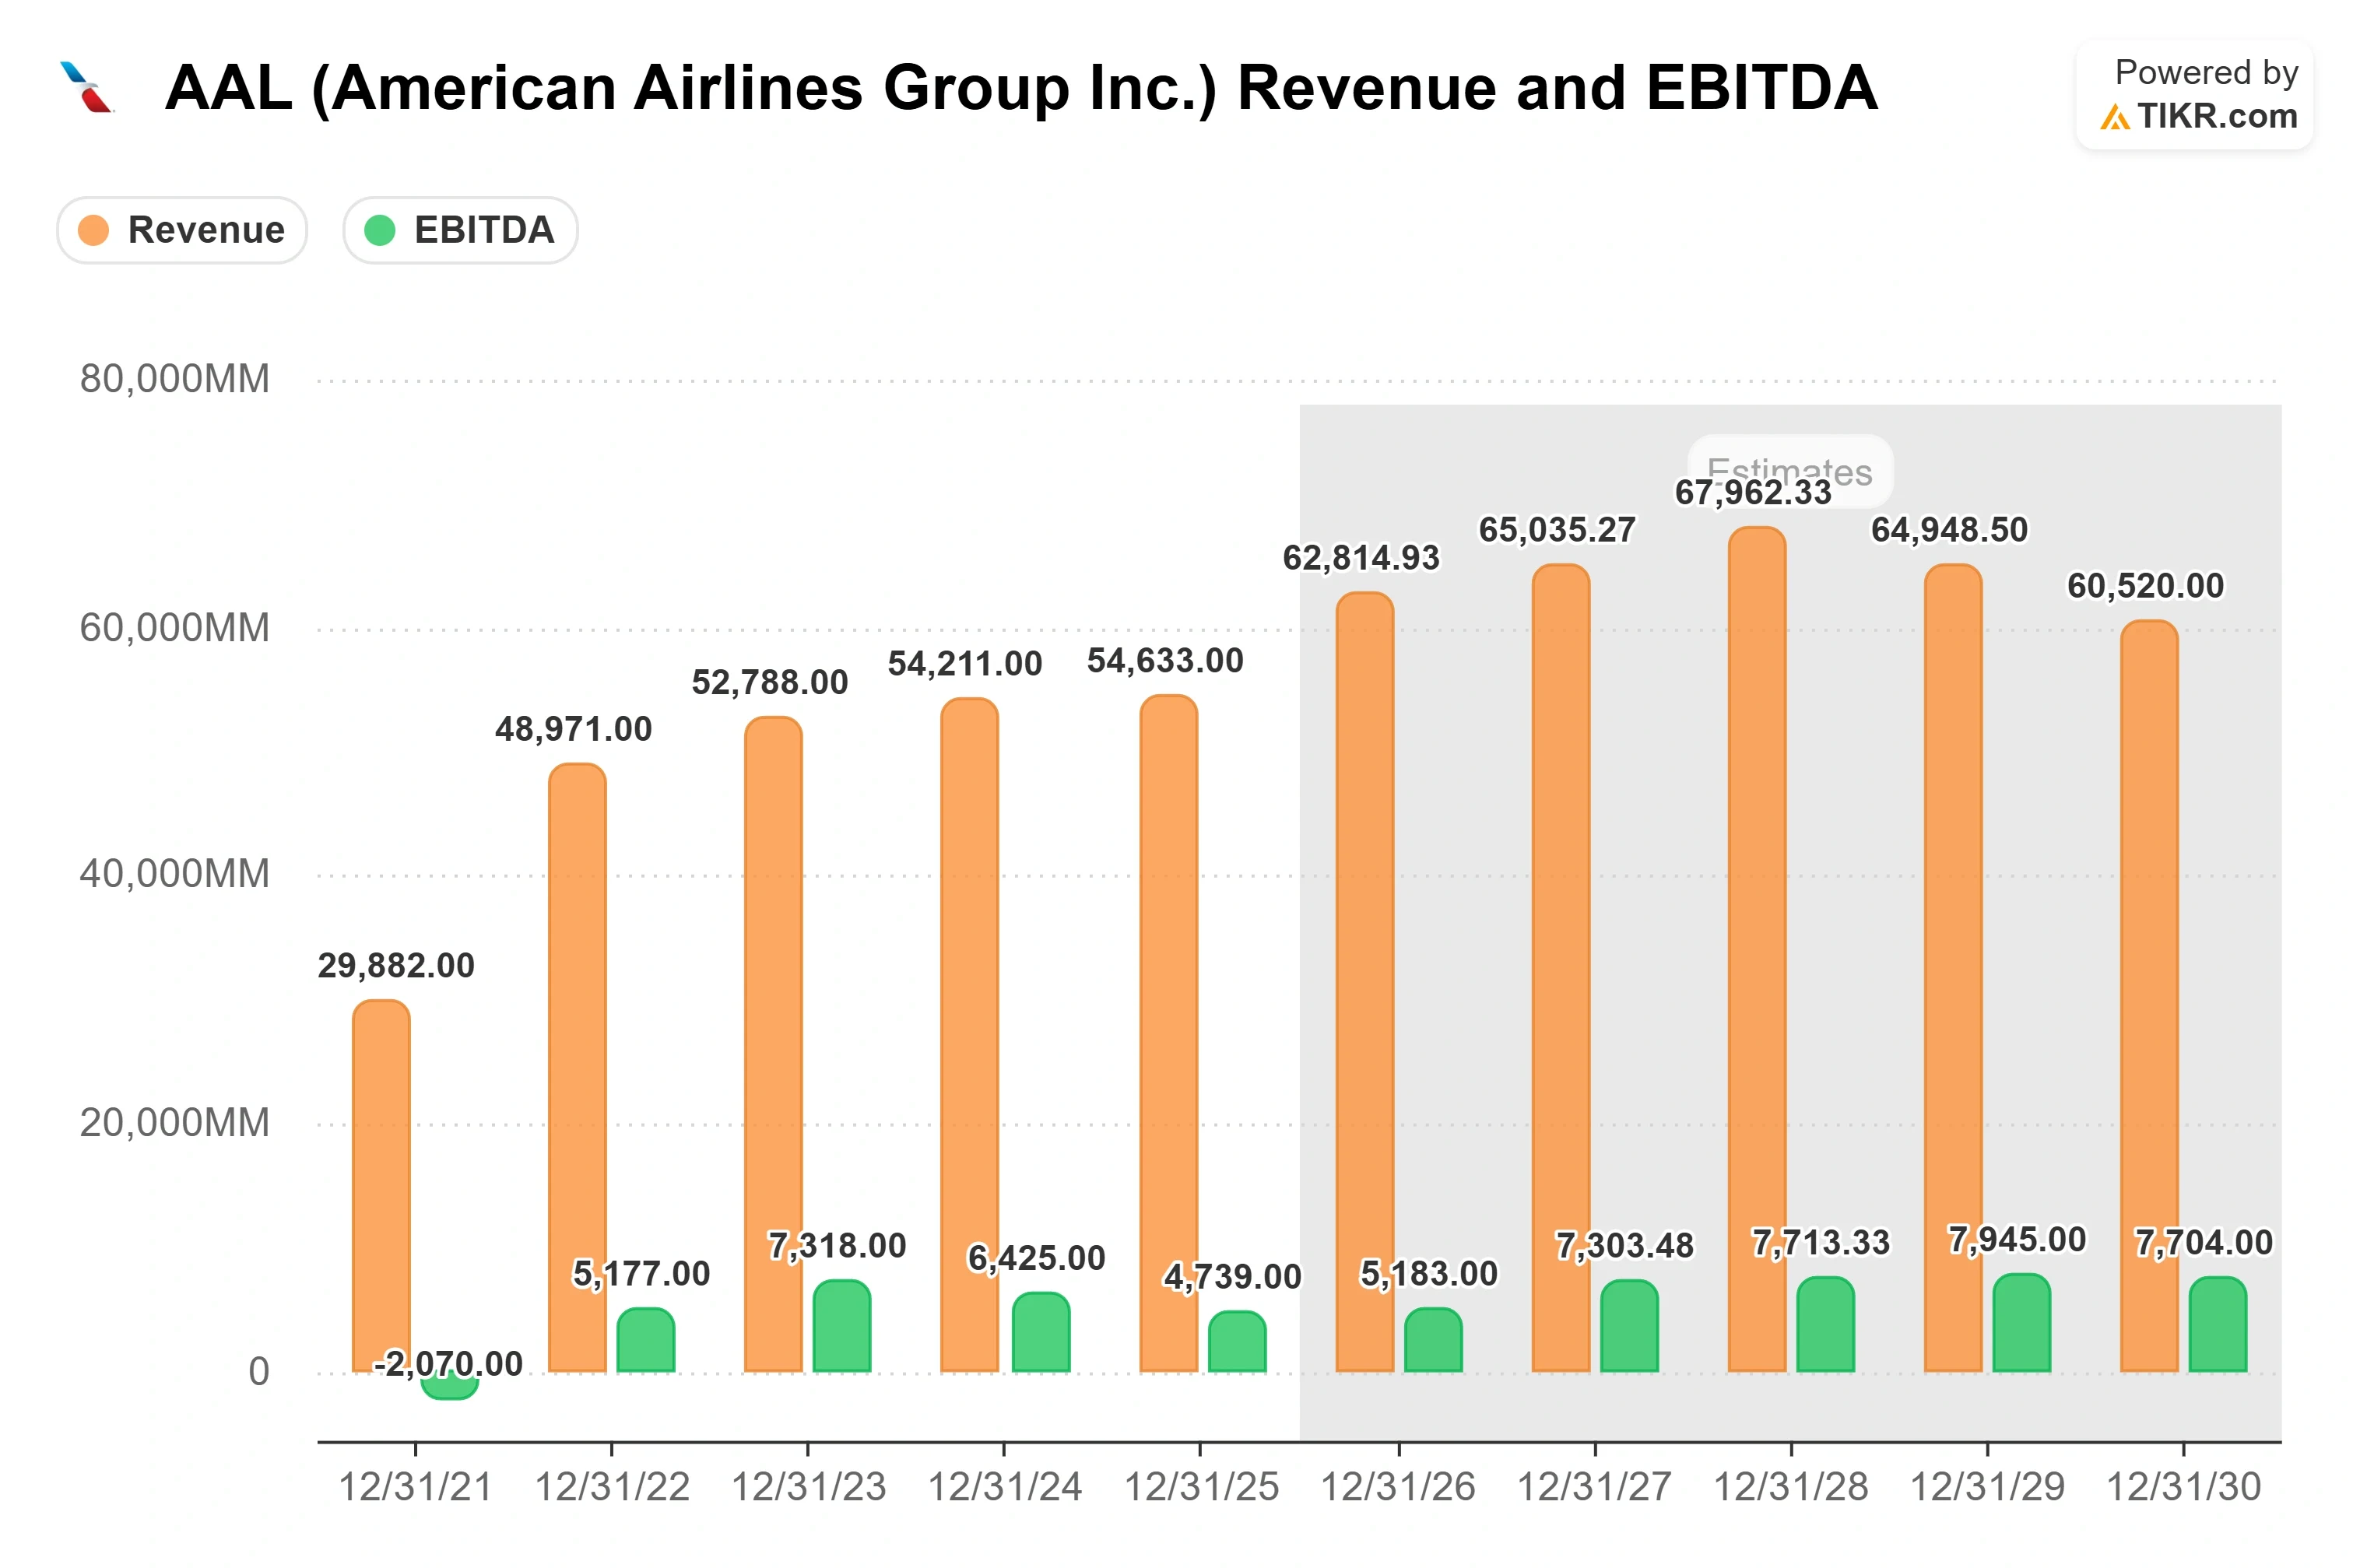
See historical and forward estimates for American Airlines stock (It’s free!) >>>
Analysts Are No Longer Asking About Fuel
The sharpest moment came first. Evercore ISI’s Duane Pfennigwerth put the buy side’s objection on the record: “The #1 question we hear from investors is why isn’t the low-margin producer cutting capacity? Why isn’t there a greater sense of urgency?”
Isom did not answer directly. He described the fuel volatility, noted the third-quarter adjustment already made, and said American is “matching our network, our capacity to the demand environment that’s out there.” Third-quarter capacity is still guided up 3% to 5%, roughly two points below the original plan, pushing CASMx to a guided increase of 2.5% to 4.5%.
Bernstein’s David Vernon pressed from another direction, asking whether the network should be as big as it is on a replacement-cost basis and whether trimming would free capital for balance sheet repair. Chief Commercial Officer Nathaniel Pieper said American is “being very targeted” and “selectively cutting as well,” citing optimization at Charlotte and a revised LaGuardia strategy.
JPMorgan’s Jamie Baker took on the labor thesis, saying he is “not seeing the sort of relative margin improvement at American that perhaps you were anticipating” after rivals harmonized flight attendant and mechanic contracts. Isom answered that competitors may have negotiated contracts they have not yet put in place, and that if those were in effect, investors would see meaningful closure in the margin gap. He declined to name the airlines.
The commercial results give management its case. Domestic unit revenue rose nearly 11%, Pacific 15%, and London 20%. Managed corporate revenue grew 26%, a fifth consecutive quarter of double-digit gains. Pieper said premium is roughly half of ticketed revenue on about 30% of seats, with nearly 60% of revenue from households earning $150,000 or more, and AAdvantage enrollments up 32%. Nonfuel unit cost growth stayed under 3%.
See how American Airlines performs against its peers in TIKR (It’s free!) >>>
TIKR Advanced Model Analysis
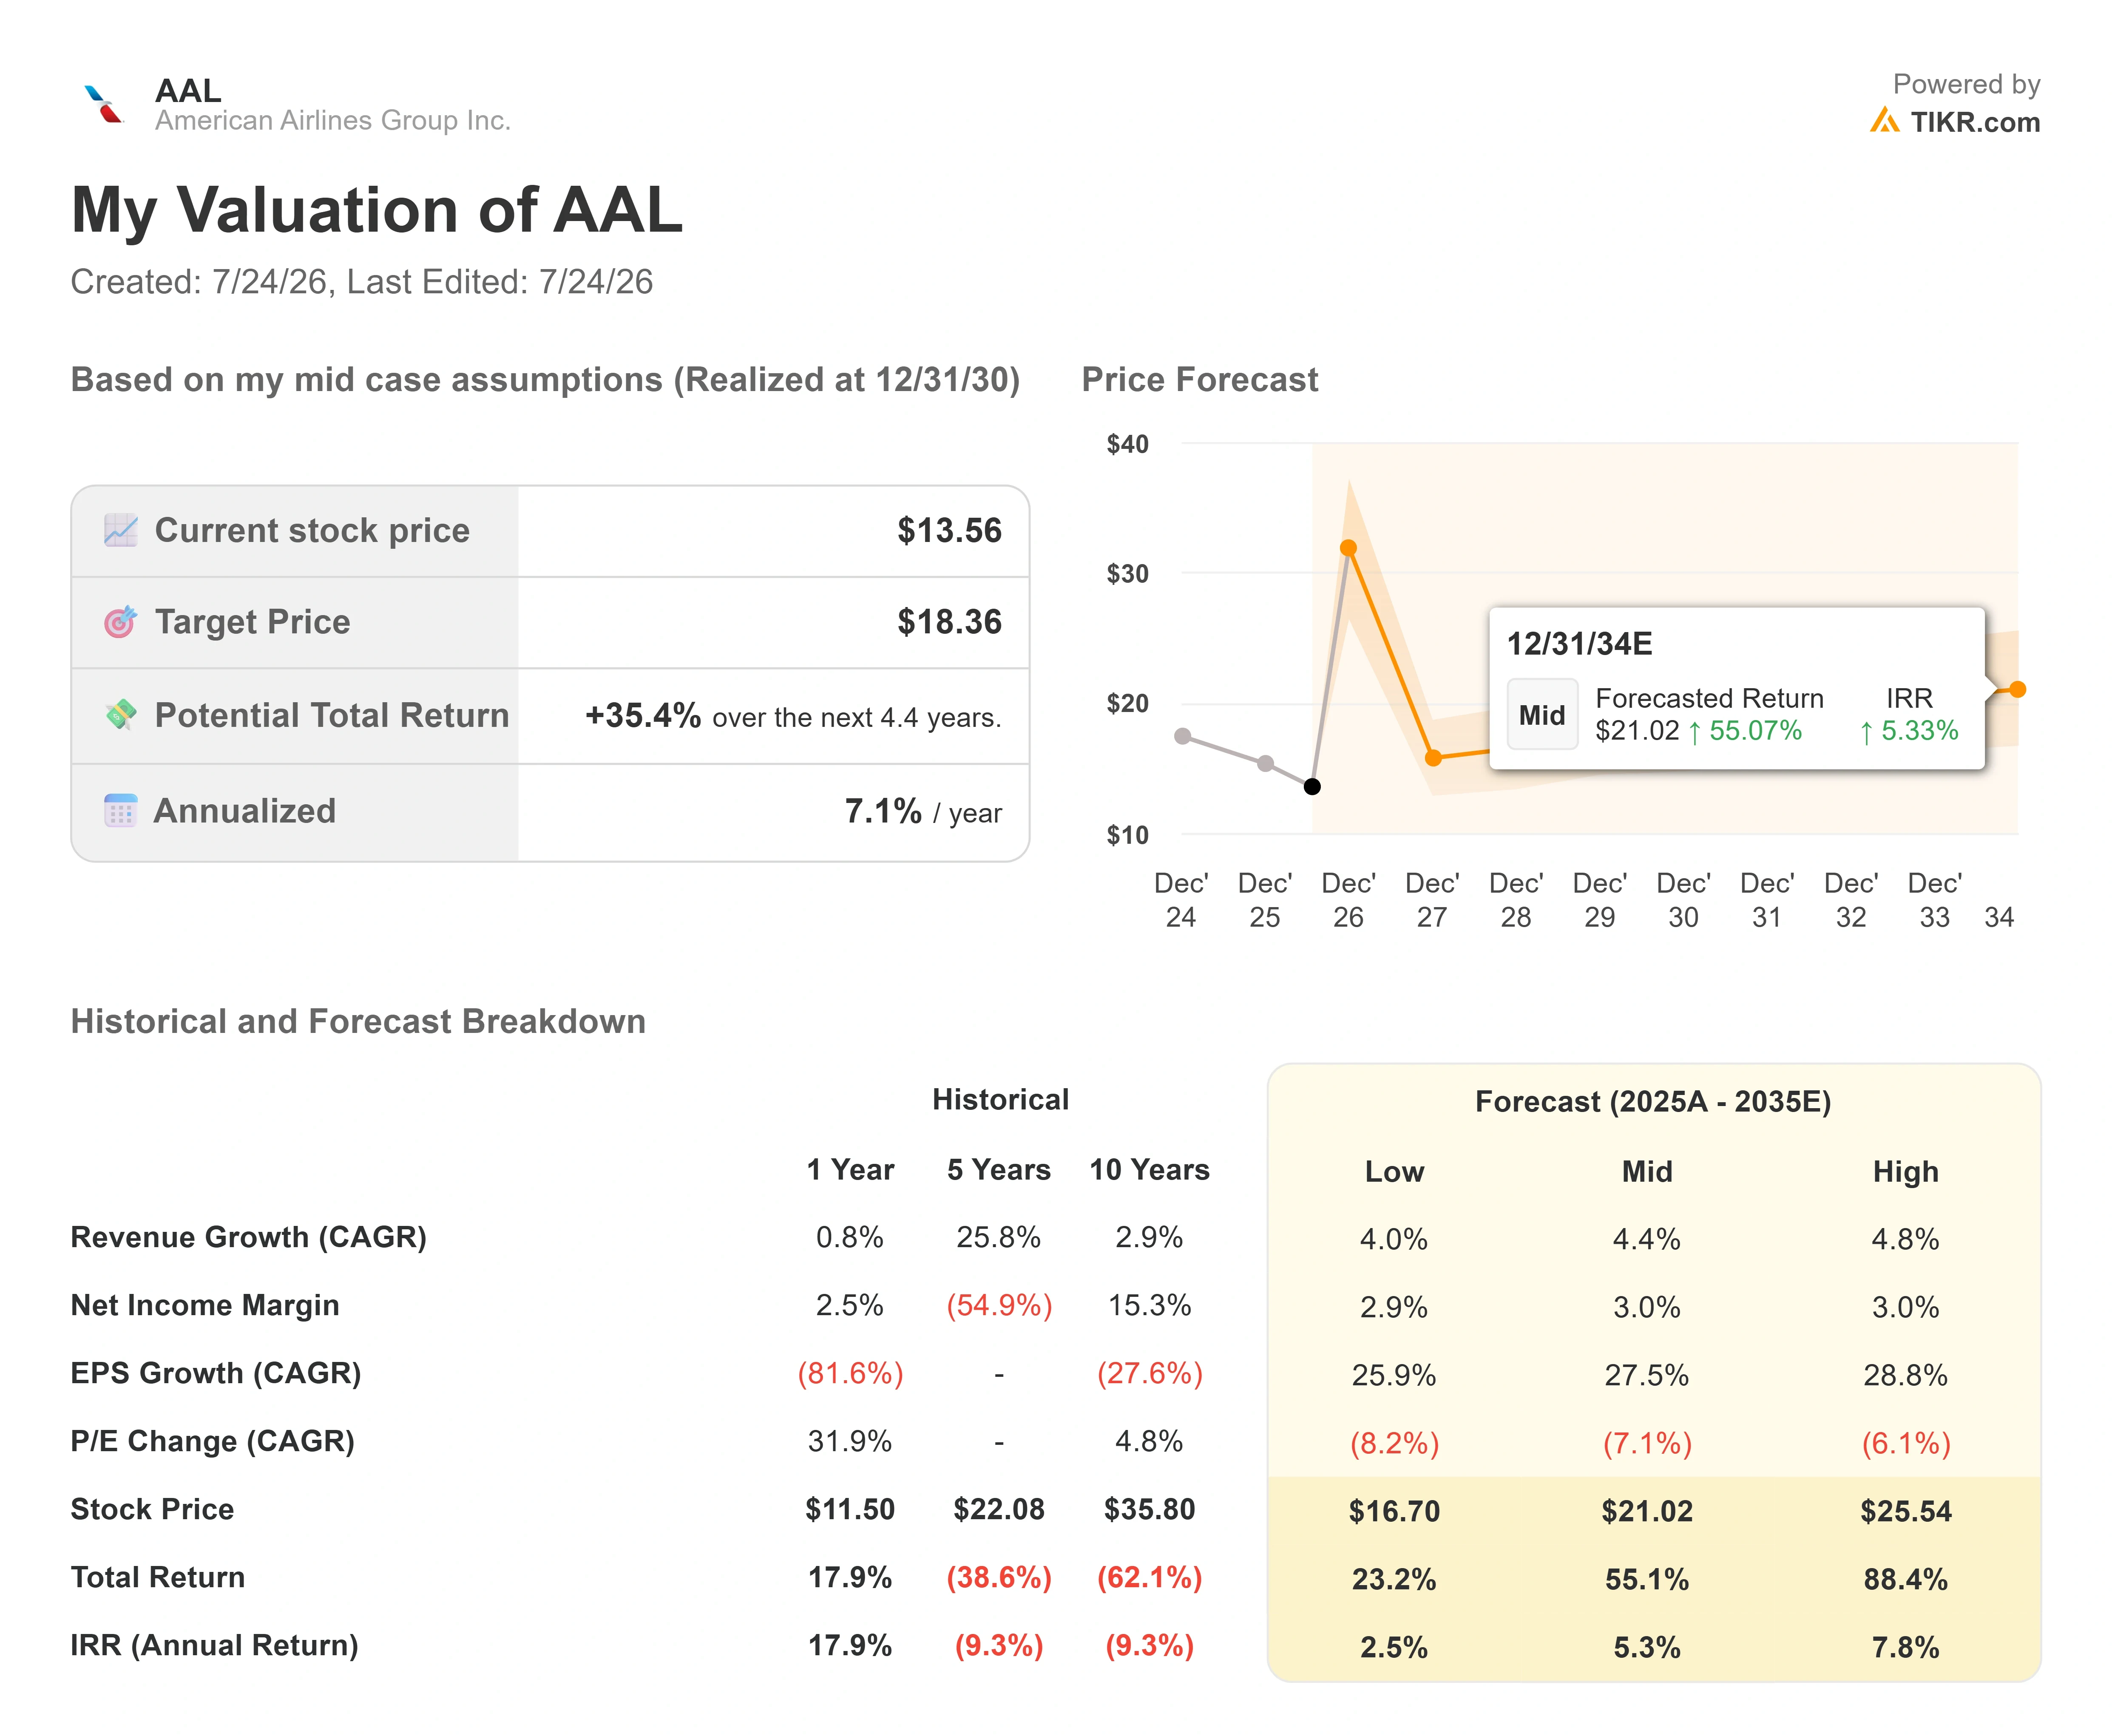
- Current Price: $13.56
- Target Price (Mid): ~$18
- Potential Total Return: ~35%
- Annualized IRR: ~7% / year
See analysts’ growth forecasts and price targets for American Airlines stock (It’s free!) >>>
Using the mid case, because the bull case requires assuming a commodity path that nobody can forecast. Over the model’s full 2025 to 2035 forecast window, it assumes revenue growth of around 4% annually, a net income margin of near 3%, and EPS growth of around 28% annually. The $18 target and ~35% return are realized at year-end 2030, roughly four and a half years out.
- Revenue driver 1: Premium mix, with premium seat growth of 5% this year against 3% non-premium
- Revenue driver 2: The Citi co-brand ramp, in year one of a ten-year agreement, card spend up 8%
- Margin driver: Nonfuel unit cost discipline, held under 3% growth
- Primary risk: The mid case embeds roughly 7% annual P/E compression, meaning it assumes the market pays less for these EPS over time
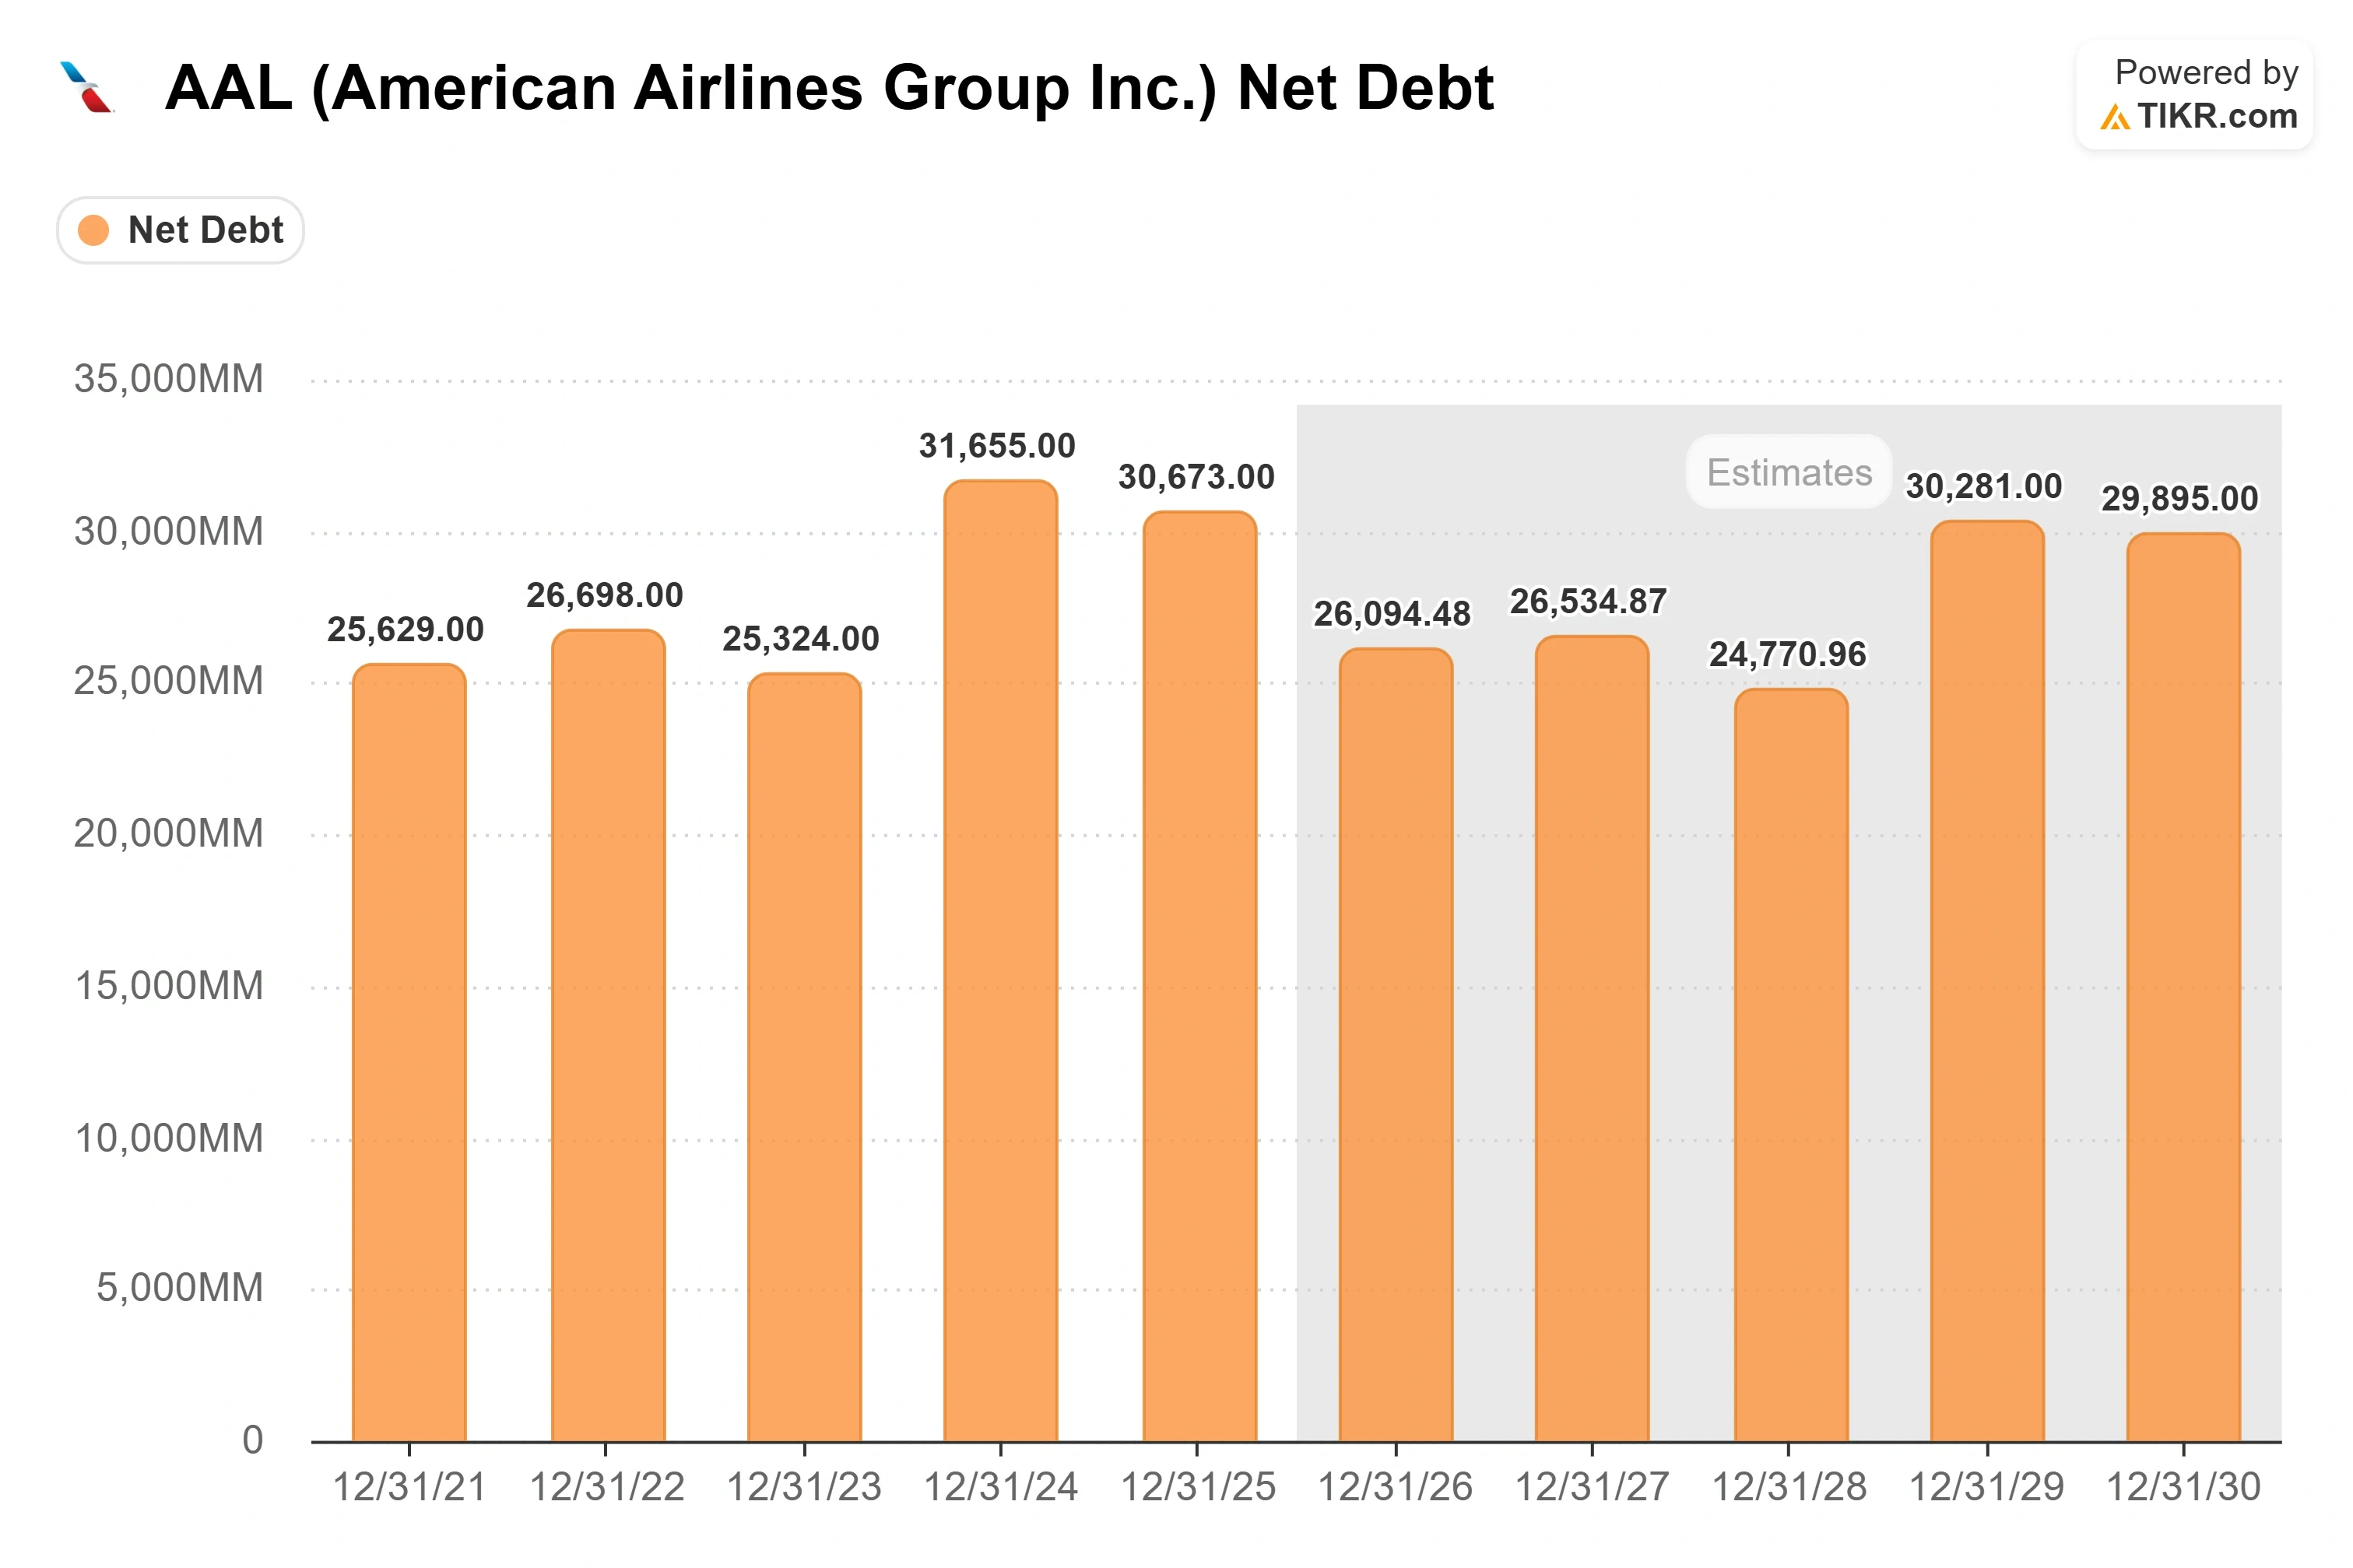
Upside: fuel normalizes, commercial gains reach the margin line, and leverage falls inside the three turns May said the BB rating goal requires, from 2.99x trailing today. Downside: at 5.34x NTM EV/EBITDA with $26.98 billion of net debt, a longer shock forces more financing, and the $1.3 billion raised in the second quarter suggests management is already positioned for that.
Conclusion
The third-quarter report, which American has not yet dated but which would typically land in late October, settles the argument. Management guided to revenue growth of 16% to 19% and said unit revenue should be stronger in the third and fourth quarters than in the second.
Good looks like an adjusted loss near the $0.10 end of guidance with unit revenue accelerating as promised. Bad looks like a loss near $0.70, or unit revenue decelerating, because that would mean fares have found a ceiling, fuel has not. Watch fourth-quarter capacity alongside it. Isom said the fourth quarter is under review. If it comes down materially, Pfennigwerth’s question was the right one.
See what stocks billionaire investors are buying so you can follow the smart money with TIKR.
Should You Invest in American Airlines?
The only way to really know is to look at the numbers yourself. TIKR gives you free access to the same institutional-quality financial data that professional analysts use to answer exactly that question.
Pull up American Airlines, and you’ll see years of historical financials, what Wall Street analysts expect for revenue and earnings in the quarters ahead, how valuation multiples have moved over time, and whether price targets are trending up or down.
You can build a free watchlist to track American Airlines alongside every other stock on your radar. No credit card required. Just the data you need to decide for yourself.
Analyze American Airlines on TIKR Free →
Looking for New Opportunities?
- See what stocks billionaire investors are buying so you can follow the smart money.
- Analyze stocks in as little as 5 minutes with TIKR’s all-in-one, easy-to-use platform.
- The more rocks you overturn… the more opportunities you’ll uncover. Search 100K+ global stocks, global top investor holdings, and more with TIKR.
Disclaimer:
Please note that the articles on TIKR are not intended to serve as investment or financial advice from TIKR or our content team, nor are they recommendations to buy or sell any stocks. We create our content based on TIKR Terminal’s investment data and analysts’ estimates. Our analysis might not include recent company news or important updates. TIKR has no position in any stocks mentioned. Thank you for reading, and happy investing!