Key Fundamental Metrics for ZG Stock
- 52-Week Range: $35.11 to $90.22
- Current Stock Price: $36.21
- Street Consensus Target Price: $64.78
- LTM Gross Profit Margin: 73.3%
- LTM Net Debt / EBITDA Leverage: -2.79x (Net Cash Position)
- Mid-Case 10-Year Forward Stock Price Target: $96.52
Value your favorite stocks like ZG with 5 years of analysts’ forecasts using TIKR’s new Valuation Model (It’s free) >>>
The Structural Reset: Scaling Pure-Play Software Revenue
Zillow Group, Inc. (ZG) has undergone a steep valuation reset, resulting in a negative 45.1% price return over the past year, settling at $36.21. Macroeconomic observers routinely distance themselves from digital housing portals during periods of high interest rates and suppressed transaction volume.
However, this cyclical anxiety overlooks Zillow’s radical corporate transformation away from capital-heavy property purchasing into an asset-light marketplace software ecosystem.

The evolution of their reported business segments proves the long-term benefit of this strategic reset. Total Segment Operating Revenue has steadily increased from $1.95 billion in 2023 to $2.24 billion in 2024, then topped out at $2.58 billion by the close of 2025. More importantly, the total segment operating income has turned structurally stable.
By phasing out the legacy, volatile “Homes” inventory segment, which generated massive operating losses, the core corporate layout now highlights its elite 73.3% gross profit margin, driven by premier agent advertising, mortgage integration, and digital rental transactions.
See historical and forward estimates for Zillow stock (It’s free!) >>>
Harvesting Cash Flow: The Structural Asset-Light Conversion Engine
Evaluating a premier technology platform requires assessing how efficiently top-line platform revenue converts into unencumbered liquid cash flow.
Because pure-play marketplace software models do not require physical property maintenance or inventory warehousing, upfront investment is limited to software engineering and brand marketing. When transaction volumes normalize, this operational setup will generate immense free cash flow.
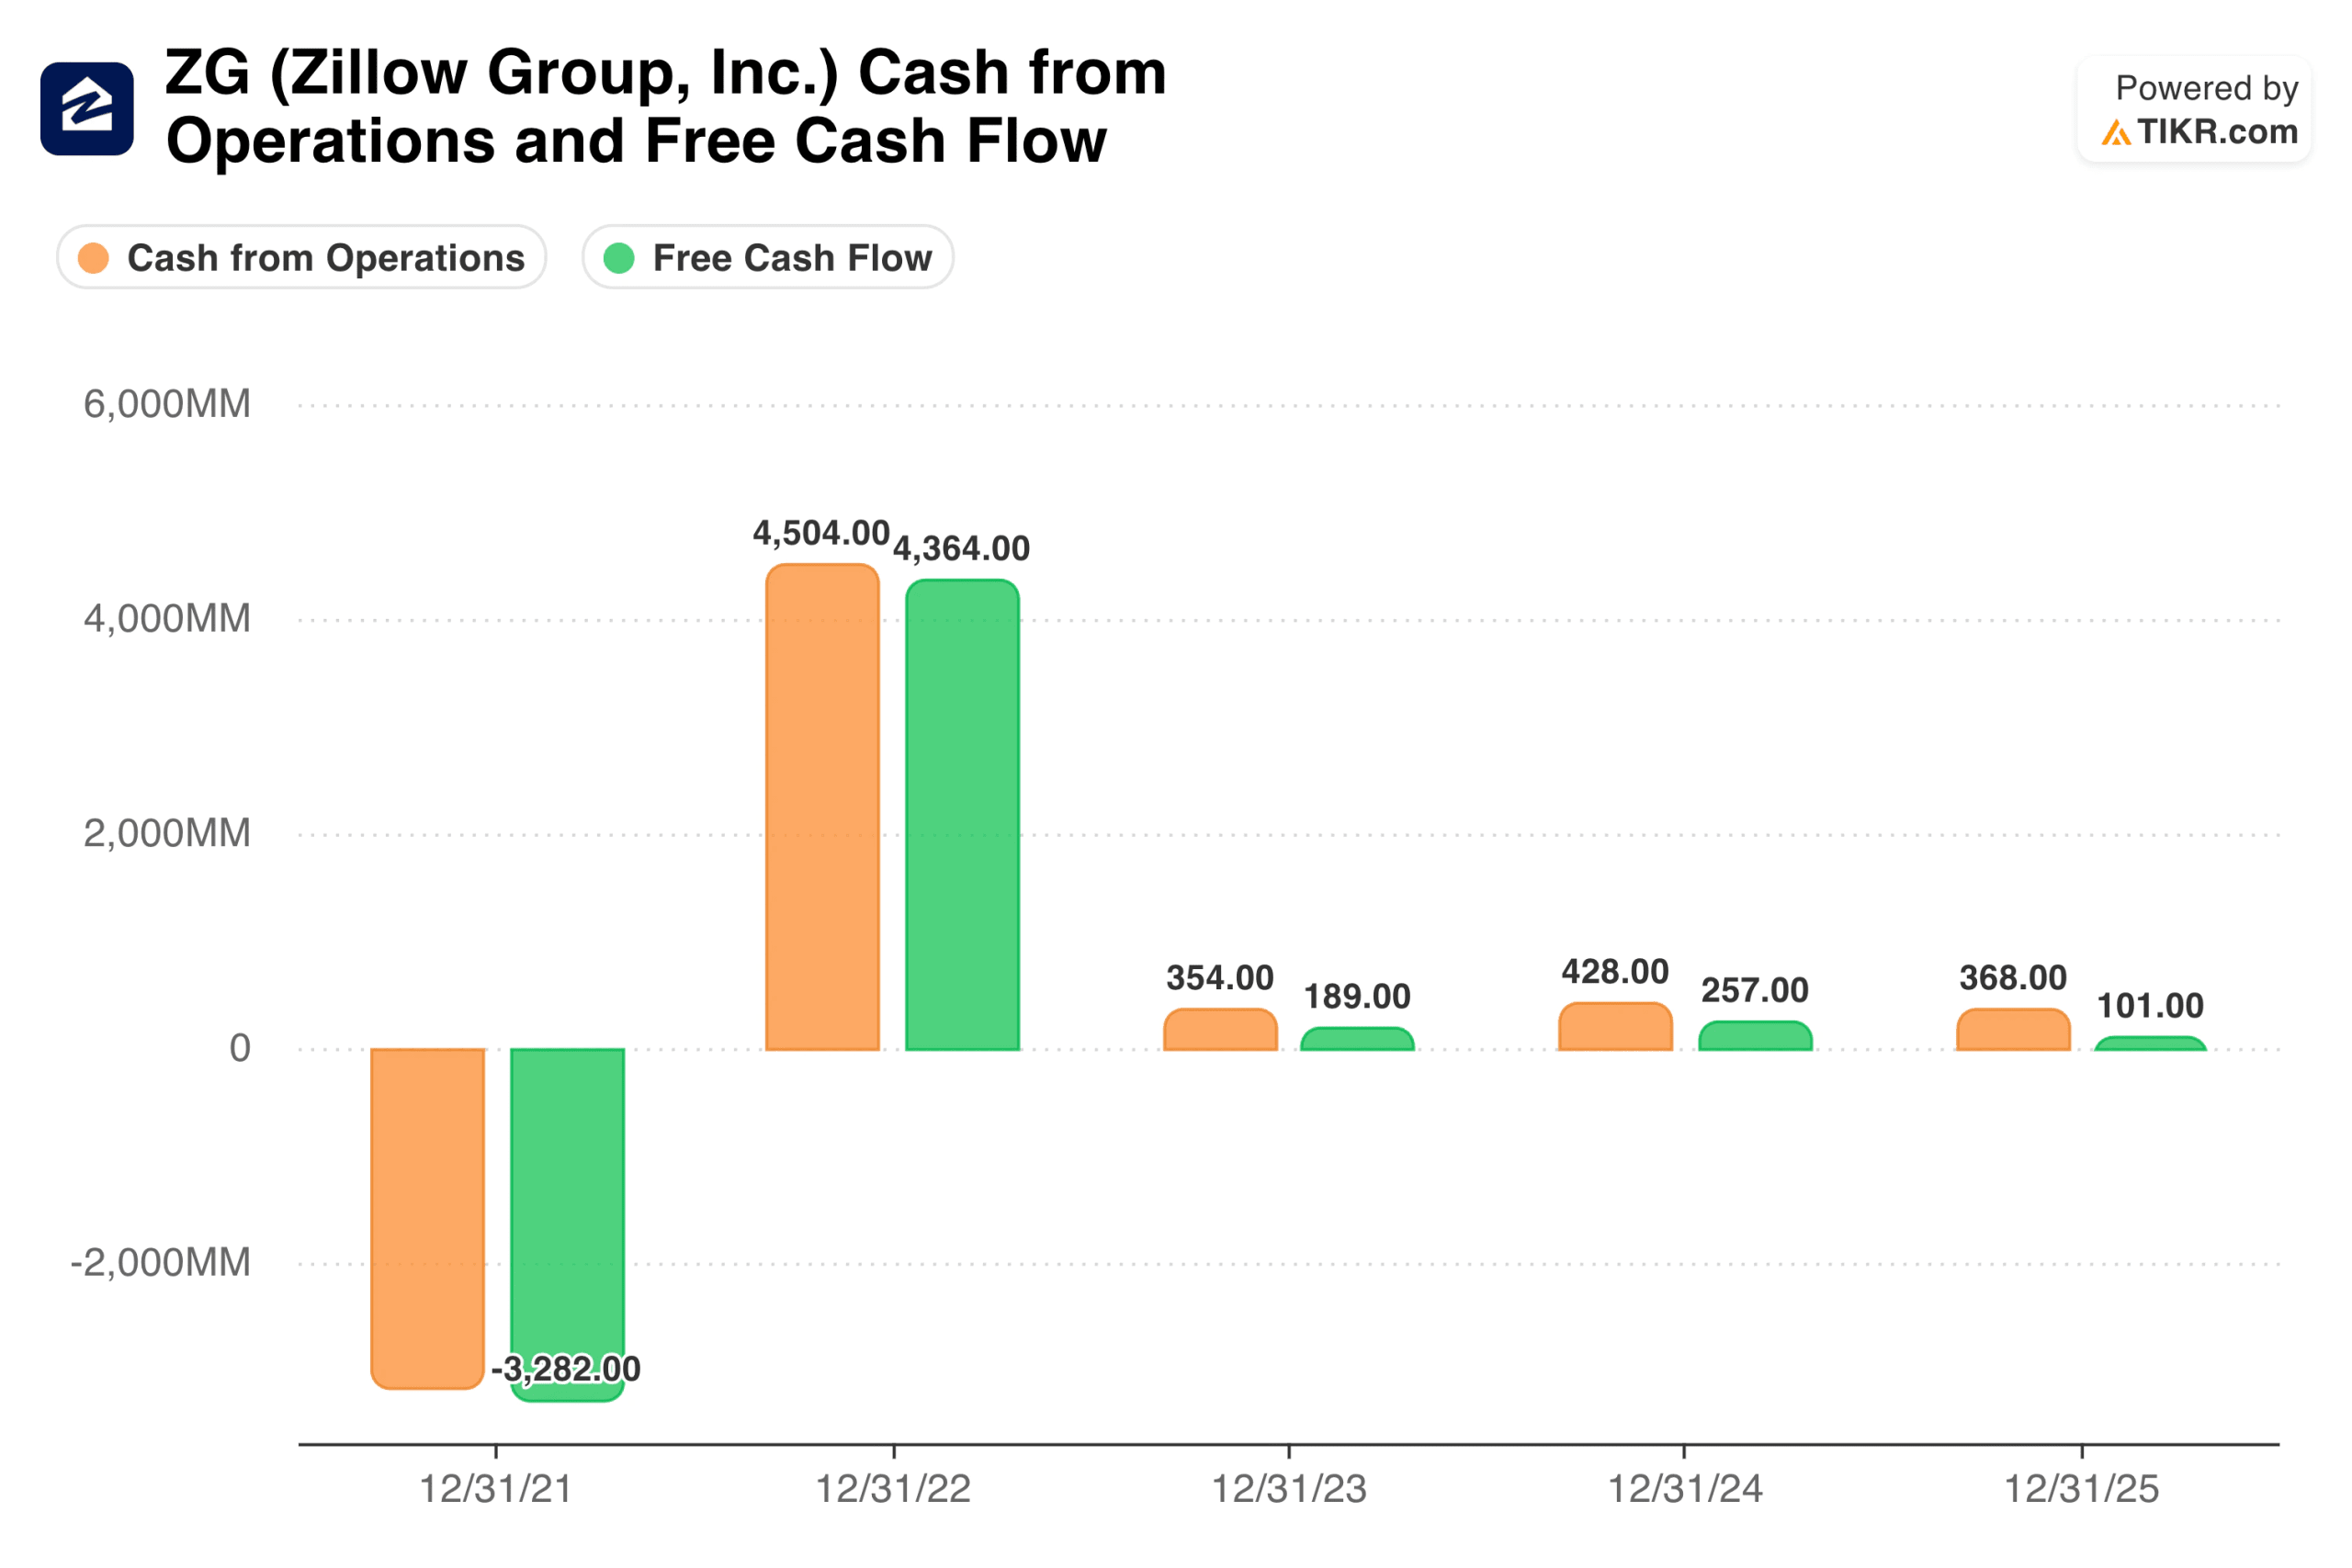
The historical trajectory of their capital generation highlights the absolute strength of this cash-flow engine. Following a pandemic-era inventory liquidation cash drain, Zillow successfully unlocked structural cash flows.
In late 2025, the company generated $0.37 billion in absolute cash from operations, converting that into a powerful $0.10 billion in pure free cash flow after capital expenditures. This self-funding framework provides management with an exceptional capital runway to compound market share without external financing pressures.
Review analysts’ growth forecasts and price targets for Zillow stock (It’s free!) >>>
Balance Sheet Fortress Architecture and Valuation Compression
The core pillar supporting Zillow’s long-term runway is its defensive capital structure. While brick-and-mortar real estate operators are weighed down by crushing debt service costs, Zillow functions with a net cash surplus.
The business carries a negative LTM net debt balance of $366.00 million, resulting in an exceptional net debt-to-EBITDA leverage multiple of-2.79x, based on an optimized 228.80 million-share base.
This cash reserve enables management to comfortably weather housing volume contractions. At the current price, the equity markets trade Zillow at a highly compressed NTM enterprise value-to-EBITDA multiple of 9.78x and a competitive NTM price-to-free cash flow multiple of 12.86x.
This valuation layout demonstrates that public-market equity pricing heavily discounts Zillow’s multi-segment monopoly positioning, valuing the enterprise as a cyclical broker rather than a high-margin transaction utility.
Unlocking Value: What the TIKR Forecast Breakdown Implies
Shifting focus to multi-year performance targets, the forward valuation architecture establishes an exceptional distribution of performance probabilities for long-term compounders. Reviewing the historical 5-year revenue contraction of negative 5.0% isolates the legacy drag of their discontinued property inventory operations.
Under the forward mid-case forecasting parameters, organic revenue growth is modeled to settle at a normalized compound annual rate of 13.5% over the coming decade, with terminal net income margins expanding to a robust 16.4%.

These baseline parameters translate into highly visible asset targets. The model illustrates that even if revenue expansion slows to a conservative low-case scenario of 12.1% through 2034, the software cash machine establishes a reliable $71.38 stock price floor.
By protecting structural operating results from housing supply shocks, the forecasting framework projects a mid-case terminal stock price target of $96.52 by late 2034, delivering an aggregate 166.6% cumulative return.
Is ZG Worth Buying at Today’s Levels?
At the current price of $36.21, the TIKR forward valuation model establishes a high-conviction, asymmetric entry point for technology allocators. Under the mid-case forecasting track, achieving a fair value target price of $65.76 by December 2030 yields a strong 13.8% annualized internal rate of return over the next 4.6 years, progressing smoothly toward a long-term 10-year annualized return of 12.1% by late 2034. This trajectory is driven by an expected 15.0% compound annual growth rate for EPS.
Importantly, the conservative low-case settings reveal immense structural safety, projecting an 8.2% annualized return even if multiple expansion remains completely absent over the forward horizon.
This limited return variance illustrates a massive cash-backed margin of safety, trading near the absolute floor of its 52-week range of $35.11 to $90.22, while offering a steep discount to the consensus Street price target of $64.78. For disciplined allocators looking to capture the definitive housing super app at a deep discount, initiating a core position at today’s price is an outstanding strategic move.
Wall Street’s best ideas don’t stay hidden for long. Catch analyst upgrades, earnings beats, and revenue surprises on thousands of stocks the moment they happen with TIKR for free →
Looking for New Opportunities?
- See what stocks billionaire investors are buying so you can follow the smart money.
- Analyze stocks in as little as 5 minutes with TIKR’s all-in-one, easy-to-use platform.
- The more rocks you overturn… the more opportunities you’ll uncover. Search 100K+ global stocks, global top investor holdings, and more with TIKR.
Disclaimer:
Please note that the articles on TIKR are not intended to serve as investment or financial advice from TIKR or our content team, nor are they recommendations to buy or sell any stocks. We create our content based on TIKR Terminal’s investment data and analysts’ estimates. Our analysis might not include recent company news or important updates. TIKR has no position in any stocks mentioned. Thank you for reading, and happy investing!