


Key Fundamental Metrics for ALG Stock
- 52-Week Range: $145.76 to $233.29
- Current Stock Price: $150.02
- Street Mean Target Price: $209.80
- LTM Gross Profit Margin: 24.5%
- LTM Net Debt / EBITDA Leverage: 0.52x
- Mid-Case 10-Year Terminal Stock Price: $219.79
Now Live: Discover how much upside your favorite stocks could have using TIKR’s new Valuation Model (It’s free)>>>
Tracking Revenue Resilience Through the Industrial Equipment Shift
Alamo Group, Inc. (ALG) has pushed through a meaningful equity valuation correction, logging a negative 24.5% price return over the past year to trade at $150.02. General industrial sector allocators frequently step away from specialized heavy machinery providers during shifts in the broader agricultural economy and temporary pauses in municipal equipment purchasing timelines.
However, this near-term caution overlooks Alamo’s structural role inside non-discretionary public works, roadside clearing, and infrastructure management pipelines.

The underlying corporate segments reveal a massive long-term revenue scaling trend. Total revenues expanded smoothly from $972.18 million in 2021 to a record $2.02 billion by the end of 2025. Over this identical duration, reported operating margins moved through a cyclical bottom of negative 12.7% in 2022 due to severe supply chain disruptions, before stepping up sequentially to steady at a positive 4.4% in late 2025.
This top-line progression reflects a deliberate corporate transition away from low-margin product lines in favor of high-retention infrastructure tooling.
See analysts’ growth forecasts and price targets for Alamo Group stock (It’s free!) >>>
Optimizing Factory Floors: The Structural Asset Turnover Recovery
Evaluating a heavy industrial operator requires reviewing how effectively corporate assets can be reorganized during temporary macroeconomic transition periods.
Because manufacturing setups incur substantial upfront outlays for raw steel supply, factory floor machinery, and physical warehouse infrastructure, managing asset efficiency is the true baseline for long-term compounding. When procurement and operational lines are streamlined, absolute utilization rebounds sharply.

The historical trajectory of their structural asset efficiency demonstrates a clear cyclical stabilization. Consolidated asset turnover hit a peak of 1.20x in 2023 as product backlogs cleared out, before gently cooling to settle at a stable 1.00x baseline footprint by late 2025.
This active inventory stabilization proves that their current facility consolidation initiatives are successfully reducing structural waste, clearing bottlenecked assembly floors, and optimizing factory-floor throughput to protect capital efficiency.
See the exact moment Wall Street upgrades a stock before the rest of the market piles in — track analyst rating changes in real time with TIKR for free →
The Strategic Balance Sheet Flywheel and Historical Multiple Deflation
The fundamental core behind Alamo Group’s long-term outperformance rests on its pristine balance sheet design. Unlike heavily leveraged industrial suppliers that are forced to dilute shareholders or stop product development when end markets soften, Alamo protects its options by keeping a very tight lid on liabilities.
The company carries an investment-grade net debt stack of $112.52 million, translating into a safe 0.52x net debt-to-EBITDA leverage profile off an optimized 12.17 million outstanding share base.
This financial flexibility directly insulates funds from their highly successful roll-up acquisition model, supporting their 9.9% LTM return on invested capital and safely covering their steady 14.7% dividend payout ratio.

Shifting focus to historical valuation multiples, the forward NTM Total Enterprise Value to EBITDA multiple currently sits at a compressed 7.81x. This 7.81x print sits well below its historic five-year cyclical mean of 10.07x and near its absolute trailing low of 7.67x, indicating that the market has fully priced in the cyclical downturn.
Unlocking Value: What the TIKR Forecast Breakdown Implies
Moving past short-term operational periods, the forward valuation architecture isolates a remarkably consistent performance expectation for equity allocators. Reviewing the historical 10-year total return of 145.9% demonstrates how reliably this niche equipment catalog compounds over full economic cycles.
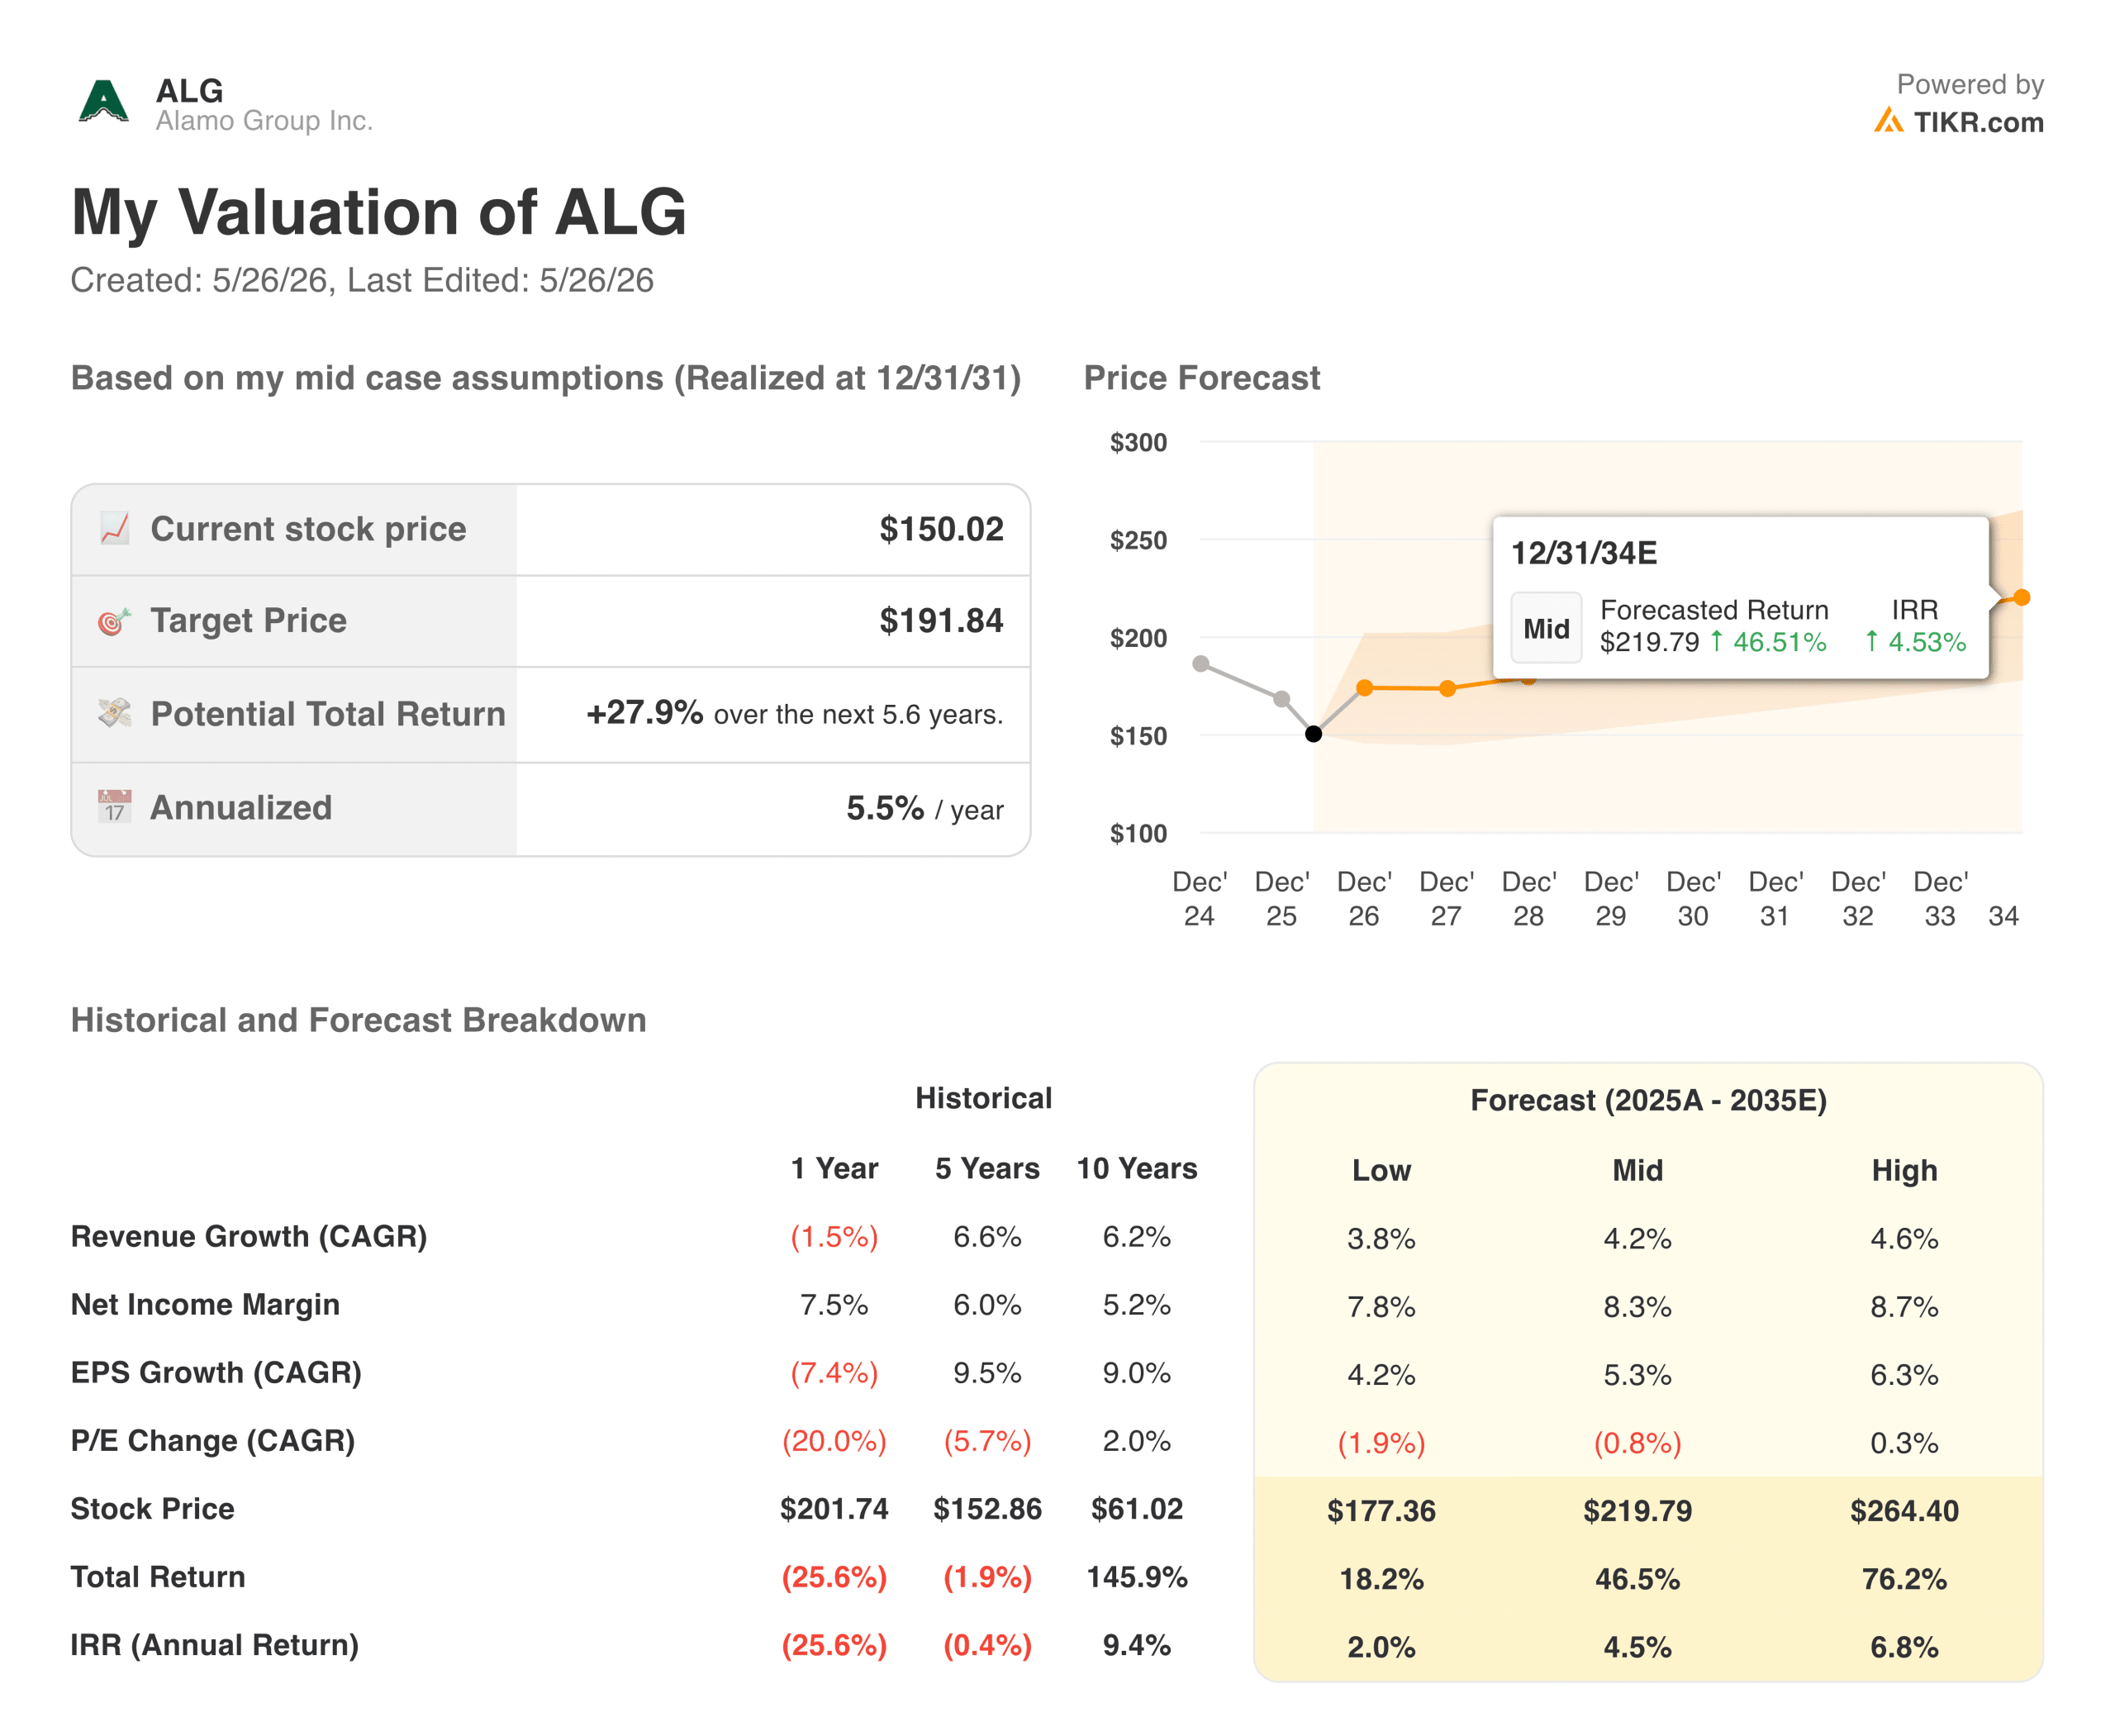
Under the mid-case forecasting parameters, organic revenue growth is modeled to settle at a normalized compound annual rate of 4.2%, assuming net income margins structurally expand toward 8.3% as procurement savings normalize.
These steady baseline parameters yield a structurally tight distribution of forward return pathways. The automated model proves that even if top-line revenue growth triggers down to a conservative low-case footprint of 3.8% through 2034, the underlying asset efficiency establishes a secure $177.36 stock price floor.
By protecting real operating margins from standard industrial pricing pressures, the forecast framework maps out a mid-case terminal stock price target of $219.79 by late 2034.
Is ALG Worth Buying at Today’s Levels?
At the current price of $150.02, the TIKR forward valuation model establishes a highly attractive, margin-of-safety entry point for long-term industrial allocators.
Under a mid-case forecast scenario, achieving a fair value target price of $191.84 by December 2030 generates a reliable 5.5% annualized internal rate of return over the next 4.6 years, scaling to a 10-year annualized return of 4.5% by 2034. This trajectory assumes a 5.3% compound annual growth rate for EPS alongside a conservative terminal P/E multiple contraction.
Crucially, the high-case scenario unlocks an impressive 6.8% annualized return over the 10-year model horizon if their specialized machinery margins successfully bounce back toward historical highs.
This narrow forecast variance indicates that the current market price reflects an overly pessimistic outlook, leaving massive room for operational upside. For disciplined allocators looking to capture an industry-leading infrastructure toll company trading at a compressed 17.94x LTM P/E multiple, initiating a position at today’s cyclical low represents a brilliant risk-reward setup.
Wall Street’s best ideas don’t stay hidden for long. Catch analyst upgrades, earnings beats, and revenue surprises on thousands of stocks the moment they happen with TIKR for free →
Looking for New Opportunities?
- See what stocks billionaire investors are buying so you can follow the smart money.
- Analyze stocks in as little as 5 minutes with TIKR’s all-in-one, easy-to-use platform.
- The more rocks you overturn… the more opportunities you’ll uncover. Search 100K+ global stocks, global top investor holdings, and more with TIKR.
Disclaimer:
Please note that the articles on TIKR are not intended to serve as investment or financial advice from TIKR or our content team, nor are they recommendations to buy or sell any stocks. We create our content based on TIKR Terminal’s investment data and analysts’ estimates. Our analysis might not include recent company news or important updates. TIKR has no position in any stocks mentioned. Thank you for reading, and happy investing!


