Key Stats for TJX Stock
- Past-6-Month Performance: 18%
- 52-Week Range: $112 to $163
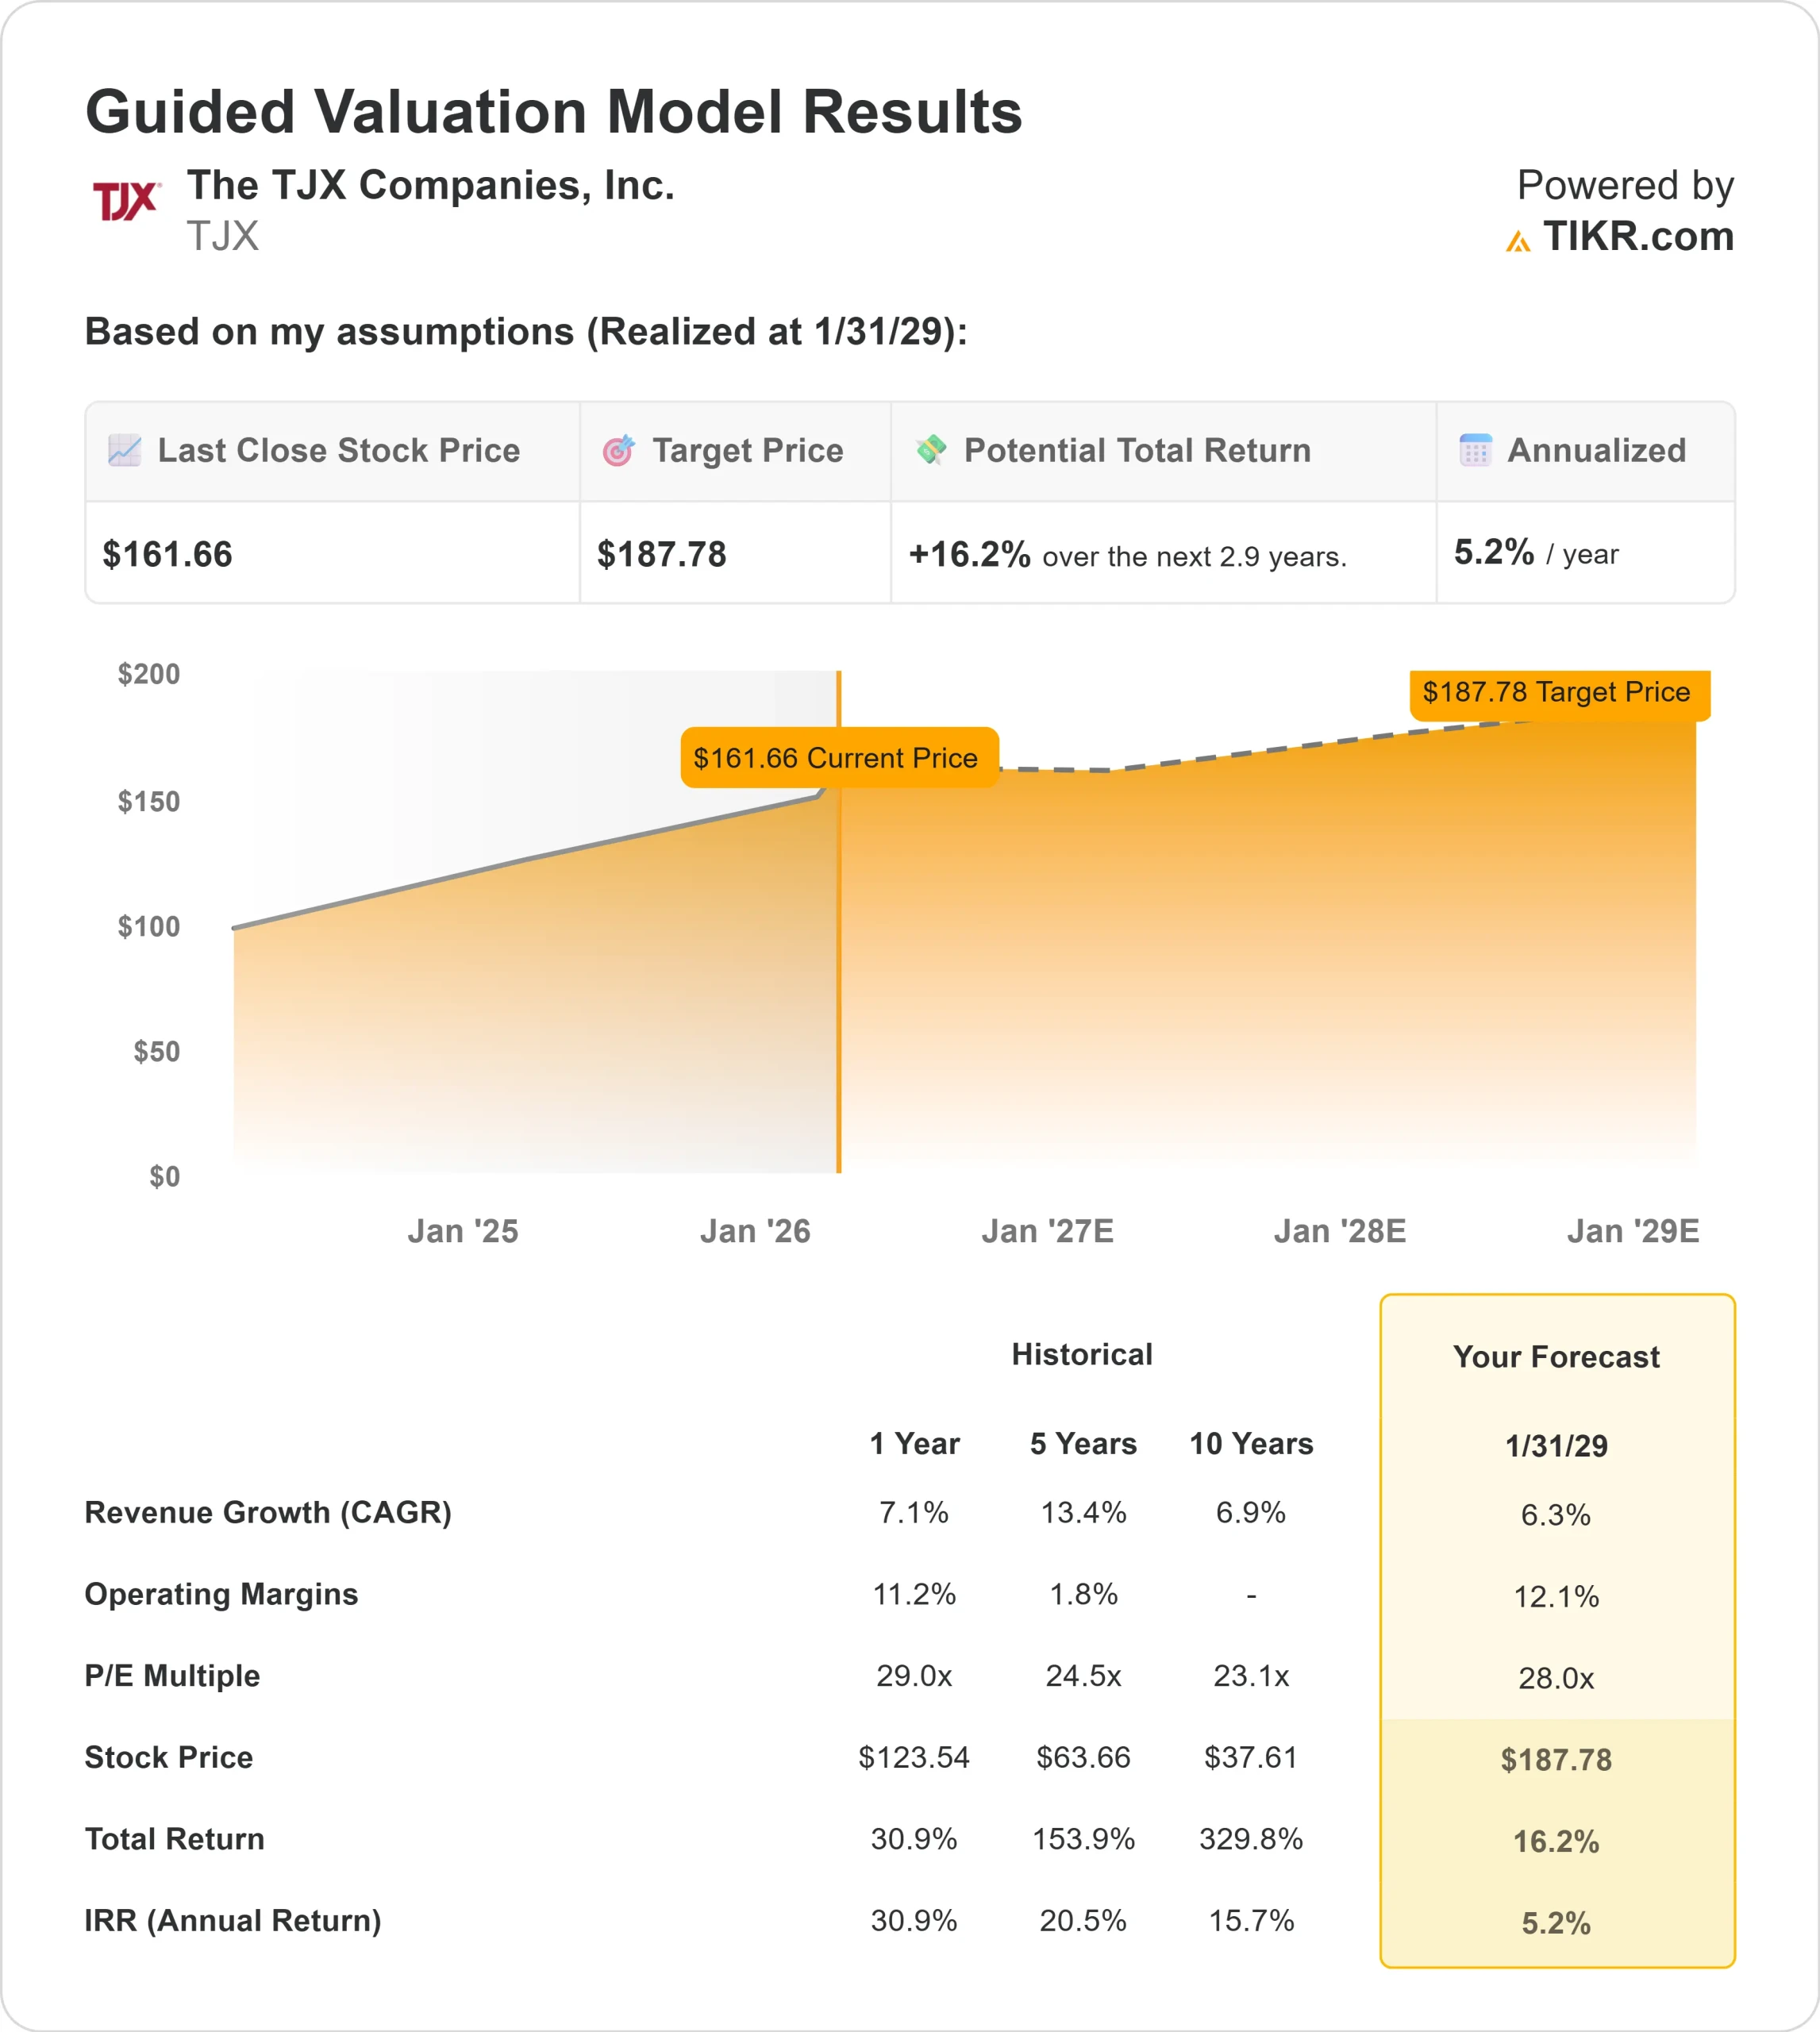
- Valuation Model Target Price: $188
- Implied Upside: 16%
Value your favorite stocks like TJX Companies with 5 years of analysts’ forecasts using TIKR’s new Valuation Model (It’s free) >>>
What Happened?
The TJX Companies stock has climbed about 18% in the last 6 months, recently trading near $162 per share as investors reacted to strong earnings growth, raised guidance, and steady institutional positioning updates.
Shares are now near the top of their $112 to $163 52-week range, reflecting sustained confidence in the company’s execution.
The stock moved higher because TJX delivered stronger-than-expected fourth-quarter results and issued confident fiscal 2027 guidance, reinforcing the durability of its off-price retail model.
Fourth-quarter net sales rose 9% to $18 billion, comparable sales increased 5%, and adjusted EPS climbed 16% to $1.43. CEO Ernie Herrman said he was “extremely pleased with our excellent fourth quarter results.”
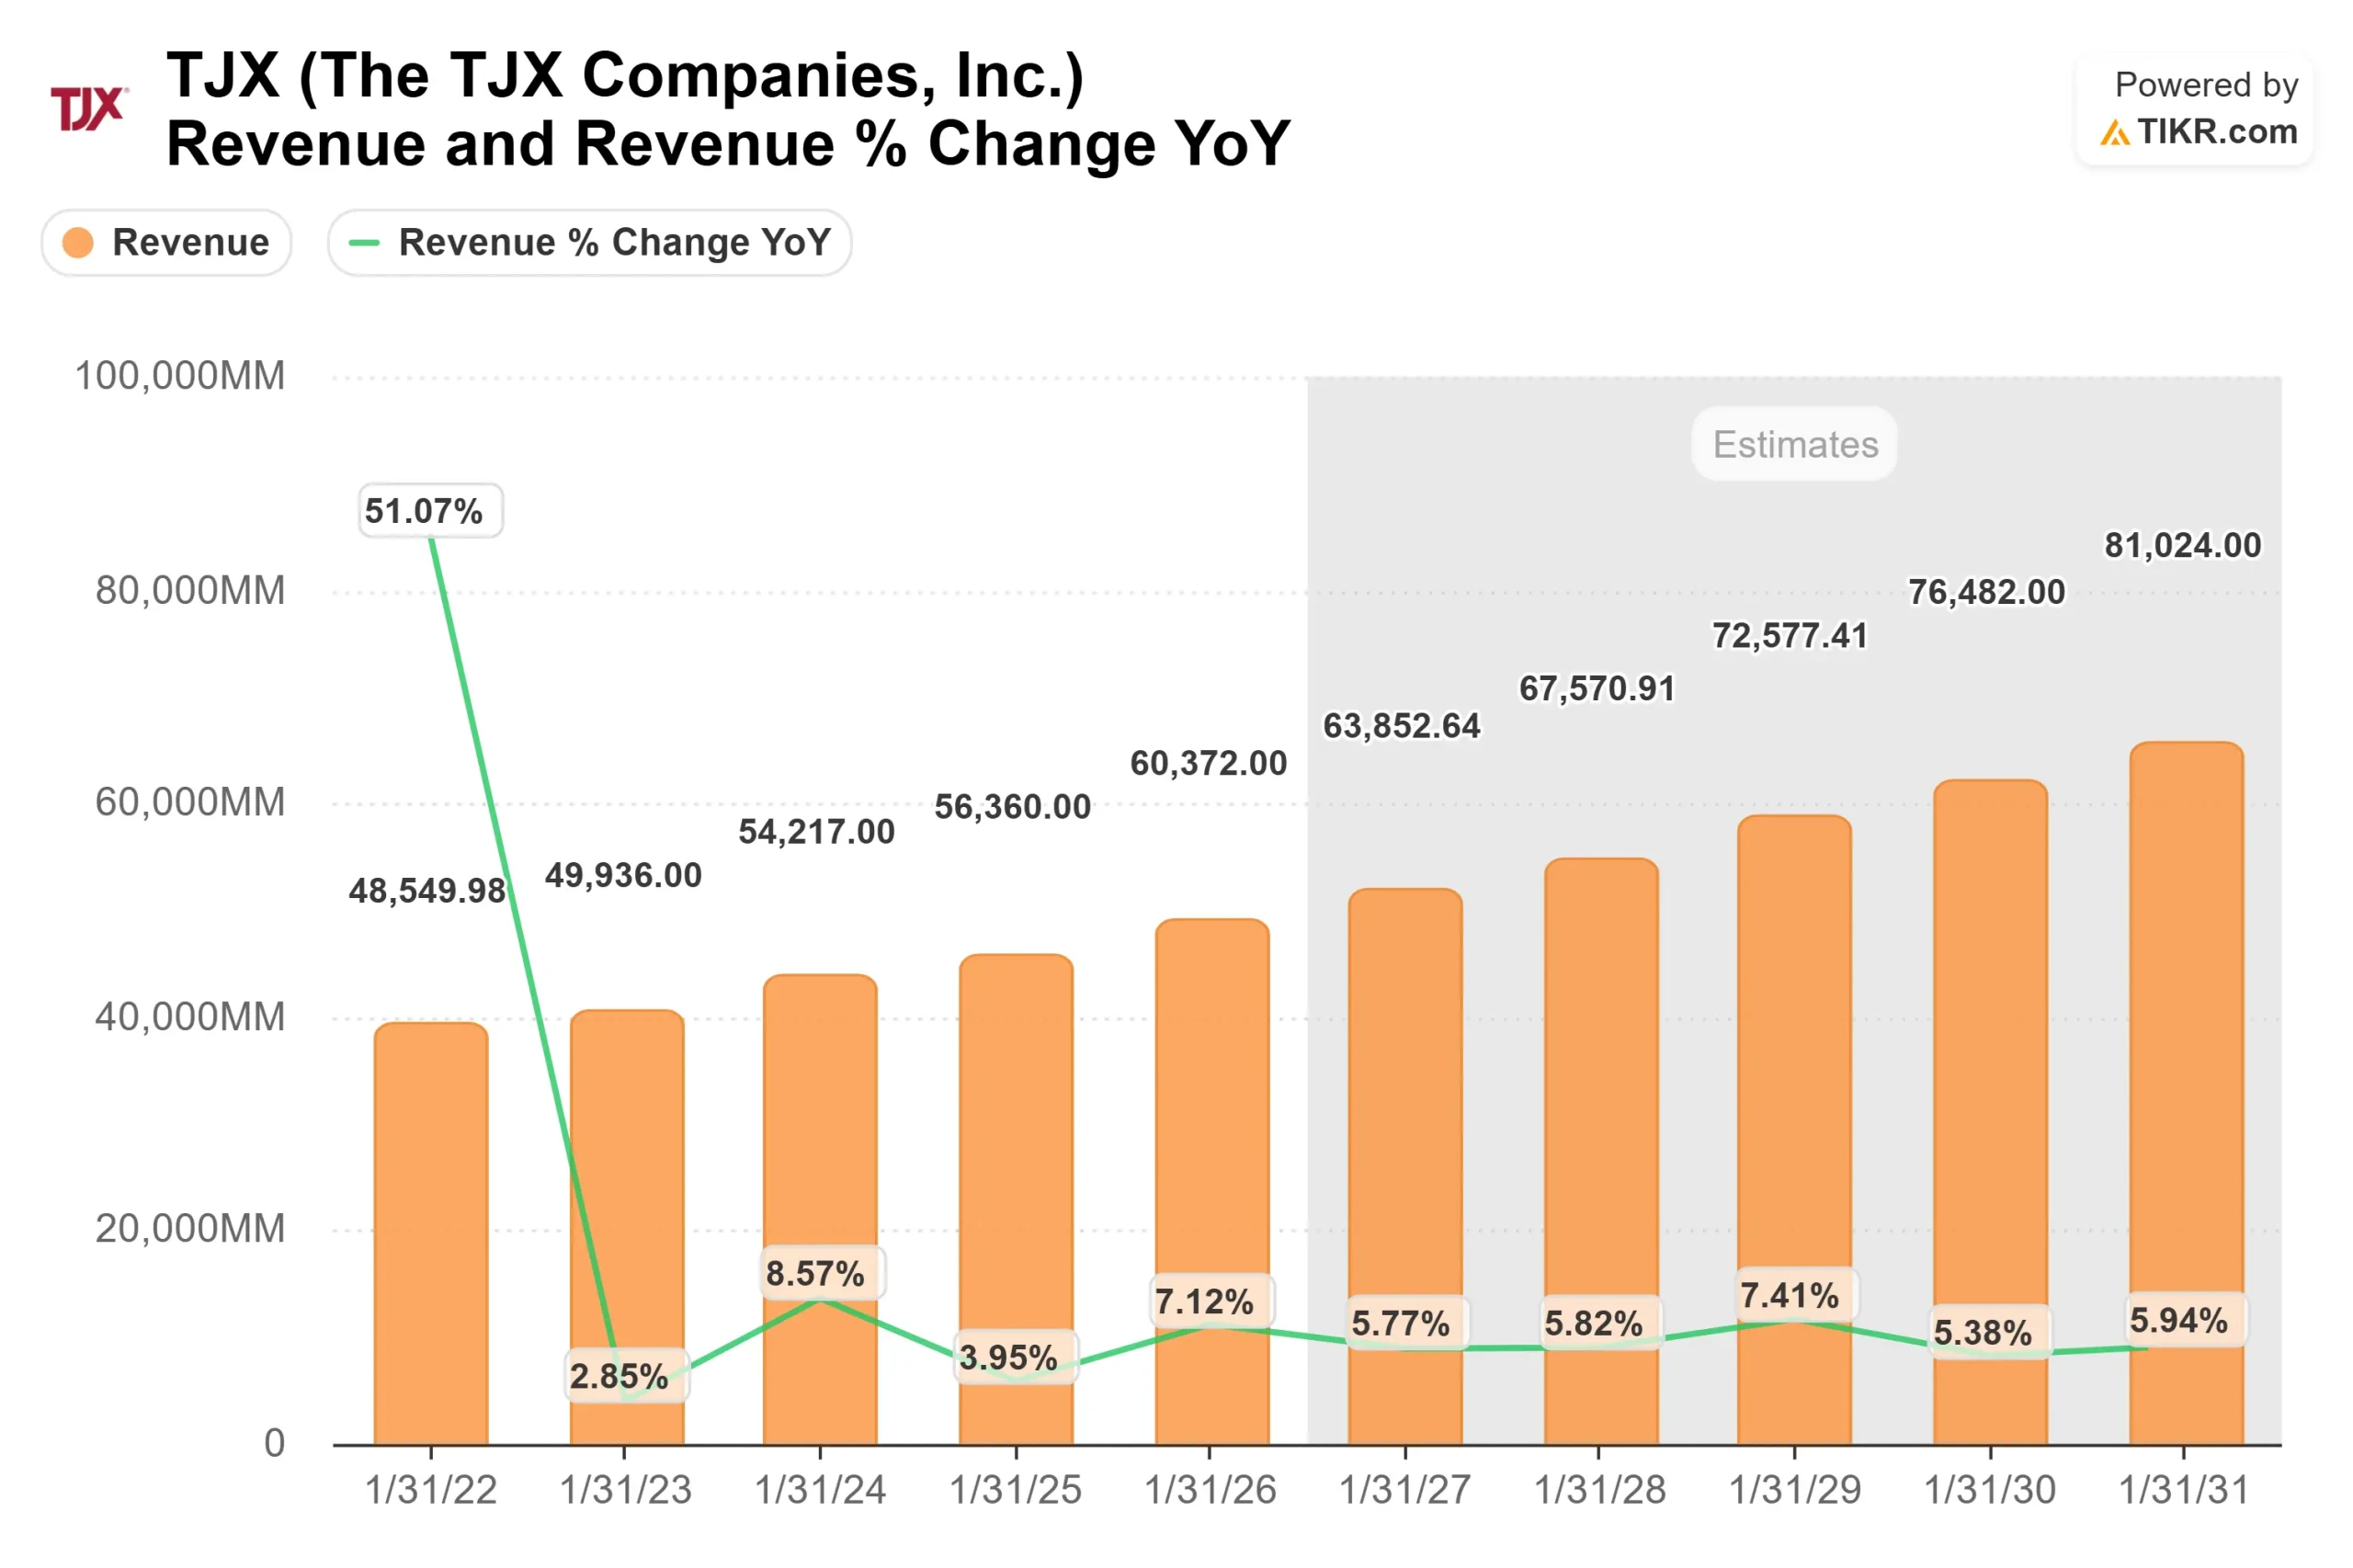
For fiscal 2026, full-year sales reached $60 billion, up 7%, with adjusted EPS of $4.73, up 11%, and management guided fiscal 2027 EPS to $4.93 to $5.02, signaling continued profit growth this year.
Institutional positioning added support. Mitsubishi UFJ Asset Management increased its stake by 3% to 2,662,056 shares valued at about $385 million, while Banco Santander boosted its position by 25% to 160,368 shares worth $23 million.
RWA Wealth Partners raised its stake 45% to 343,074 shares valued at $50 million, MAI Capital Management increased holdings by 29%, and Payden & Rygel lifted its position 49%, making TJX one of its larger holdings. Primecap Management trimmed its stake by 9% but still holds 10,524,552 shares valued at about $1.5 billion, underscoring continued institutional conviction.
With plans to open 146 net new stores this year, including its first stores in Spain, and guidance calling for 2% to 3% comp growth and sales of $63 billion in fiscal 2027, investors appear focused on TJX’s ability to continue gaining market share while maintaining merchandise margin discipline.
The rally reflects confidence in steady traffic growth, strong vendor relationships, and the company’s ability to expand earnings in 2026.
See analysts’ growth forecasts and price targets for TJX Companies (It’s free) >>>
Is TJX Undervalued?
Under valuation assumptions, the stock is modeled using:
- Revenue Growth (CAGR): 6%
- Operating Margins: 12%
- Exit P/E Multiple: 28x
Revenue growth in the mid-single-digit range reflects continued store expansion, share gains in off-price retail, and steady traffic trends supported by value-focused consumers.
With more than 1,400 buyers sourcing from approximately 21,000 vendors, merchandise availability remains strong, giving TJX flexibility to capture excess inventory and protect margins.
Operating margins around 12% assume continued expense discipline and modest merchandise margin expansion. With gross margin near 31% and EBIT margin near 12%, incremental comparable sales growth can drive operating leverage because fixed costs such as rent and distribution scale efficiently as volumes rise.
Based on these inputs, the model estimates a target price of $188, implying about 16% total upside, indicating the stock appears modestly undervalued at current prices.
Business performance over the next 12 months will likely be shaped by comparable store sales trends, vendor inventory conditions, and international expansion, including new stores in Spain and continued growth across Canada and Europe. Guidance for fiscal 2027 EPS of $4.93 to $5.02 implies another year of steady earnings growth.
At around $162 per share, TJX trades at 36x trailing earnings. Future returns in 2026 are likely to be driven by durable traffic gains, disciplined buying, margin stability, and continued store growth rather than rapid revenue acceleration.
Estimate a company’s fair value instantly (Free with TIKR) >>>
How Much Upside Does TJX Stock Have From Here?
Investors can estimate TJX Companies potential share price, or what any stock could be worth, in under a minute using TIKR’s New Valuation Model tool.
All it takes is three simple inputs:
- Revenue Growth
- Operating Margins
- Exit P/E Multiple
From there, TIKR calculates the potential share price and total returns under Bull, Base, and Bear scenarios so you can quickly see whether a stock looks undervalued or overvalued.
If you’re not sure what to enter, TIKR automatically fills in each input using analysts’ consensus estimates, giving you a quick, reliable starting point.
See TJX Companies true value, or any stock’s, in under 60 seconds (Free with TIKR) >>>