Key Takeaways:
- SoFi is scaling its lending and technology platform, driving 35.6% year-over-year revenue growth.
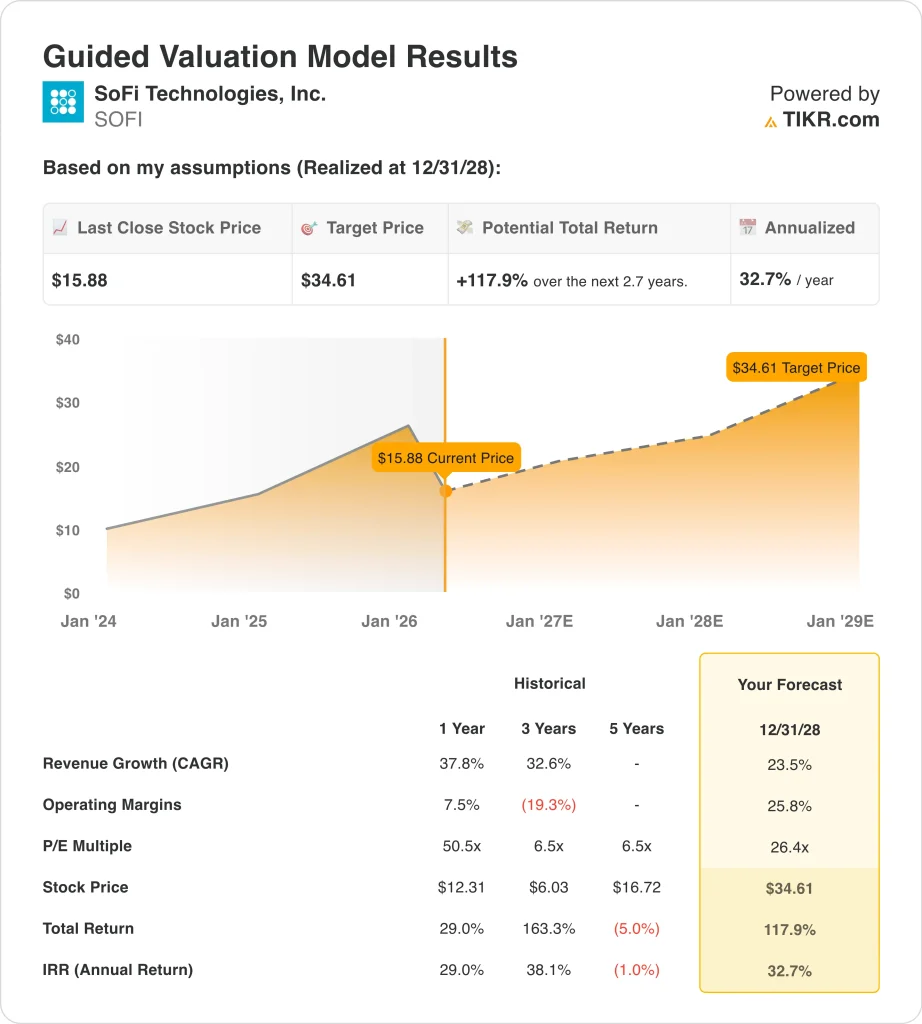
- SOFI stock could reasonably reach $34 per share by December 2028, based on our valuation assumptions.
- This implies a total return of 117.9% from today’s price of $15.88, with an annualized return of 32.7% over the next 2.7 years.
What Happened?
SoFi Technologies, Inc. (SOFI) has been volatile in recent weeks as investors react to both operational progress and external pressures. The stock closed at $15.88 on March 31, 2026, even as the company continues to report strong growth and improving profitability. Market sentiment remains mixed, balancing strong fundamentals against short-term risks.
One of the biggest catalysts came in March 2026 when short seller Muddy Waters disclosed a short position. The report triggered an initial sell-off, but SoFi quickly responded and stated it may pursue legal action. Notably, CEO Anthony Noto purchased $500,000 in shares shortly after, signaling internal confidence and helping stabilize sentiment.
At the same time, SoFi announced expansion of its loan platform business with agreements totaling over $3.6 billion. This reinforces its strategy of scaling lending while leveraging its technology platform, Galileo and Technisys. These partnerships are critical because they drive fee-based revenue alongside interest income, improving diversification.
The company was also added to the FTSE All-World Index in March 2026, which can increase institutional ownership and passive inflows. However, insider selling activity earlier in March created some caution among investors. The market is now weighing strong growth and improving margins against dilution and competitive fintech dynamics.
Here’s why SoFi stock could remain volatile but trend higher as profitability improves and platform revenue scales.
What the Model Says for SOFI Stock
We analyzed the upside potential for SoFi stock using valuation assumptions based on its strong revenue growth, improving profitability, expanding deposit base, and continued scaling across lending, financial services, and technology platform products.
Based on estimates of 23.5% annual revenue growth, 25.8% operating margins, and a normalized P/E multiple of 26.4x, the model projects SoFi stock could rise from $15.88 to $34.61 per share.
That would be a 117.9% total return, or a 32.7% annualized return over the next 2.7 years.
Our Valuation Assumptions
TIKR’s Valuation Model lets you plug in your own assumptions for a company’s revenue growth, operating margins, and P/E multiple, and calculates the stock’s expected returns.
Here’s what we used for SOFI stock:
1. Revenue Growth: 23.5%
SoFi has scaled revenue significantly, growing total revenue to $3.58 billion in 2025, up 35.6% year-over-year. Growth has been driven primarily by net interest income, which reached $2.22 billion and continues to benefit from loan origination and deposit expansion. The company’s transition into a bank charter model has enabled more efficient funding and improved margins.
The lending segment remains the core driver, but technology platform revenue is becoming increasingly important. Products like Galileo and Technisys allow SoFi to monetize financial infrastructure beyond its own customer base. This diversification helps stabilize growth across cycles.
Based on analysts’ consensus estimates, we use a 23.5% forecast, reflecting continued expansion in lending volumes, fintech platform adoption, and member growth, balanced against macroeconomic risks and credit normalization.
2. Operating Margins: 25.8%
SoFi has made a clear transition from losses to profitability, with operating income reaching $525.9 million in 2025. Operating margins improved to 14.7%, compared to negative levels in prior years. This shift reflects scale benefits and improved cost efficiency.
Expense growth has moderated relative to revenue, especially in employee costs and servicing expenses. At the same time, provision for loan losses declined to $30.3 million, supporting earnings stability. These trends indicate improving underwriting discipline and cost control.
Based on analysts’ consensus estimates, we use 25.8% operating margins, reflecting continued efficiency gains, a higher-margin technology revenue mix, and operating leverage, balanced against reinvestment in growth initiatives.
3. Exit P/E Multiple: 26.4x
SoFi currently trades at a forward P/E of approximately 26.4x, aligning with growth-oriented fintech peers. This multiple reflects expectations for sustained revenue growth and margin expansion but also embeds some execution risk.
Compared to traditional banks, SoFi commands a premium due to its technology platform and diversified revenue streams. However, fintech multiples have compressed in recent years, making valuation more sensitive to profitability delivery.
Based on analysts’ consensus estimates, we maintain a 26.4x exit multiple given SoFi’s hybrid model combining banking and technology, improving earnings visibility, and long-term growth potential.
Build your own Valuation Model to value any stock (It’s free!) >>>
What Happens If Things Go Better or Worse?
Different scenarios for SoFi stock through 2028 show varied outcomes based on revenue growth, margin expansion, and valuation execution (these are estimates, not guaranteed returns):
- Low Case: Loan growth slows, and credit concerns rise → 11.6% annual returns
- Mid Case: Revenue and margins expand steadily across segments → 15.8% annual returns
- High Case: Strong adoption of fintech platform and lending scale → 19.8% annual returns
SoFi’s future performance will depend heavily on credit quality, funding costs, and execution in its technology platform segment. While revenue growth remains strong, investor focus is shifting toward sustainable profitability and free cash flow. If the company continues improving margins while scaling deposits and partnerships, valuation could expand further, but volatility is likely to persist in the near term.

See what analysts think about SOFI stock right now (Free with TIKR) >>>
Should You Invest in SoFi Technologies, Inc.?
The only way to really know is to look at the numbers yourself. TIKR gives you free access to the same institutional-quality financial data that professional analysts use to answer exactly that question.
Pull up SOFI, and you’ll see years of historical financials, what Wall Street analysts expect for revenue and earnings in the quarters ahead, how valuation multiples have moved over time, and whether price targets are trending up or down.
You can build a free watchlist to track SOFI alongside every other stock on your radar. No credit card required. Just the data you need to decide for yourself.
Analyze SoFi Technologies stock on TIKR Free→
Looking for New Opportunities?
- See what stock billionaire investors are buying so you can follow the smart money.
- Analyze stocks in as little as 5 minutes with TIKR’s all-in-one, easy-to-use platform.
- The more rocks you overturn… the more opportunities you’ll uncover. Search 100K+ global stocks, global top investor holdings, and more with TIKR.
Disclaimer:
Please note that the articles on TIKR are not intended to serve as investment or financial advice from TIKR or our content team, nor are they recommendations to buy or sell any stocks. We create our content based on TIKR Terminal’s investment data and analysts’ estimates. Our analysis might not include recent company news or important updates. TIKR has no position in any stocks mentioned. Thank you for reading, and happy investing!