Key Stats for MU Stock
- Past week performance: -1.7%
- 52-week range: $164 to $1,255
- Valuation model target price: $1,152
- Implied upside: 9.3% over 1.9 years
Stress-test Micron’s peak-margin math with 5 years of analyst forecasts in TIKR’s Valuation Model (It’s free) >>>
Micron Enters Earnings Day With a $50 Billion Bar and a Patent Fight
Micron Technology (MU) slipped 1.7% over the past week as investors braced for fiscal Q4 results after the close on September 30. The stock trades near $1,066, about 15% below its 52-week high of $1,255. That pullback reflects caution rather than panic, since the business keeps posting records. Japan’s Nikkei even snapped a five-day winning run as traders turned careful ahead of the report.
Management guided for roughly $50 billion in revenue and adjusted EPS near $31. Consensus sits slightly higher at about $50.6 billion and $31.52. Non-GAAP gross margin, which strips out one-time costs, is guided near 86%. So the beat itself may matter less than fiscal 2027 pricing and supply commentary.
A fresh legal headline also landed this week. Netlist filed a complaint with the U.S. International Trade Commission (ITC), the agency that can block imports of products that infringe U.S. patents. It targets Micron DRAM tied to two high-bandwidth memory (HBM) patents, including chips inside Google, Nvidia, and Broadcom AI systems. This remains an allegation, however, and ITC cases take time to resolve.
HBM is stacked memory that feeds data to AI chips at high speed. On the June call, CEO Sanjay Mehrotra said, “We see 2027 overall tight. We have said we see tightness continuing beyond 2027.” That demand lifted fiscal Q3 revenue to $41.5 billion from $9.3 billion a year earlier. If MU stock is going to reclaim its high, the Q4 outlook must show that tightness still supports pricing into 2027.
Track Micron’s HBM pricing and margin estimates before tonight’s report (It’s free) >>>
Peak Profits Make Micron’s Valuation a Tricky Call

Under valuation model assumptions realized through 8/31/28, the stock is modeled using:
- Revenue Growth (CAGR): 60.0%
- Operating Margins: 80.4%
- Exit P/E Multiple: 7.2x
Based on these inputs, the model estimates a target price of $1,152, implying a 9.3% total return from the current share price of $1,054 and an annualized return of 4.7% over the next 1.9 years.
Micron looks cheap on the surface, but low multiples are normal at a memory peak. The stock trades at about 7.2x forward earnings, while its five-year average P/E sits near 30.2x. Investors discount peak profits because supply eventually catches up. So a single-digit multiple signals doubt about how long record margins can last.
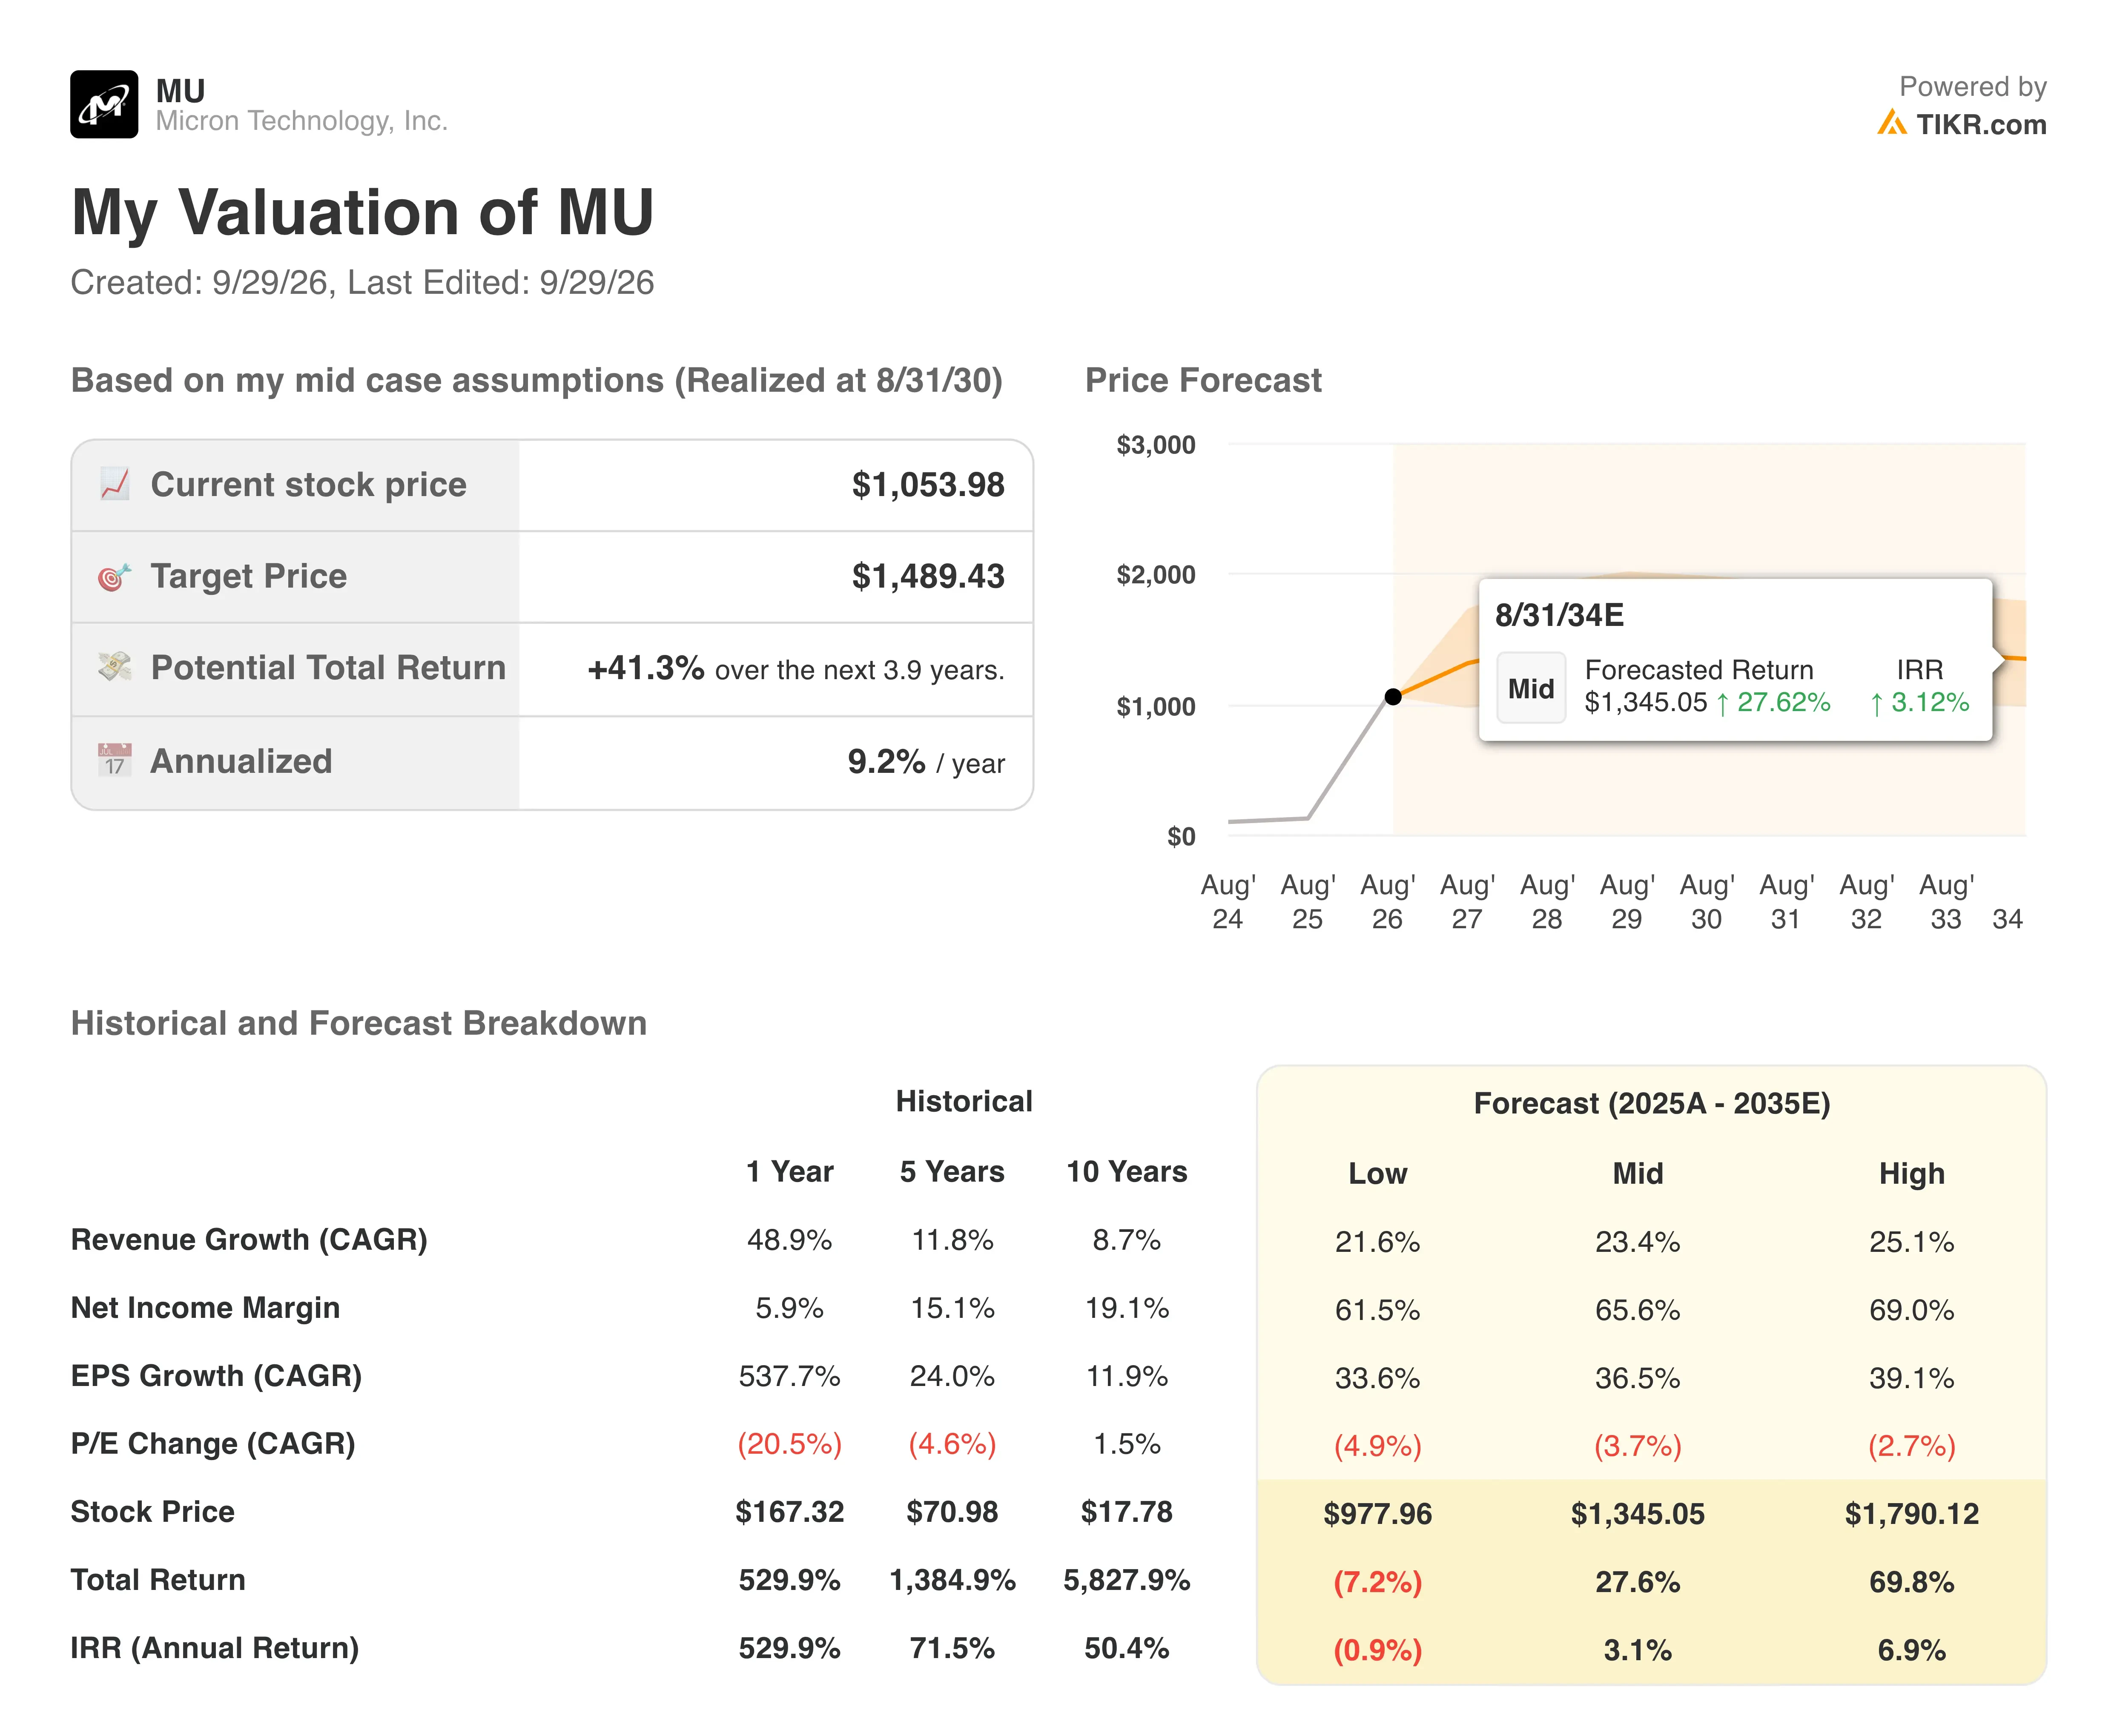
The model already assumes 60.0% annual revenue growth and 80.4% operating margins. Those margins sit far above Micron’s five-year average of 16.0%. Even with aggressive inputs, the stock earns only 4.7% a year. That return falls below the 5% level where upside starts to look limited.
This is a margin cycle story more than a growth story. Micron’s trailing operating margin already reached 65.7%, and rivals are also posting record profits. Because the whole industry is expanding HBM capacity, pricing power could fade once supply catches up.
Wall Street is more upbeat, with an average price target near $1,521. However, that view depends on tightness lasting well past 2027. Micron is not expensive on earnings, yet most of the easy gains appear priced in.
Compare Micron’s 7x earnings multiple with its memory cycle history (Free with TIKR) >>>
SK Hynix and Samsung Set the Pace in the HBM Race
SK Hynix (000660) remains the HBM leader and the most direct comparison. Its June quarter revenue rose 257% year over year, while operating margin hit a record 76%. It also began HBM4 shipments and signed long-term agreements with about 10 key customers. That combination gives SK Hynix the strongest profitability in the group.
Samsung Electronics (005930) is pushing to regain HBM ground. Its memory division earned 89.2 trillion won of operating profit on 127.5 trillion won of revenue in the June quarter, roughly a 70% margin. Samsung also expects HBM to consume nearly 30% of industry DRAM capacity next year. That shift tightens conventional DRAM supply, which supports prices for everyone.
Micron sits between the two on profitability. Its trailing operating margin of 65.7% trails SK Hynix, but its fiscal Q3 revenue more than quadrupled. Micron has already shipped over $1 billion of HBM4 and targets an HBM share close to its overall DRAM share. That discipline protects supply for other customers, yet it limits how fast Micron gains HBM share.
Investors treat all three as cyclical, so valuation gaps stay narrow. Therefore, Micron’s edge must come from HBM4E, which management expects to reach volume production in calendar 2027.
Compare the 29% upside with the risk of another memory-cycle downturn >>>
What’s Driving MU Stock Going Forward?
The fiscal Q4 report is the immediate catalyst. Management guided for about $50 billion in revenue and roughly 86% gross margin. Investors will care more about the fiscal Q1 outlook and 2027 contract pricing. A strong guide would confirm that AI demand still outruns supply.
Capacity is the next swing factor. Micron is investing at record levels, and multi-year Strategic Customer Agreements aim to lock in demand. These contracts can smooth earnings because customers commit to volumes over several years. However, heavy spending could pressure free cash flow if prices soften.
The Netlist case adds legal noise. An import ban would require an ITC ruling, which has not happened. Still, any escalation could weigh on sentiment because the complaint targets AI servers from Micron’s largest customers.
Industry trends remain supportive for now. Samsung’s HBM capacity outlook signals continued tightness in standard DRAM. Micron’s stock will likely track memory pricing more than headline revenue growth.
Estimate a company’s fair value instantly (Free with TIKR) >>>
Should You Invest in Micron?
The only way to really know is to look at the numbers yourself. TIKR gives you free access to the same institutional-quality financial data that professional analysts use to answer exactly that question.
Pull up MU, and you’ll see years of historical financials, what Wall Street analysts expect for revenue and earnings in the quarters ahead, how valuation multiples have moved over time, and whether price targets are trending up or down.
You can build a free watchlist to track MU alongside every other stock on your radar. No credit card required. Just the data you need to decide for yourself.
Analyze MU stock on TIKR Free→
Disclaimer:
Please note that the articles on TIKR are not intended to serve as investment or financial advice from TIKR or our content team, nor are they recommendations to buy or sell any stocks. We create our content based on TIKR Terminal’s investment data and analysts’ estimates. Our analysis might not include recent company news or important updates. TIKR has no position in any stocks mentioned. Thank you for reading, and happy investing!