Key Stats for Illumina Stock
- Current Price: $273.90
- Target Price (Mid): ~$412
- Street Target: ~$203
- Potential Total Return: ~50%
- Annualized IRR: ~10% / year
Now Live: Discover how much upside your favorite stocks could have using TIKR’s new Valuation Model (It’s free) >>>
What Happened?
Illumina (ILMN) closed at $273.90 on September 24, up 7.25% in a single session and a 52-week closing high, roughly triple its 52-week low of $88. The move came three sessions after Illumina joined the S&P 500, effective before the open on September 21. The bulk of the one-time forced buying by passive funds cleared into the September 18 rebalance close, so the September 24 jump reads as momentum and lingering enthusiasm for the raised guidance rather than fresh mechanical demand. Either way, the flow explains the pop. It does not explain why anyone should pay $273.90 for a business that Wall Street’s analysts, on average, value at $203.
The stock now trades about 35% above that mean target. The easy gains from index inclusion and four straight earnings beats are behind it, so what has to justify the price from here is not another re-rating but the durability of Illumina’s margins. The second-quarter call gave investors the clearest read yet on whether that engine can hold.
The Margin Held Through a Cost Shock That Should Have Broken It
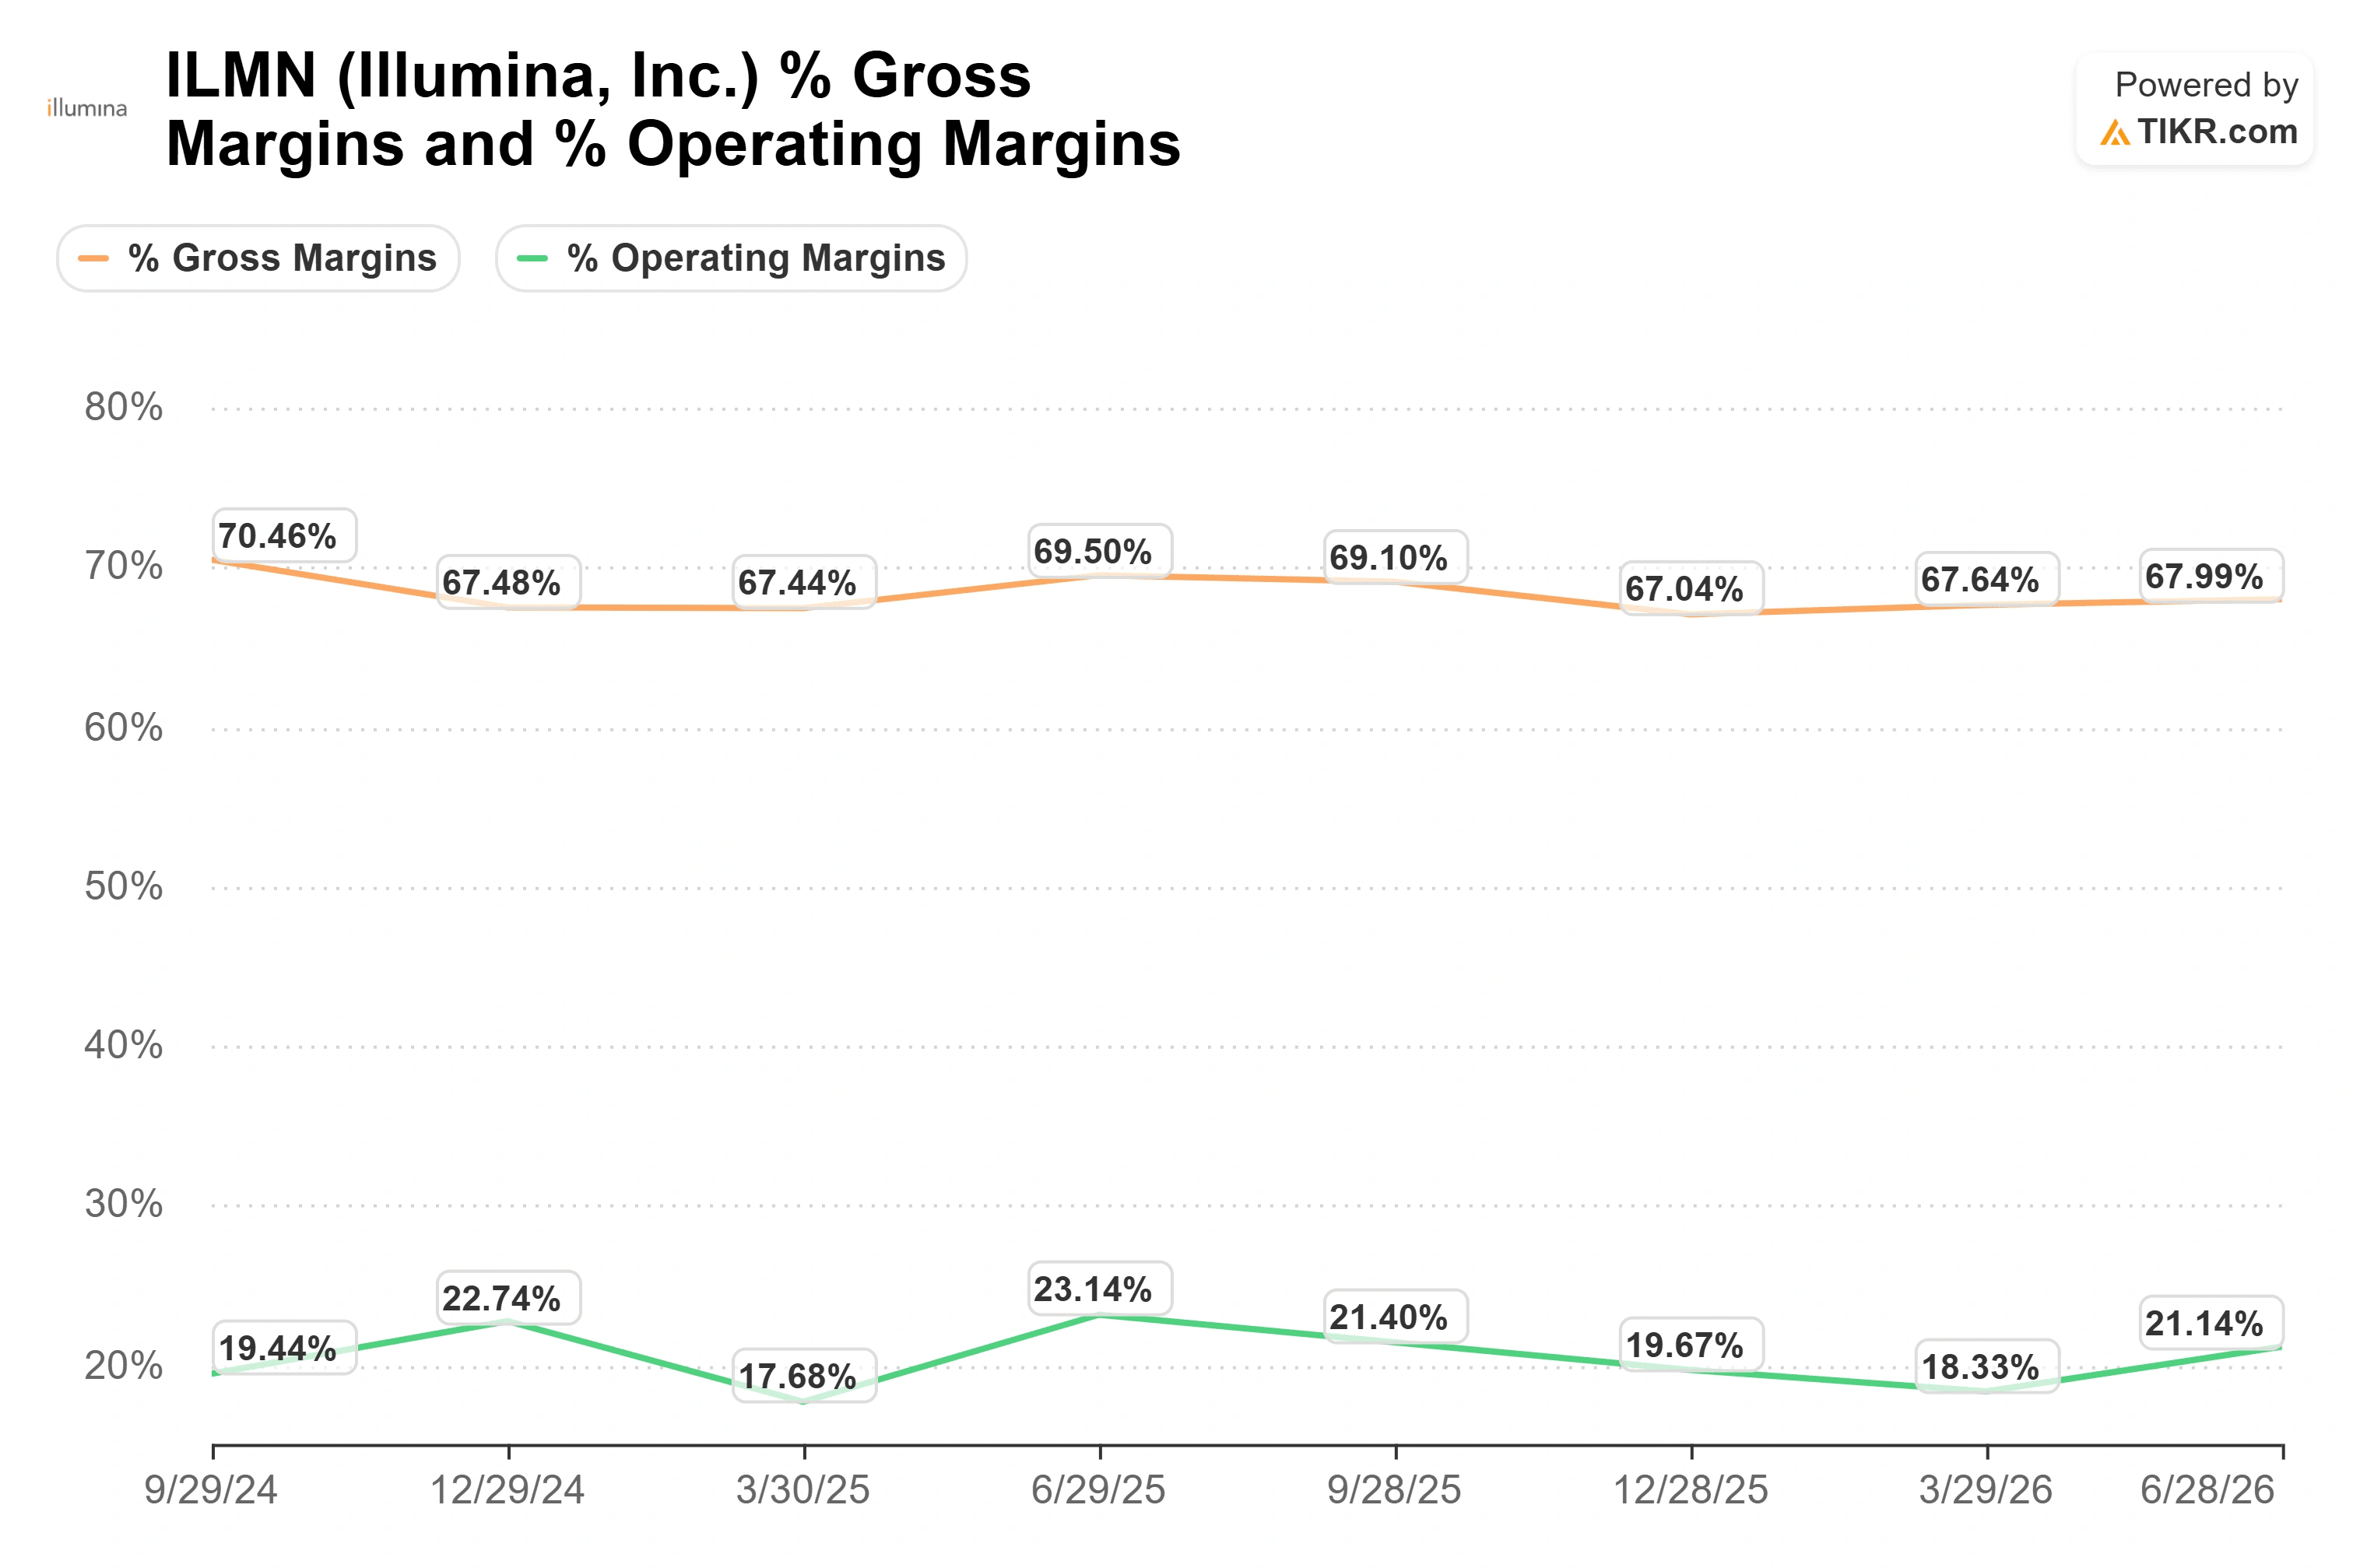
The number that mattered most in Q2 was that non-GAAP operating margin reached 22.5% while Illumina absorbed a real input-cost shock. DRAM prices have risen more than 400% since the start of 2024 through the end of 2026, according to J.P. Morgan Global Research, as AI data centers consume the world’s memory supply. Sequencers use that memory. Illumina paid up for it this quarter, along with higher freight, and still beat its own margin guidance.
CFO Ankur Dhingra was precise about the run rate. He flagged a roughly 60 basis point deferred-compensation effect that is neutral to EPS, then added that “excluding that, we’re about 23% operating margin in Q2.” That is the figure to anchor on, because it shows the real operating base. Gross margin came in at 68.2%, ahead of plan, even with a heavy mix of lower-margin instruments in the quarter.
Illumina also holds a structural cost edge that grows more valuable as memory tightens. Its sequencers do not run on the GPU architecture, straining under AI demand. As Dhingra put it, the instruments “use a different architecture, which is significantly less expensive and more cost-efficient than the GPU architectures.” In a market where memory and compute costs are the story, a platform insulated from the worst of it is a real advantage, and one that the current price barely credits.
See historical and forward estimates for Illumina stock (It’s free!) >>>
Management Is Guiding the Margin Higher
Illumina guided Q3 operating margin to approximately 24%, about 150 basis points above the Q2 base, driven by a richer consumables mix and a second wave of cost actions in the back half. It held full-year operating margin guidance at 23.4% to 23.6% and raised full-year adjusted EPS to $5.30 to $5.40, up 11% at the midpoint.
Sequencing consumables, the recurring kits used every time a machine runs, carry higher margins than the instruments, and they now grow off a much larger installed base after several quarters of elevated NovaSeq X placements. Clinical markets, about 65% of consumables revenue, grew 15% excluding China, with the U.S. and Canada region running above 20%. Instruments were placed at an elevated, lower-margin pace on purpose to build capacity. The consumables are where the margin returns, and management expects most of that benefit in 2027. The capital return backs the confidence: Illumina repurchased about $122 million of stock in the quarter and still has roughly $1.8 billion left under its authorization, with net debt near 1.1x EBITDA.
Against peers, the premium is stark. Illumina trades at 30x NTM EV/EBITDA, versus 22x for Thermo Fisher and 21x for Agilent, both larger and more diversified. Illumina’s forward EBITDA margin is expanding faster than either, which argues for some premium. Whether it justifies paying 35% more than Thermo Fisher on that multiple is the harder question, and the one the price is now asking.

See how Illumina performs against its peers in TIKR (It’s free!) >>>
TIKR Advanced Model Analysis
- Current Price: $273.90
- Target Price (Mid): ~$412 by 2030
- Potential Total Return: ~50%
- Annualized IRR: ~10% / year

See analysts’ growth forecasts and price targets for Illumina stock (It’s free!) >>>
Run at the current $273.90 entry, TIKR’s mid-case model values Illumina at around $412 by 2030. That is a more constructive read than the Street’s $203 mean target, and the divergence is the whole reason the stock is worth arguing about.
Revenue drivers: mid-teens clinical consumables growth pulling through the expanded NovaSeq X installed base, plus 1 to 2 points of incremental growth from the multiomics portfolio (StrataMap Spatial and SomaLogic proteomics) into 2027
Margin driver: consumables mix shift lifting net income margin toward 22% to 23%
Primary risk: the research and academic end market is still declining, and management declined to call a recovery despite late-quarter improvement in U.S. funding
Upside: clinical conversion compounds, margins expand as guided, and earnings grow into the multiple
Downside: trading well above the Street mean, any slip in consumables pull-through, memory costs, or China leaves little cushion
Conclusion
The next real test is the Q3 print in late October, and the number to watch is operating margin. Management guided to approximately 24%. Hitting it confirms the mix shift and cost actions are landing and that Q2’s 22.5% was a floor, not a peak. A reading below 23% would say memory and freight are biting harder than management let on, and at 30x forward EBITDA, this is not a stock priced to absorb a margin miss. The momentum got Illumina to a 52-week high.
See what stocks billionaire investors are buying so you can follow the smart money with TIKR.
Should You Invest in Illumina?
The only way to really know is to look at the numbers yourself. TIKR gives you free access to the same institutional-quality financial data that professional analysts use to answer exactly that question.
Pull up Illumina, and you’ll see years of historical financials, what Wall Street analysts expect for revenue and earnings in the quarters ahead, how valuation multiples have moved over time, and whether price targets are trending up or down.
You can build a free watchlist to track Illumina alongside every other stock on your radar. No credit card required. Just the data you need to decide for yourself.
Analyze Illumina on TIKR Free →
Looking for New Opportunities?
- See what stocks billionaire investors are buying so you can follow the smart money.
- Analyze stocks in as little as 5 minutes with TIKR’s all-in-one, easy-to-use platform.
- The more rocks you overturn… the more opportunities you’ll uncover. Search 100K+ global stocks, global top investor holdings, and more with TIKR.
Disclaimer:
Please note that the articles on TIKR are not intended to serve as investment or financial advice from TIKR or our content team, nor are they recommendations to buy or sell any stocks. We create our content based on TIKR Terminal’s investment data and analysts’ estimates. Our analysis might not include recent company news or important updates. TIKR has no position in any stocks mentioned. Thank you for reading, and happy investing!