
Cyclical companies confuse investors who rely on standard valuation methods. A steel producer trading at 5x earnings looks cheap until you realize those earnings sit at a cyclical peak and will collapse when the cycle turns. A homebuilder trading at 15x earnings looks expensive until you recognize that those earnings represent a cyclical trough and will expand as housing recovers. Trailing multiples mislead in both directions because they are anchored to earnings that do not represent normal conditions.
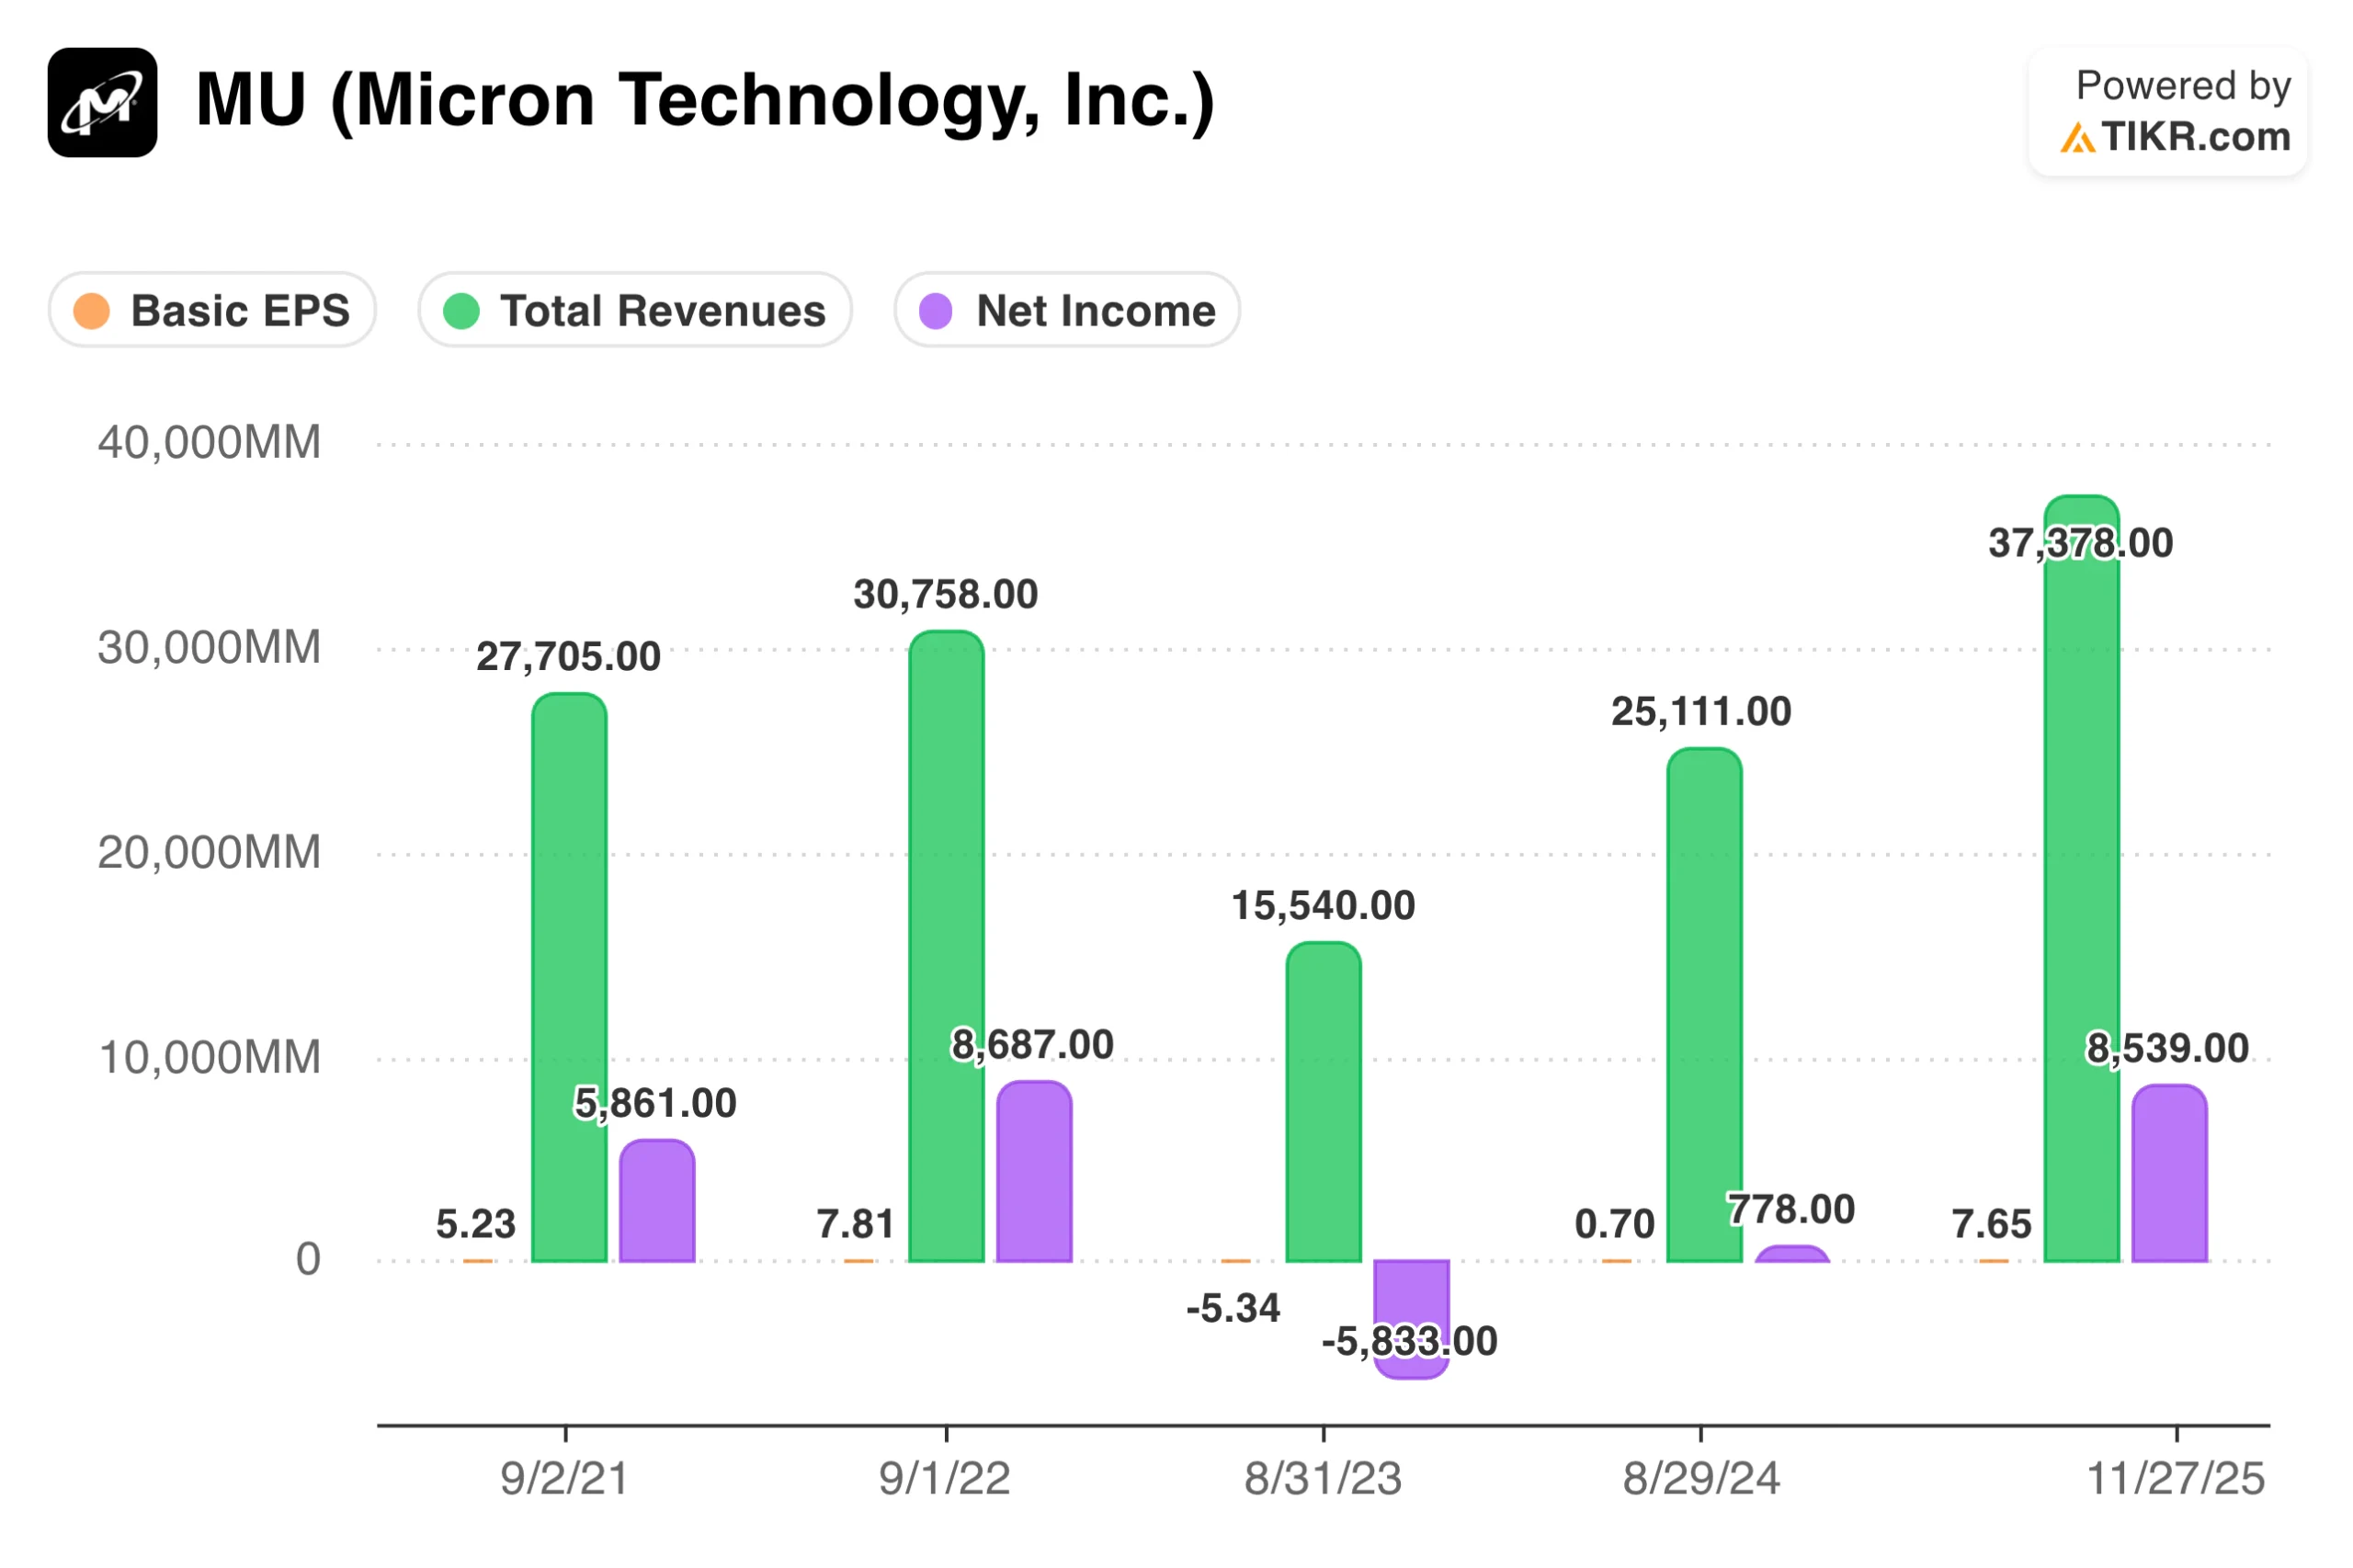
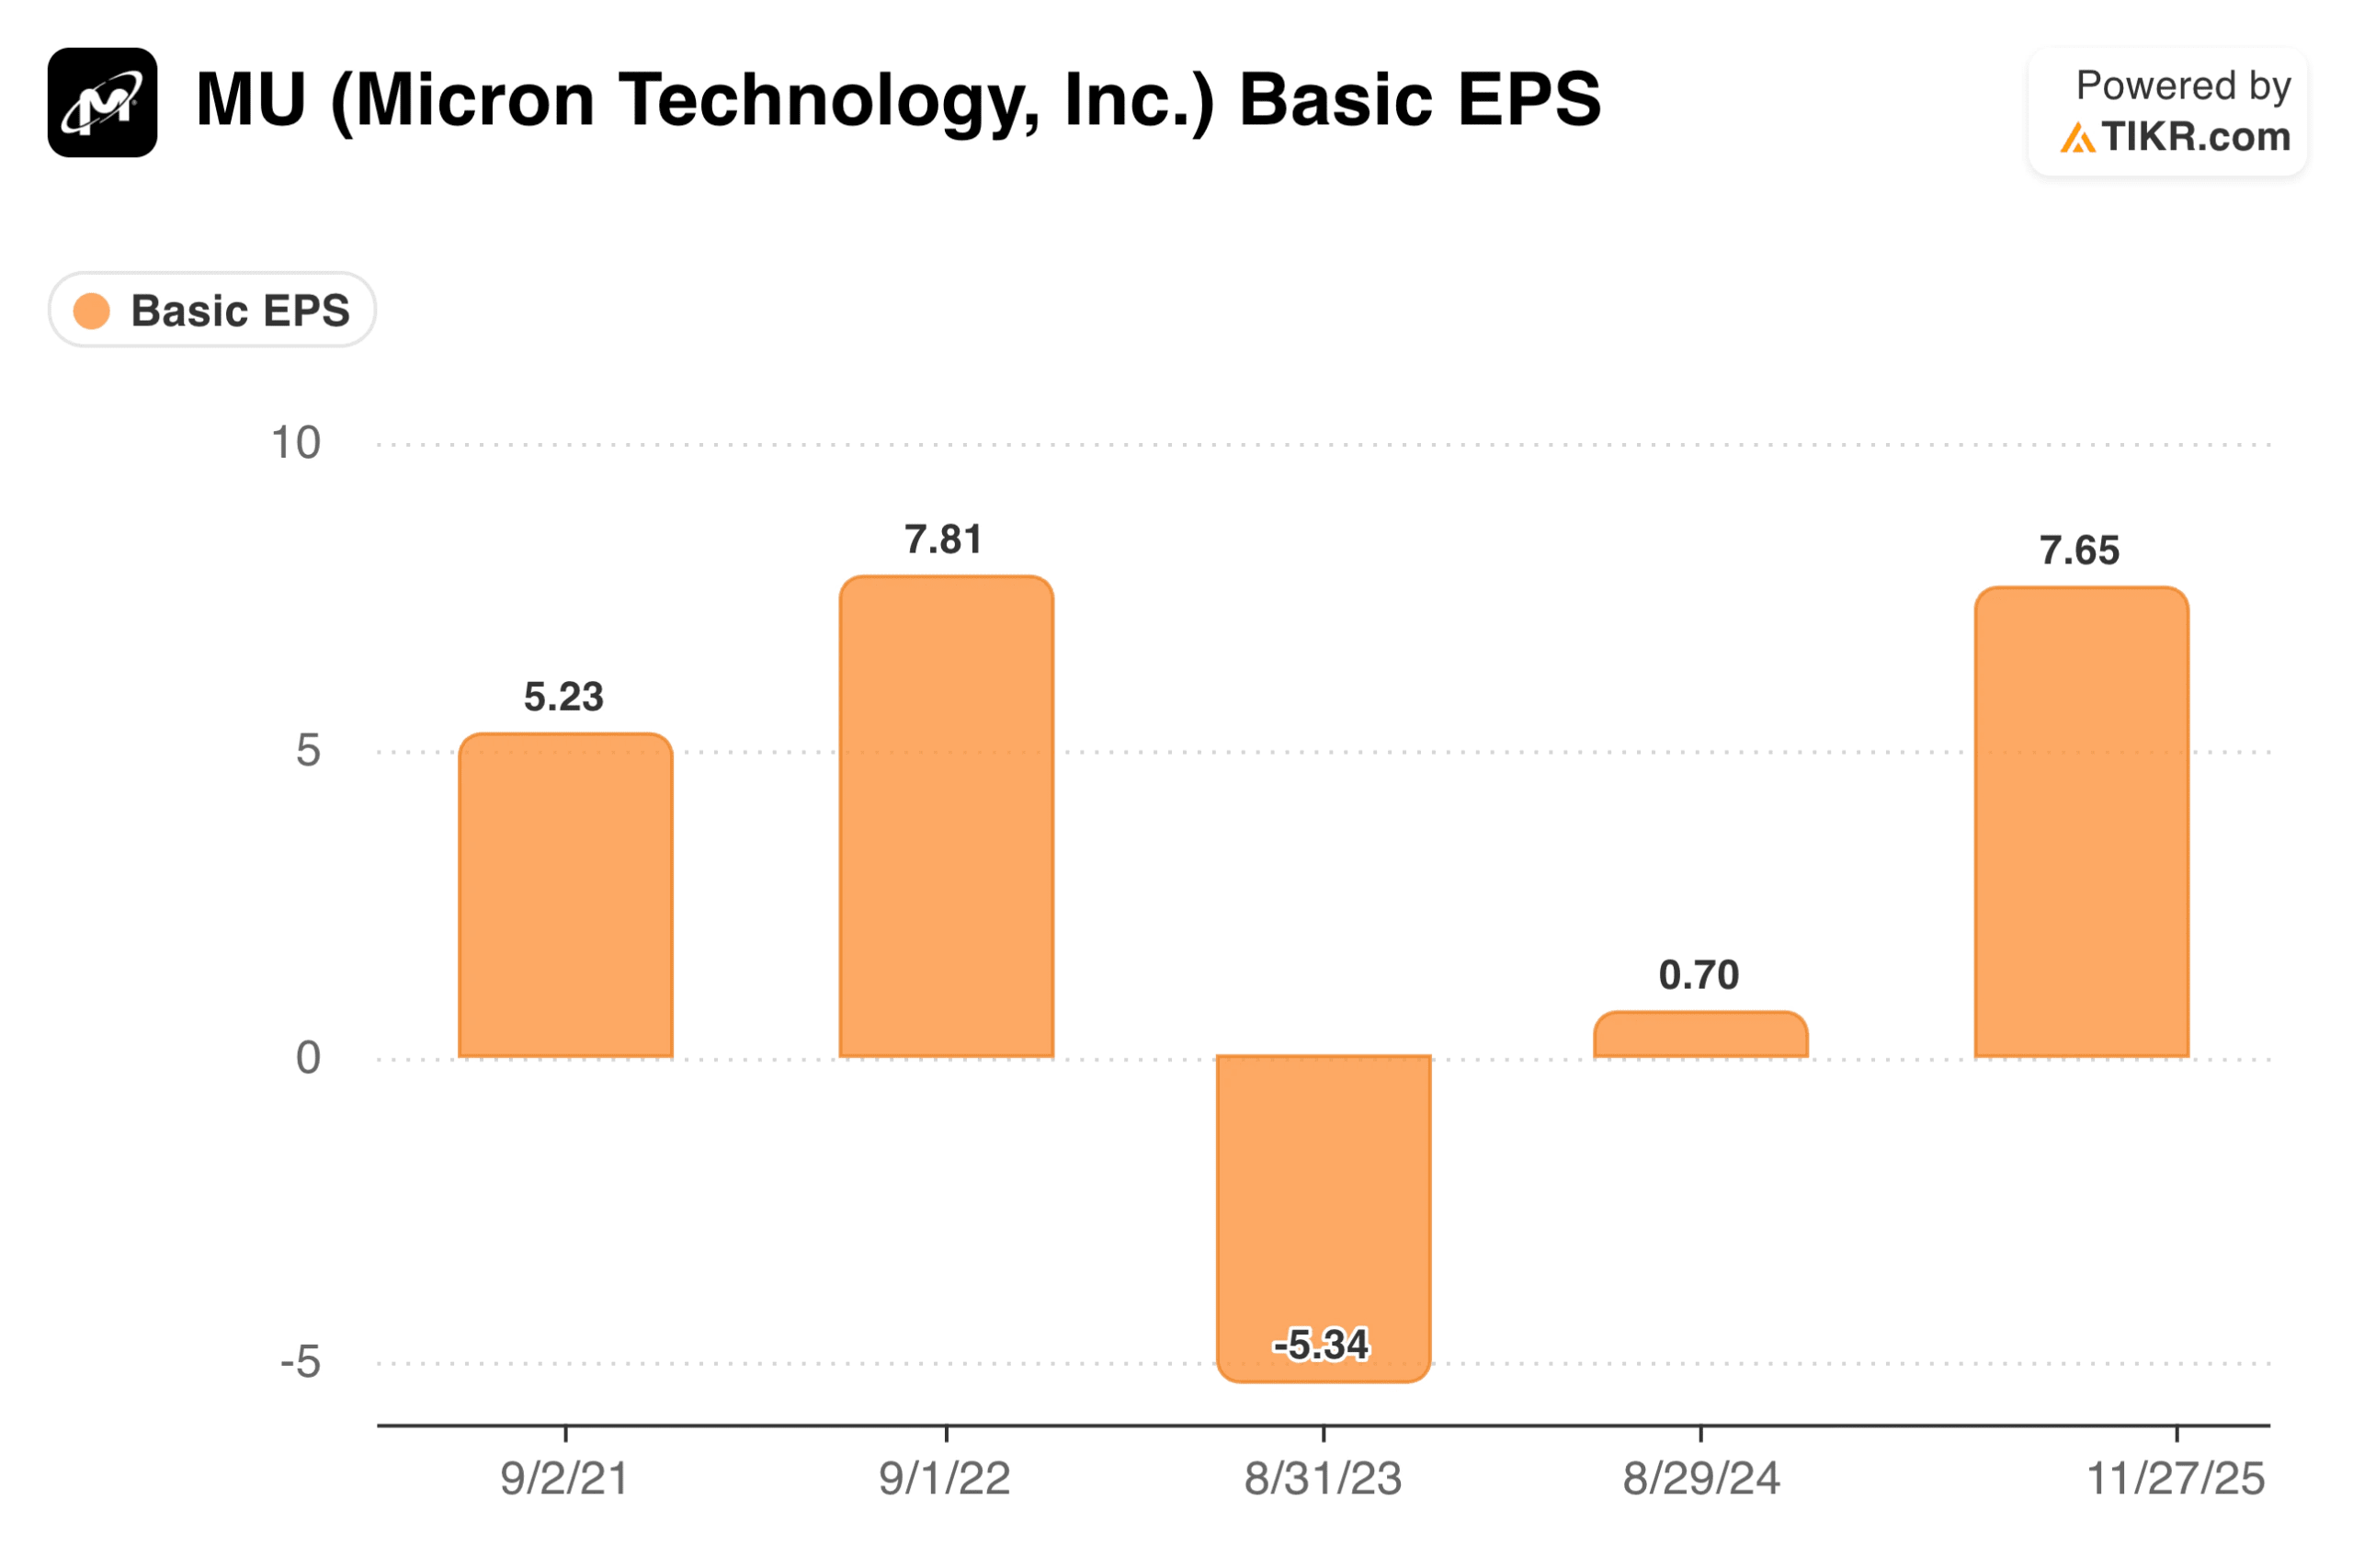
The challenge is that cyclical businesses experience dramatic swings in profitability driven by factors beyond management control. Commodity prices, interest rates, housing starts, capital spending cycles, and economic growth all drive earnings for companies exposed to these forces. A chemical company might earn $8 per share at the peak and $1 per share at the trough, making any single-year P/E ratio nearly meaningless.
Valuing cyclical companies requires normalizing earnings across the cycle rather than anchoring to current results. Investors who master this approach find opportunity when others see only confusion. They buy at cyclical troughs when earnings look terrible, but valuations are actually cheap. They sell at cyclical peaks when earnings look spectacular, but valuations have become stretched.
Find out what a stock’s really worth in under 60 seconds with TIKR’s new Valuation Model (It’s free)>>>
Recognize What Makes Earnings Cyclical
Cyclical earnings stem from exposure to economic forces that move in multi-year patterns. Commodity producers face price cycles driven by supply-and-demand imbalances that take years to correct. Homebuilders depend on housing cycles influenced by interest rates, demographics, and lending standards. Industrial companies selling capital equipment see orders surge during expansions and collapse during contractions. Banks experience credit cycles where loan losses fluctuate dramatically with economic conditions.
The key characteristic is that earnings revert toward a long-term average over time. Peak earnings attract new investment, which increases supply and eventually drives prices and profits down. Tough earnings cause capacity exits, which tighten supply and eventually drive recovery. This pattern repeats because the forces driving it are structural rather than company-specific.
Distinguish cyclicality from secular decline. Cyclical companies recover when conditions normalize. Declining companies face permanent headwinds that prevent recovery regardless of economic conditions. A steel company experiencing low earnings due to weak industrial demand is cyclical. One losing share to alternative materials faces structural challenges that will not be fixed by cycle turns.
TIKR tip: Review five years of revenue and earnings history in TIKR’s Detailed Financials to identify the cyclical pattern. True cyclicals show clear peaks and troughs that correspond to economic or industry cycles rather than steady deterioration.
Review a company’s cyclical earnings instantly (Free with TIKR) >>>
Normalize Earnings Across the Cycle
The core technique for valuing cyclical companies replaces current earnings with normalized or mid-cycle earnings. Instead of asking what the company earns today, ask what it earns on average across a full cycle. This normalized figure represents sustainable earnings power, which you can multiply by an appropriate valuation multiple.
Calculate average earnings over the past seven to ten years to capture at least one full cycle. This averaging smooths peaks and troughs to reveal underlying earning power. If a company earned between $2 and $10 per share over the past decade, with an average of $5, use $5 as your normalized earnings estimate rather than whatever the company happens to be earning this year.
Adjust the historical average if the business has changed materially. A company that has expanded capacity, made acquisitions, or improved its cost position will have higher normalized earnings going forward than its historical average suggests. One that has lost market share or seen its industry shrink will have lower normalized earnings. Use history as a starting point, but apply judgment about how the future might differ.
TIKR tip: Pull earnings per share data across multiple years in TIKR’s Detailed Financials and calculate the average yourself. Comparing this normalized figure to the current stock price provides a cycle-adjusted valuation that trailing multiples cannot offer.
Value any stock in less than 60 seconds with TIKR’s new Valuation Model (It’s free) >>>
Choose the Right Valuation Metrics
Standard P/E ratios are inappropriate for cyclical companies because earnings fluctuate too widely. A 5x P/E at peak earnings often signals expensive, not cheap, because those earnings will decline. A 25x P/E at trough earnings often signals cheap rather than expensive because those earnings will recover. The multiple and the earnings move in opposite directions across the cycle.
Price-to-book value provides a more stable anchor for many cyclical businesses. Book value changes more slowly than earnings, providing a consistent base for valuation. A cyclical company trading below book value at the trough may offer significant upside as earnings recover and the market revalues the equity. Compare the current price-to-book to the historical range to assess where the company sits in its valuation cycle.
Enterprise value to mid-cycle EBITDA combines the normalization concept with a metric less volatile than net income. Calculate average EBITDA over a full cycle, then compare the current enterprise value to that normalized figure. This approach accounts for capital structure while smoothing the earnings volatility that distorts P/E ratios.
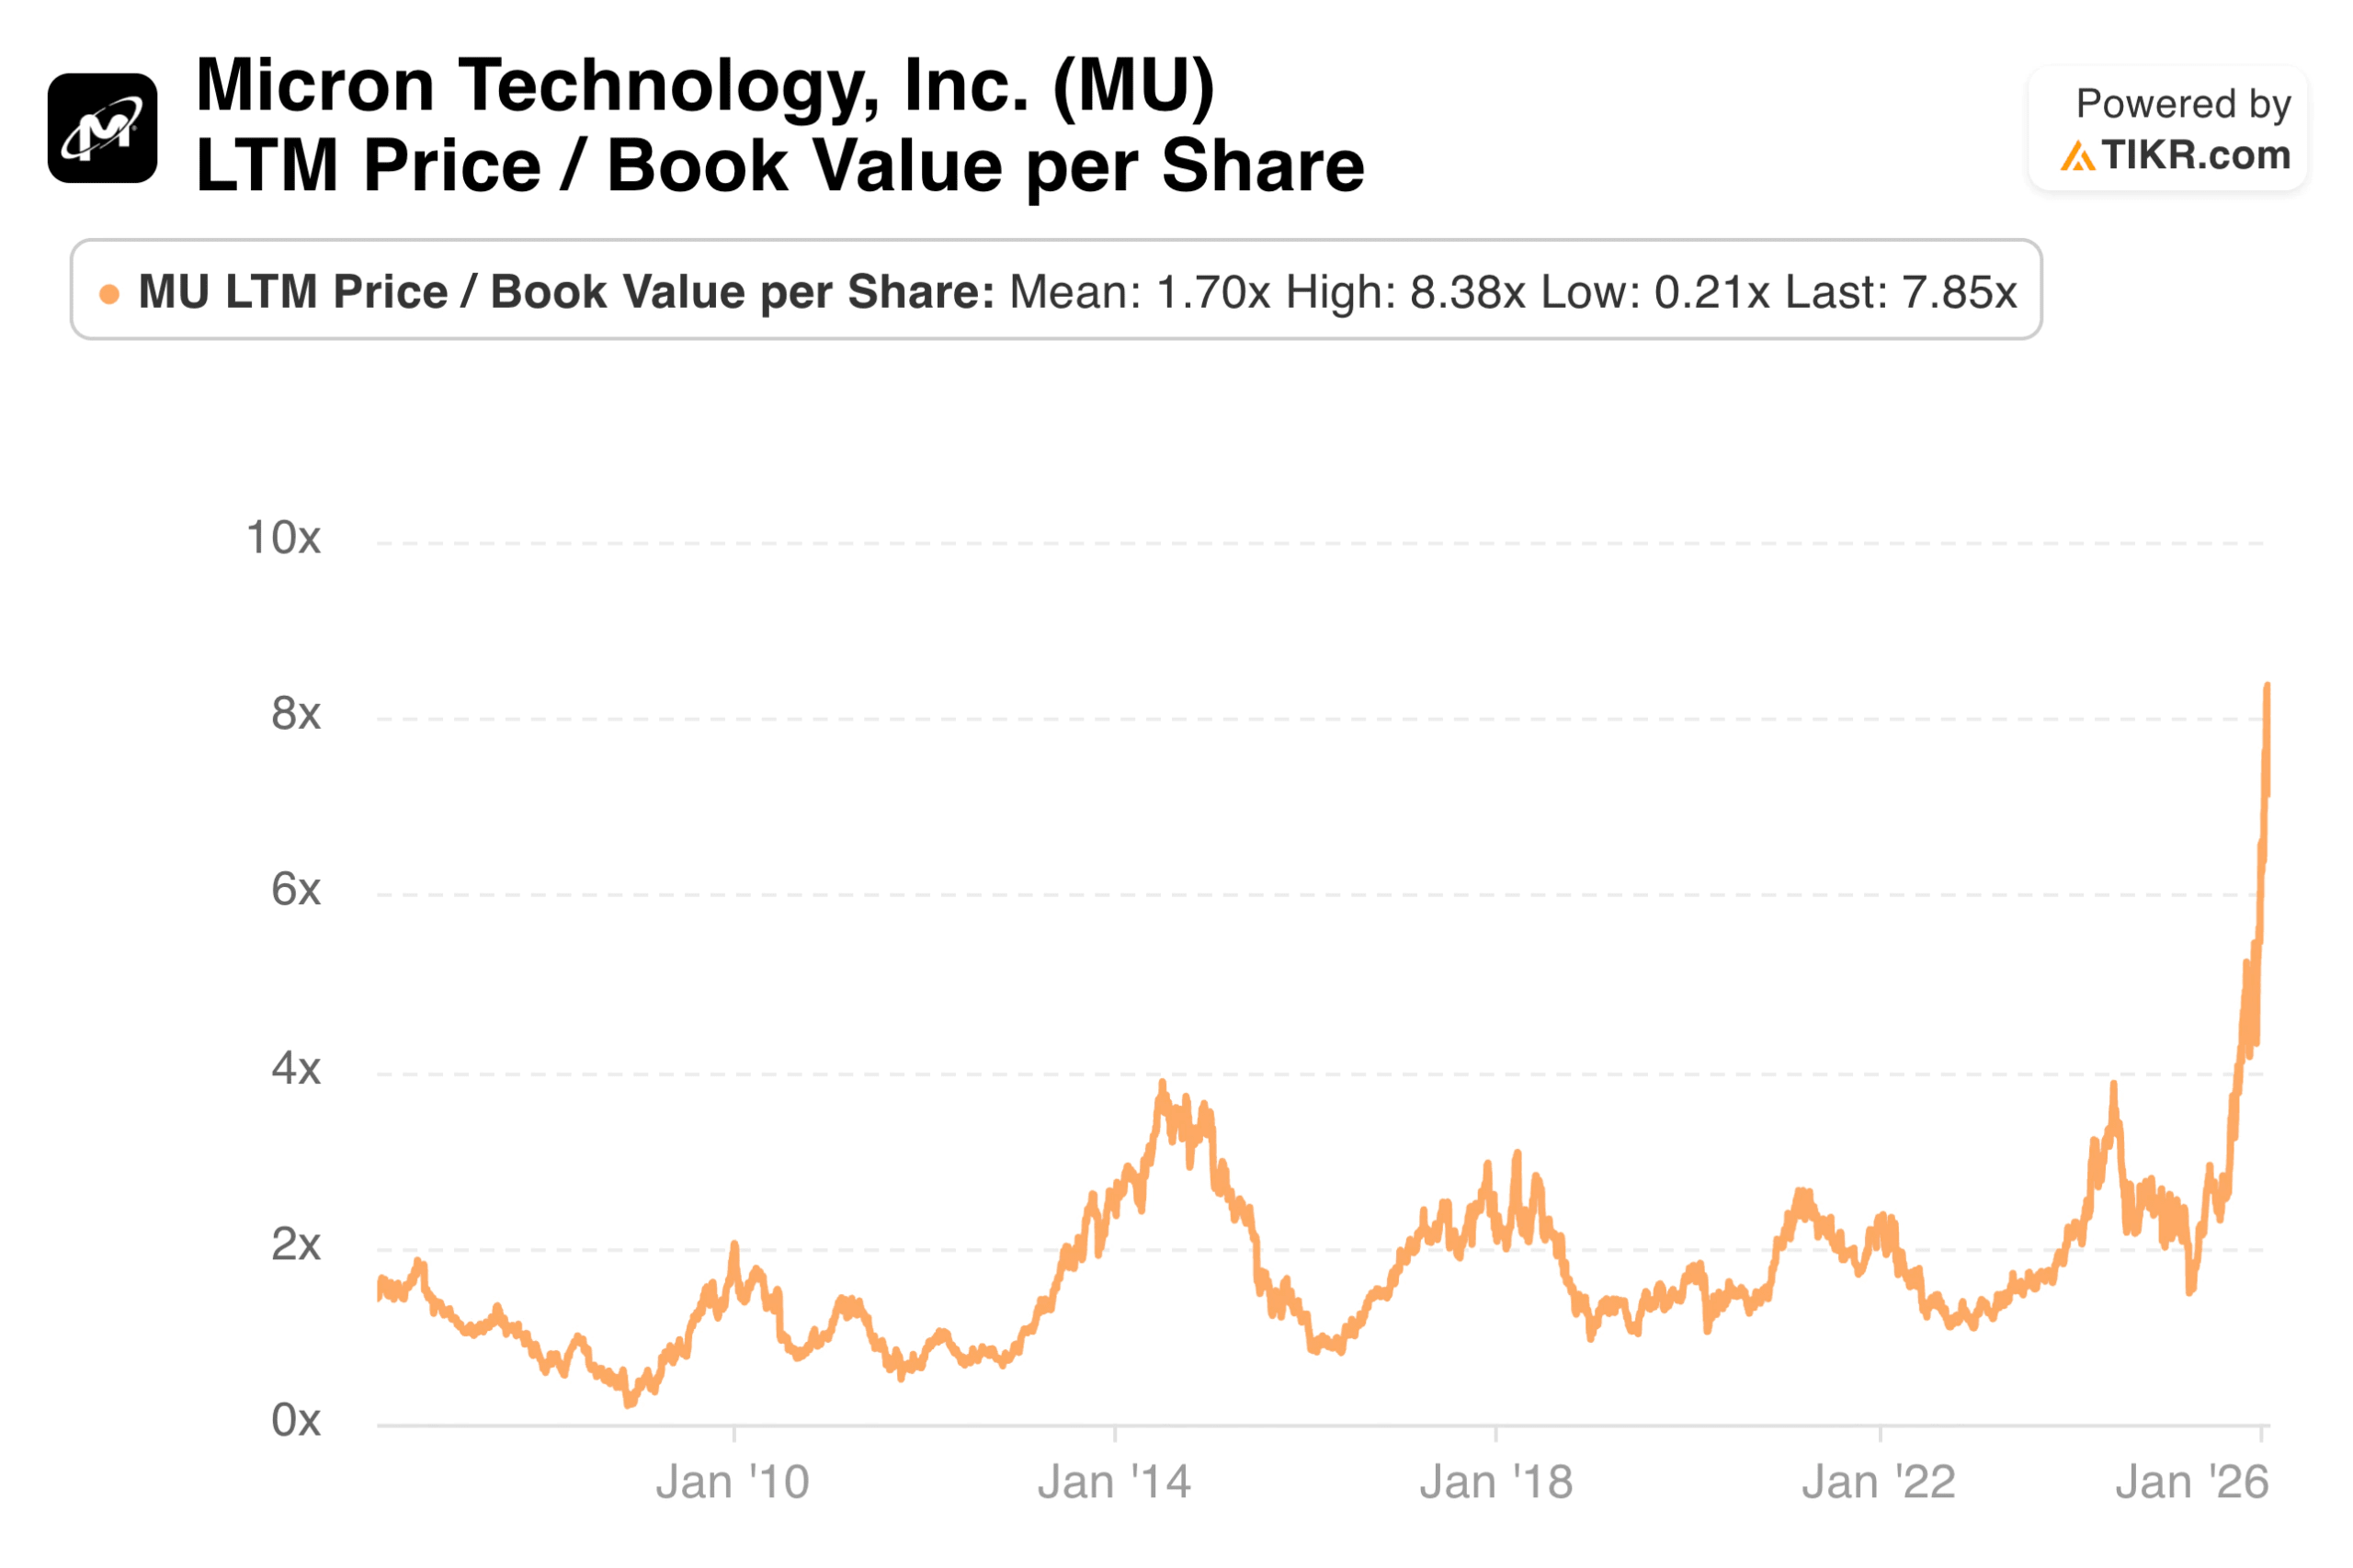
TIKR tip: Track price-to-book value over time in TIKR’s Valuation section to see how the current multiple compares to historical peaks and troughs. Cyclical companies often reach similar valuation extremes at each cycle turn, providing reference points for timing.
Get the most up-to-date earnings snapshots of thousands of stocks with TIKR (It’s free) >>>
Use Balance Sheet Strength as a Guide
Balance sheet strength determines which cyclical companies survive downturns and which face distress. A company with low debt and ample cash can wait out a prolonged trough, maintain strategic investments, and even acquire struggling competitors. A leveraged company facing the same downturn may need to raise dilutive equity, sell assets at depressed prices, or restructure debt on unfavorable terms.
Prioritize cyclical companies with conservative balance sheets, especially when buying during apparent troughs. The trough may last longer or go deeper than expected. A company with two years of cash runway and modest debt service can handle an extended downturn. One with near-term maturities and heavy interest burdens may not survive long enough for the cycle to turn.
Strong balance sheets also enable countercyclical investment. Companies that invest during downturns often emerge with improved competitive positions when the cycle recovers. They expand capacity when construction costs are low, acquire competitors at distressed valuations, and gain market share from weaker players cutting back. These advantages compound through multiple cycles.
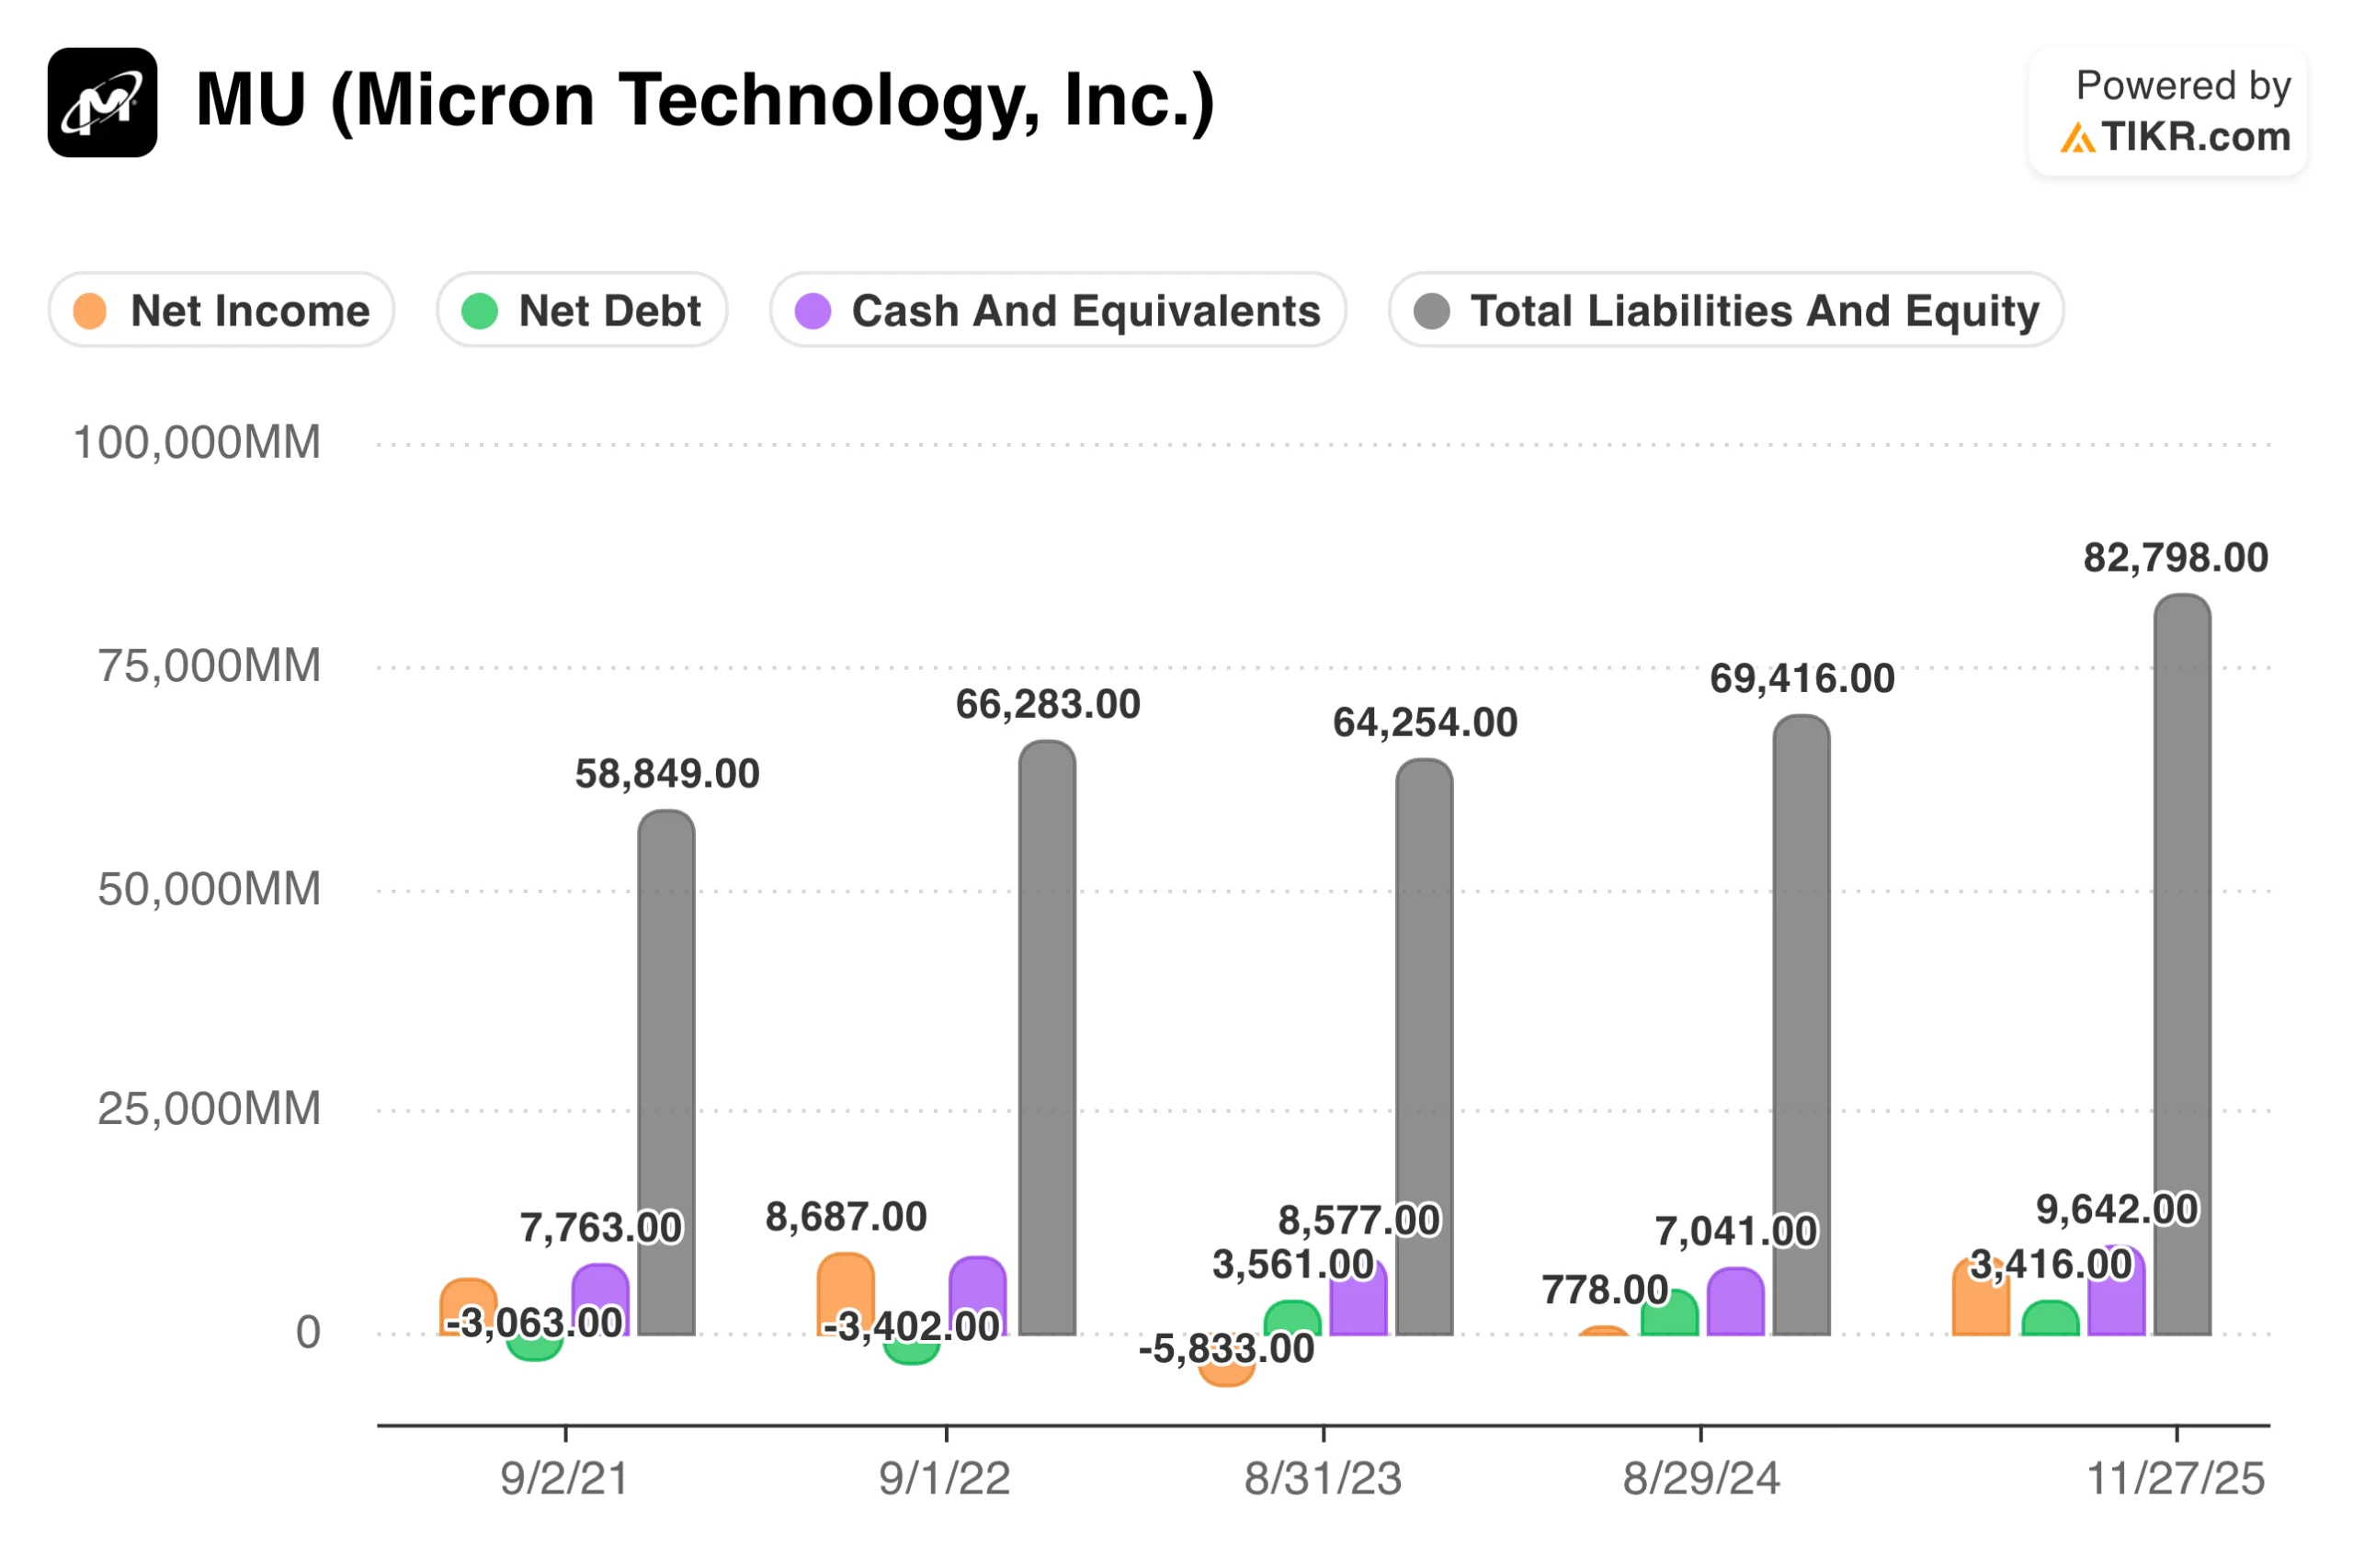
TIKR tip: Review net debt, cash positions, and debt-to-equity ratios in TIKR’s Balance Sheet data. Compare leverage levels to previous cycle troughs to assess whether the company can survive similar or worse conditions.
Track company financials to quickly review earnings power with TIKR (It’s free) >>>
Buy When Multiples Look Expensive
Cyclical investing often requires counterintuitive action. The best time to buy a cyclical stock is often when its P/E ratio appears expensive. A homebuilder trading at 25x earnings during a housing trough may be cheaper than the same company trading at 8x earnings during a housing boom. The high multiple reflects depressed earnings that are expected to recover. The low multiple reflects peak earnings that are expected to decline.
This pattern exists because markets anticipate. When a cyclical stock trades at a low multiple, the market has already priced in that current earnings are unsustainable and will decline. When it trades at a high multiple, the market recognizes that current earnings are depressed and will improve. Investors who buy low P/E cyclicals often catch falling knives as earnings collapse toward the trough. Those who buy high P/E cyclicals at the bottom often ride the recovery as earnings normalize.
The practical application requires identifying where the cycle stands rather than relying on trailing multiples. A cyclical company at 20x trough earnings, which will earn four times as much at mid-cycle, is trading at 5x normalized earnings. The optically expensive multiple masks genuine cheapness. Conversely, a company at 5x peak earnings that will earn one-quarter as much at mid-cycle is actually trading at 20x normalized earnings. The optically cheap multiple masks’ genuine expensiveness.
TIKR tip: Review earnings per share over the past ten years in TIKR’s Detailed Financials. If current earnings sit near historical lows, a high P/E may signal an opportunity. If current earnings sit near historical highs, a low P/E may signal risk.
The TIKR Takeaway
Cyclical companies require different valuation techniques than stable growers. Trailing earnings and standard P/E ratios are misleading because they anchor to a single point in a volatile pattern. Normalized earnings, price-to-book ratios, and mid-cycle EBITDA multiples provide more reliable guides to underlying value.
The opportunity in cyclical investing comes from recognizing where the cycle stands and what that implies for valuation. Buy when current earnings look terrible but normalized valuations are attractive. Sell when current earnings look spectacular but the cycle has matured and valuations have stretched. This approach requires patience and conviction, but it captures returns that investors focused on trailing results consistently miss.
TIKR provides the historical data essential for cyclical analysis. Multi-year financials reveal the earnings pattern across previous cycles. Valuation history shows how the market has priced the company at prior peaks and troughs. Balance sheet data confirms whether the company can survive extended downturns. Together, these tools help you value cyclical businesses when standard approaches fall short.
Find undervalued stocks in less than 60 seconds with TIKR’s new Valuation Model (It’s free) >>>
Value Any Stock in Under 60 Seconds with TIKR
With TIKR’s new Valuation Model tool, you can estimate a stock’s potential share price in under a minute.
All it takes is three simple inputs:
- Revenue Growth
- Operating Margins
- Exit P/E Multiple
If you’re not sure what to enter, TIKR automatically fills in each input using analysts’ consensus estimates, giving you a quick, reliable starting point.
From there, TIKR calculates the potential share price and total returns under Bull, Base, and Bear scenarios so you can quickly see whether a stock looks undervalued or overvalued.
See a stock’s true value in under 60 seconds (Free with TIKR) >>>
Looking for New Opportunities?
- Discover which stocks billionaire investors are purchasing, so you can follow the smart money.
- Analyze stocks in as little as 5 minutes with TIKR’s all-in-one, easy-to-use platform.
- The more rocks you overturn… the more opportunities you’ll uncover. Search 100K+ global stocks, global top investor holdings, and more with TIKR.
Disclaimer:
Please note that the articles on TIKR are not intended to serve as investment or financial advice from TIKR or our content team, nor are they recommendations to buy or sell any stocks. We create our content based on TIKR Terminal’s investment data and analysts’ estimates. Our analysis might not include recent company news or important updates. TIKR has no position in any stocks mentioned. Thank you for reading, and happy investing!