Identifying competitive moats is easy in theory and hard in practice. Everyone knows that companies with durable competitive advantages tend to generate superior returns over time. The challenge is separating real moats from narratives that sound compelling but do not hold up under scrutiny.
Most moat analysis relies too heavily on qualitative storytelling. A company has a strong brand, network effects, or switching costs, and investors assume those advantages are permanent. But competitive positions shift, brands lose relevance, and networks fragment. Switching costs fall as technology evolves. What looked like a wide moat five years ago can narrow quickly if the underlying drivers weaken.
The better approach combines qualitative assessment with quantitative validation. You start by identifying potential sources of competitive advantage, then look for evidence in the financials that those advantages actually translate into superior economics. High returns on capital, stable or expanding margins, pricing power through cycles, and sustained market share gains all signal that a moat exists and is holding.
TIKR gives you the data to test these hypotheses. You can track returns on invested capital over time, compare margin trends against peers, analyze pricing power through revenue per unit or average selling prices, and monitor customer concentration or churn through segment disclosures. This combination of qualitative and quantitative analysis helps you distinguish durable moats from temporary advantages.
Types of Competitive Moats
Moats come in different forms, and each leaves distinct fingerprints in the financials.
Economies of Scale. Companies with scale advantages spread fixed costs over larger revenue bases, allowing them to underprice competitors while maintaining higher margins. This shows up as expanding gross and operating margins as revenue grows, and market share gains that accelerate profitability rather than compress it. The key test is whether the company can maintain pricing discipline while growing faster than competitors.
Network Effects. Businesses where value increases with the number of users, such as marketplaces, social platforms, or payment networks, exhibit network effects. These show up as high incremental margins on new users, declining customer acquisition costs as the network scales, and user growth that accelerates rather than decelerates. The critical metric is whether engagement and monetization per user improve over time, not just whether the user base expands.
Brand Strength. Premium brands allow companies to charge higher prices for functionally similar products. This appears as consistently higher gross margins than competitors, pricing that holds or expands through downturns, and marketing efficiency that improves as brand equity builds. The test is whether the company can raise prices faster than inflation without losing market share.
Switching Costs. When customers face high costs to switch providers, whether through integration complexity, data migration, retraining, or contractual penalties, companies can retain customers and maintain pricing. This shows up as low churn rates, high gross retention, and stable or expanding margins even when growth slows. Revenue retention above 100% in software or multi-year contract renewals at stable pricing signals strong switching costs.
Regulatory Barriers. Licenses, patents, or regulatory approvals that limit competition create moats, but they are only durable if renewing or maintaining them does not require excessive capital or if the barriers are difficult for new entrants to replicate. These advantages often show up as stable market share and high ROIC in industries with otherwise commoditized products.
The mistake most investors make is assuming a moat exists solely because of a category. Not all brands have pricing power. Not all networks exhibit strong effects. Not all switching costs are high enough to matter. You need to validate each claimed advantage with data.
Estimate a company’s fair value instantly (Free with TIKR) >>>
Using Financial Metrics to Validate Moats
TIKR provides the historical and forward-looking data to test whether a company’s claimed competitive advantages translate into superior economics.

Return on Invested Capital Over Time. Navigate to the Ratios tab and examine ROIC trends over five to ten years. Companies with real moats should maintain ROIC well above their cost of capital, typically 15% or higher, across economic cycles. More importantly, ROIC should remain stable or improve as the business scales. Declining ROIC despite revenue growth suggests the moat is narrowing or that growth is coming from lower-return investments.

Gross Margin Stability and Expansion. Access the Detailed Financials tab and review gross margin trends over multiple years. Moats rooted in pricing power or cost advantages should produce stable or expanding gross margins. If gross margins compress as revenue grows, the company likely lacks pricing power or faces intensifying competition. Compare these trends against peers in the Competitors tab to see whether margin performance is company-specific or industry-wide.
Value any stock in less than 60 seconds with TIKR’s new Valuation Model (It’s free) >>>

Operating Leverage. Examine whether operating expenses grow more slowly than revenue. Companies with scale advantages should demonstrate improving operating margins as they grow, particularly in the 15% to 30% revenue growth range, where scale benefits typically kick in. If operating margins stay flat or decline despite strong revenue growth, the business may lack operating leverage or be investing heavily to defend its position.

Pricing Power Through Cycles. Use the Estimates tab to review revenue growth during periods of weak demand or economic downturns. Companies with strong moats often maintain revenue growth or pricing even when volumes decline, as customers continue paying for products or services they cannot easily replace. Compare this behavior to competitors to identify which companies have genuine pricing power.
Customer Concentration and Retention. While not always disclosed, segment data or revenue concentration metrics available in some filings can reveal customer stickiness. High revenue retention, particularly in subscription or contract-based businesses, signals strong switching costs. Look for this data in the Financials section under supplementary disclosures or in the Transcripts, where management discusses retention metrics.
Comparing Against Peers
Moat analysis is inherently relative. A company trading at 30x forward earnings might look expensive in isolation, but reasonable if peers consistently trade at 40x. TIKR’s Competitors tab allows you to benchmark valuation metrics across the peer group and identify outliers.
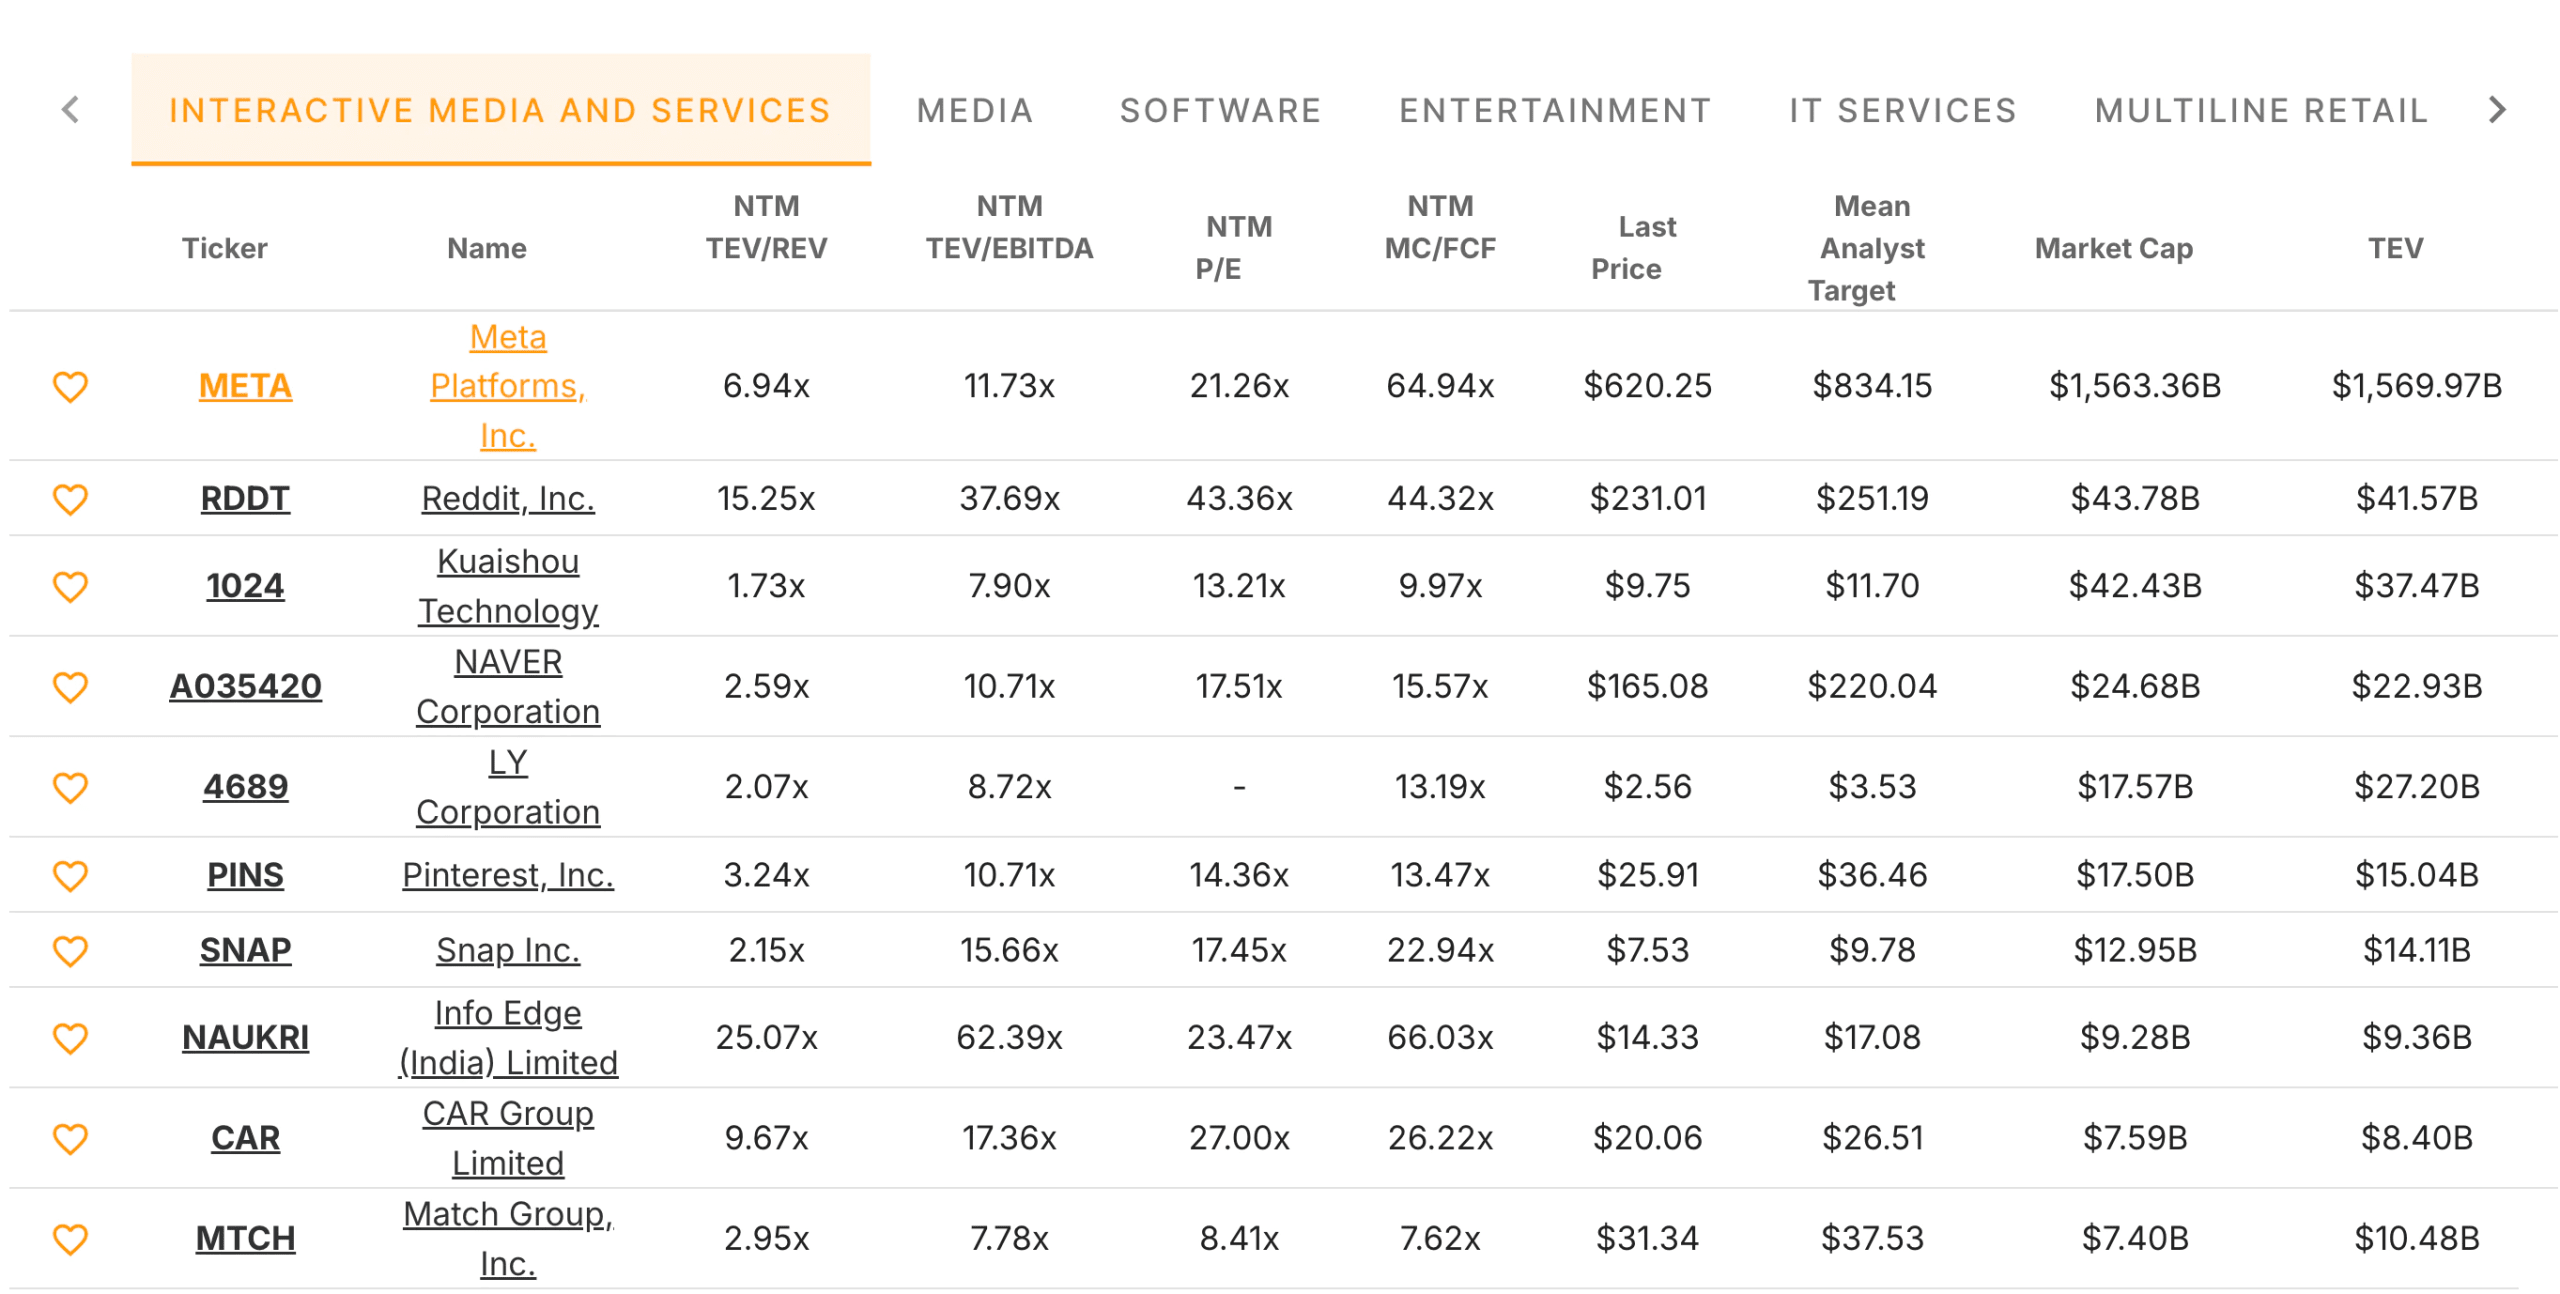
Start by comparing NTM P/E, TEV/EBITDA, and TEV/Revenue across the competitive set. Companies with true moats typically command premium valuations because the market expects them to sustain superior economics. If a company trades in line with or below its peers despite claims of competitive advantages, the market may not believe those advantages are durable or meaningful.
Next, compare MC/FCF (market cap to free cash flow) across competitors. This metric reveals how efficiently each company converts revenue into cash and how the market values that cash generation. A company trading at a lower MC/FCF multiple than its peers may be undervalued, or it may signal concerns about the sustainability of its cash flow.
Finally, examine the relationship between each competitor’s Last Price and Mean Analyst Target. Large discrepancies can reveal where analysts see opportunity or risk. A company trading well below its analyst target while peers trade near or above theirs may indicate hidden value or unrecognized competitive strength. Conversely, a company trading above target while peers trade below may suggest the market has already priced in optimistic assumptions about its moat.
Valuation premiums reflect market expectations about competitive positioning. Companies that consistently trade at higher multiples than peers likely have durable moats that the market believes. Those trading at discounts may have weaker moats than their narratives suggest, or they may represent opportunities where the market has not yet recognized their competitive strength.
Get the most up-to-date financial snapshots of thousands of stocks with TIKR (It’s free) >>>
Common Pitfalls in Moat Analysis
Confusing Size with Moat. Large companies are not necessarily protected. Scale is only a moat if it creates cost advantages or other barriers that smaller competitors cannot replicate. Check whether the largest player has superior margins and returns compared to smaller peers. If not, size alone is not a moat.
Assuming Past Moats Persist. Competitive advantages erode, and technology disrupts distribution. Regulations change. Customers’ preferences shift. A moat that existed five years ago may no longer protect the business today. Always validate that the moat is still producing superior returns and stable margins in recent periods, not just historically.
Ignoring Capital Requirements. Some moats require continuous capital investment to maintain. If a company must spend heavily on R&D, marketing, or capacity just to hold its position, the moat may be real but expensive to preserve. Check free cash flow relative to net income. If free cash flow is significantly lower due to high ongoing capex or R&D, the moat may not be as valuable as it appears.
Overweighting Narrative. Compelling stories about brand, innovation, or customer loyalty can obscure weak financials. If the narrative does not translate into superior ROIC, stable margins, or pricing power, the moat is probably weaker than management claims. Let the data lead, not the story.
Run a competitor analysis on TIKR for the top stocks in your portfolio (It’s free) >>>
The TIKR Takeaway
Competitive moats are not abstract concepts. There are economic advantages that show up in returns on capital, margins, pricing power, and market share trends. The companies with real moats consistently generate superior economics across cycles and relative to peers.
TIKR provides the financial data, peer comparisons, and historical trends needed to test whether a claimed moat actually exists. By tracking ROIC, margins, revenue trends, and competitive positioning over time, you can separate businesses with durable advantages from those relying on temporary tailwinds or compelling narratives.
Moat analysis is not about finding perfect businesses. It is about understanding which companies have structural advantages that allow them to compound capital at attractive rates over long periods. When you validate those advantages with data rather than accepting them on faith, you build a portfolio of businesses that can sustain performance regardless of what the market does in the short term.
Find undervalued stocks in less than 60 seconds with TIKR’s new Valuation Model (It’s free) >>>
Value Any Stock in Under 60 Seconds with TIKR
With TIKR’s new Valuation Model tool, you can estimate a stock’s potential share price in under a minute.
All it takes is three simple inputs:
- Revenue Growth
- Operating Margins
- Exit P/E Multiple
If you’re not sure what to enter, TIKR automatically fills in each input using analysts’ consensus estimates, giving you a quick, reliable starting point.
From there, TIKR calculates the potential share price and total returns under Bull, Base, and Bear scenarios so you can quickly see whether a stock looks undervalued or overvalued.
See a stock’s true value in under 60 seconds (Free with TIKR) >>>
Looking for New Opportunities?
- Discover which stocks billionaire investors are purchasing, so you can follow the smart money.
- Analyze stocks in as little as 5 minutes with TIKR’s all-in-one, easy-to-use platform.
- The more rocks you overturn… the more opportunities you’ll uncover. Search 100K+ global stocks, global top investor holdings, and more with TIKR.
Disclaimer:
Please note that the articles on TIKR are not intended to serve as investment or financial advice from TIKR or our content team, nor are they recommendations to buy or sell any stocks. We create our content based on TIKR Terminal’s investment data and analysts’ estimates. Our analysis might not include recent company news or important updates. TIKR has no position in any stocks mentioned. Thank you for reading, and happy investing!