
National Grid (NG) is best known for owning and operating electricity and gas networks in the UK and the US. The company manages critical transmission and distribution systems that support homes, businesses, and growing digital infrastructure. Its footprint includes both regulated operations and a portfolio of interconnectors and energy ventures. These assets provide stable revenue and long-term cash flow.
Find out what a stock’s really worth in under 60 seconds with TIKR’s new Valuation Model (It’s free)>>>
The company is preparing for a decade of heavier investment as electrification continues to increase, and new renewable sources need stronger grid connections. Data centres, transport, and heat systems are adding new loads as well. These conditions give National Grid a large, predictable pipeline of work that directly ties to regulated returns.
National Grid’s management continues to simplify the business as recent portfolio changes reduced exposure to non-core assets and increased focus on essential network operations. This shift frees capital for higher-priority projects and supports the company’s goal of delivering steady, low-volatility growth. It also creates a clearer strategic direction as demand for grid upgrades accelerates.
Quickly value any stock with TIKR’s powerful new Valuation Model (It’s free!) >>>
Financial Story
The half-year 2026 results show steady improvement in operating performance, with underlying operating profit increasing across several major segments, supported by regulated asset growth and strong investment activity. Cash generation remained healthy, helping fund ongoing projects across both regions. These trends reinforce the company’s expectations for consistent profit growth.
| Metric | HY2026 | YoY Change or Context | Notes |
|---|---|---|---|
| Underlying operating profit | £2,292m | Up 13 percent | Supported by regulated asset growth |
| Underlying EPS | 29.8p | Up 6 percent | Consistent with earnings guidance |
| Capital investment | £5,052m | Up 12 percent | Higher spending in UK and US networks |
| Dividend per share | 16.35p | Up 3.2 percent | In line with inflation linked policy |
| Cash generated from operations | £3.6bn | Stable | Supports investment and dividends |
| Net debt | £41.8bn | Higher due to capital spending | Managed through long term funding |
| UK Electricity Transmission profit | £846m | Up from £724m | Higher allowed revenues and project activity |
| US New York profit | £443m | Up from £276m | Strong recovery of past costs and asset growth |
| US New England profit | £292m | Up from £227m | Driven by investment and cost recovery |
Capital spending also continues to rise as the company invests heavily in transmission upgrades, reinforcement projects, and connection work in the UK and the US. This spending increases the size of the regulated asset base, which supports future earnings. The company expects this investment level to continue as grid demands expand throughout the decade.
Net debt rose due to the higher capital spend, but the balance sheet remains stable. National Grid funds its investment plan through long-term debt and careful project delivery timing. The dividend remains supported by predictable cash flow, and management continues to maintain its progressive policy. This creates a reliable profile for income-focused investors.
Look up National Grid’s full financial results & estimates (It’s free) >>>
Broader Market Context
Energy systems in the UK and the US are undergoing major upgrades as demand from electrification, renewable connections, and technology infrastructure continues to rise. These shifts require new capacity, stronger networks, and modernised systems. National Grid is one of the few companies positioned to deliver this scale of investment.
Regulators remain supportive of long-term infrastructure spending, and UK and US frameworks allow cost recovery and provide multi-year visibility on returns. This stability reduces earnings volatility and enables the company to plan years ahead. It also increases confidence that National Grid can execute its capital plan without major disruptions.
1. UK Networks Deliver Steady Growth
UK Electricity Transmission remains central to the company’s growth as investment continues across new lines, substations, and reinforcement projects. These upgrades support renewable integration and increase grid reliability. The regulated environment enables revenues to track spending, supporting predictable returns. This builds a strong base for long-term earnings.
UK Electricity Distribution performs a similar role. The segment continues to attract new connections and invests steadily in network health. The demand for local upgrades remains high, especially with the rise of electric vehicles and distributed energy. Cost control and stable allowance frameworks protect profitability. The segment gives National Grid a dependable source of regulated income.
2. US Operations Remain a Key Driver
US networks contribute a large share of group earnings. Customer demand continues to rise in both gas and electricity operations. These networks require regular upgrades, new connections, and long-term modernisation. National Grid is investing across multiple states to meet these needs. These investments create a clear path to steady revenue growth.
Regulators across New York and New England support the company’s long-term plans. Recent rate agreements provide visibility on the recovery of capital spending and operating costs. The US segment also benefits from a diversified regulatory base, which reduces risk. This stability makes the US operations a strong contributor to future earnings.
Value stocks like National Grid in less than 60 seconds with TIKR (It’s free) >>>
3. Capital Investments Support Future Returns
National Grid continues to increase capital investment across its core markets. These projects support grid expansion, renewable integration, and growing customer demand. Each year of investment expands the regulated asset base. This asset growth drives future increases in allowed returns. The cycle creates a stable foundation for multi-year profit growth.
The company manages capital spending carefully. Long-term debt supports project timing, while stable cash flow supports ongoing funding needs. This approach keeps credit strength intact. It also supports the progressive dividend policy. These factors help balance investment and income in a predictable way.
The TIKR Takeaway
National Grid continues to perform as a steady, low-volatility utility with predictable earnings. Growth comes from regulated asset expansion and consistent investment in electricity and gas networks. Cash flow remains strong and supports both capital plans and shareholder returns. The company provides a clear long-term outlook built on visible infrastructure spending.
The energy transition provides a long runway for growth. Rising demand from renewable connections, electrification, and digital infrastructure strengthens the investment case. National Grid’s scale and regulated frameworks create dependable conditions for long-term execution. The business is positioned to meet these needs while maintaining stable earnings.
Should You Buy, Sell, or Hold National Grid’s Stock in 2025?
National Grid provides reliable dividends and predictable profits. The stock fits investors who want steady income and moderate growth. The long-term outlook remains positive, supported by strong investment programs and a stable regulatory backdrop. The key areas to monitor are the execution of large projects and long-term capital costs.
How Much Upside Does National Grid Stock Have From Here?
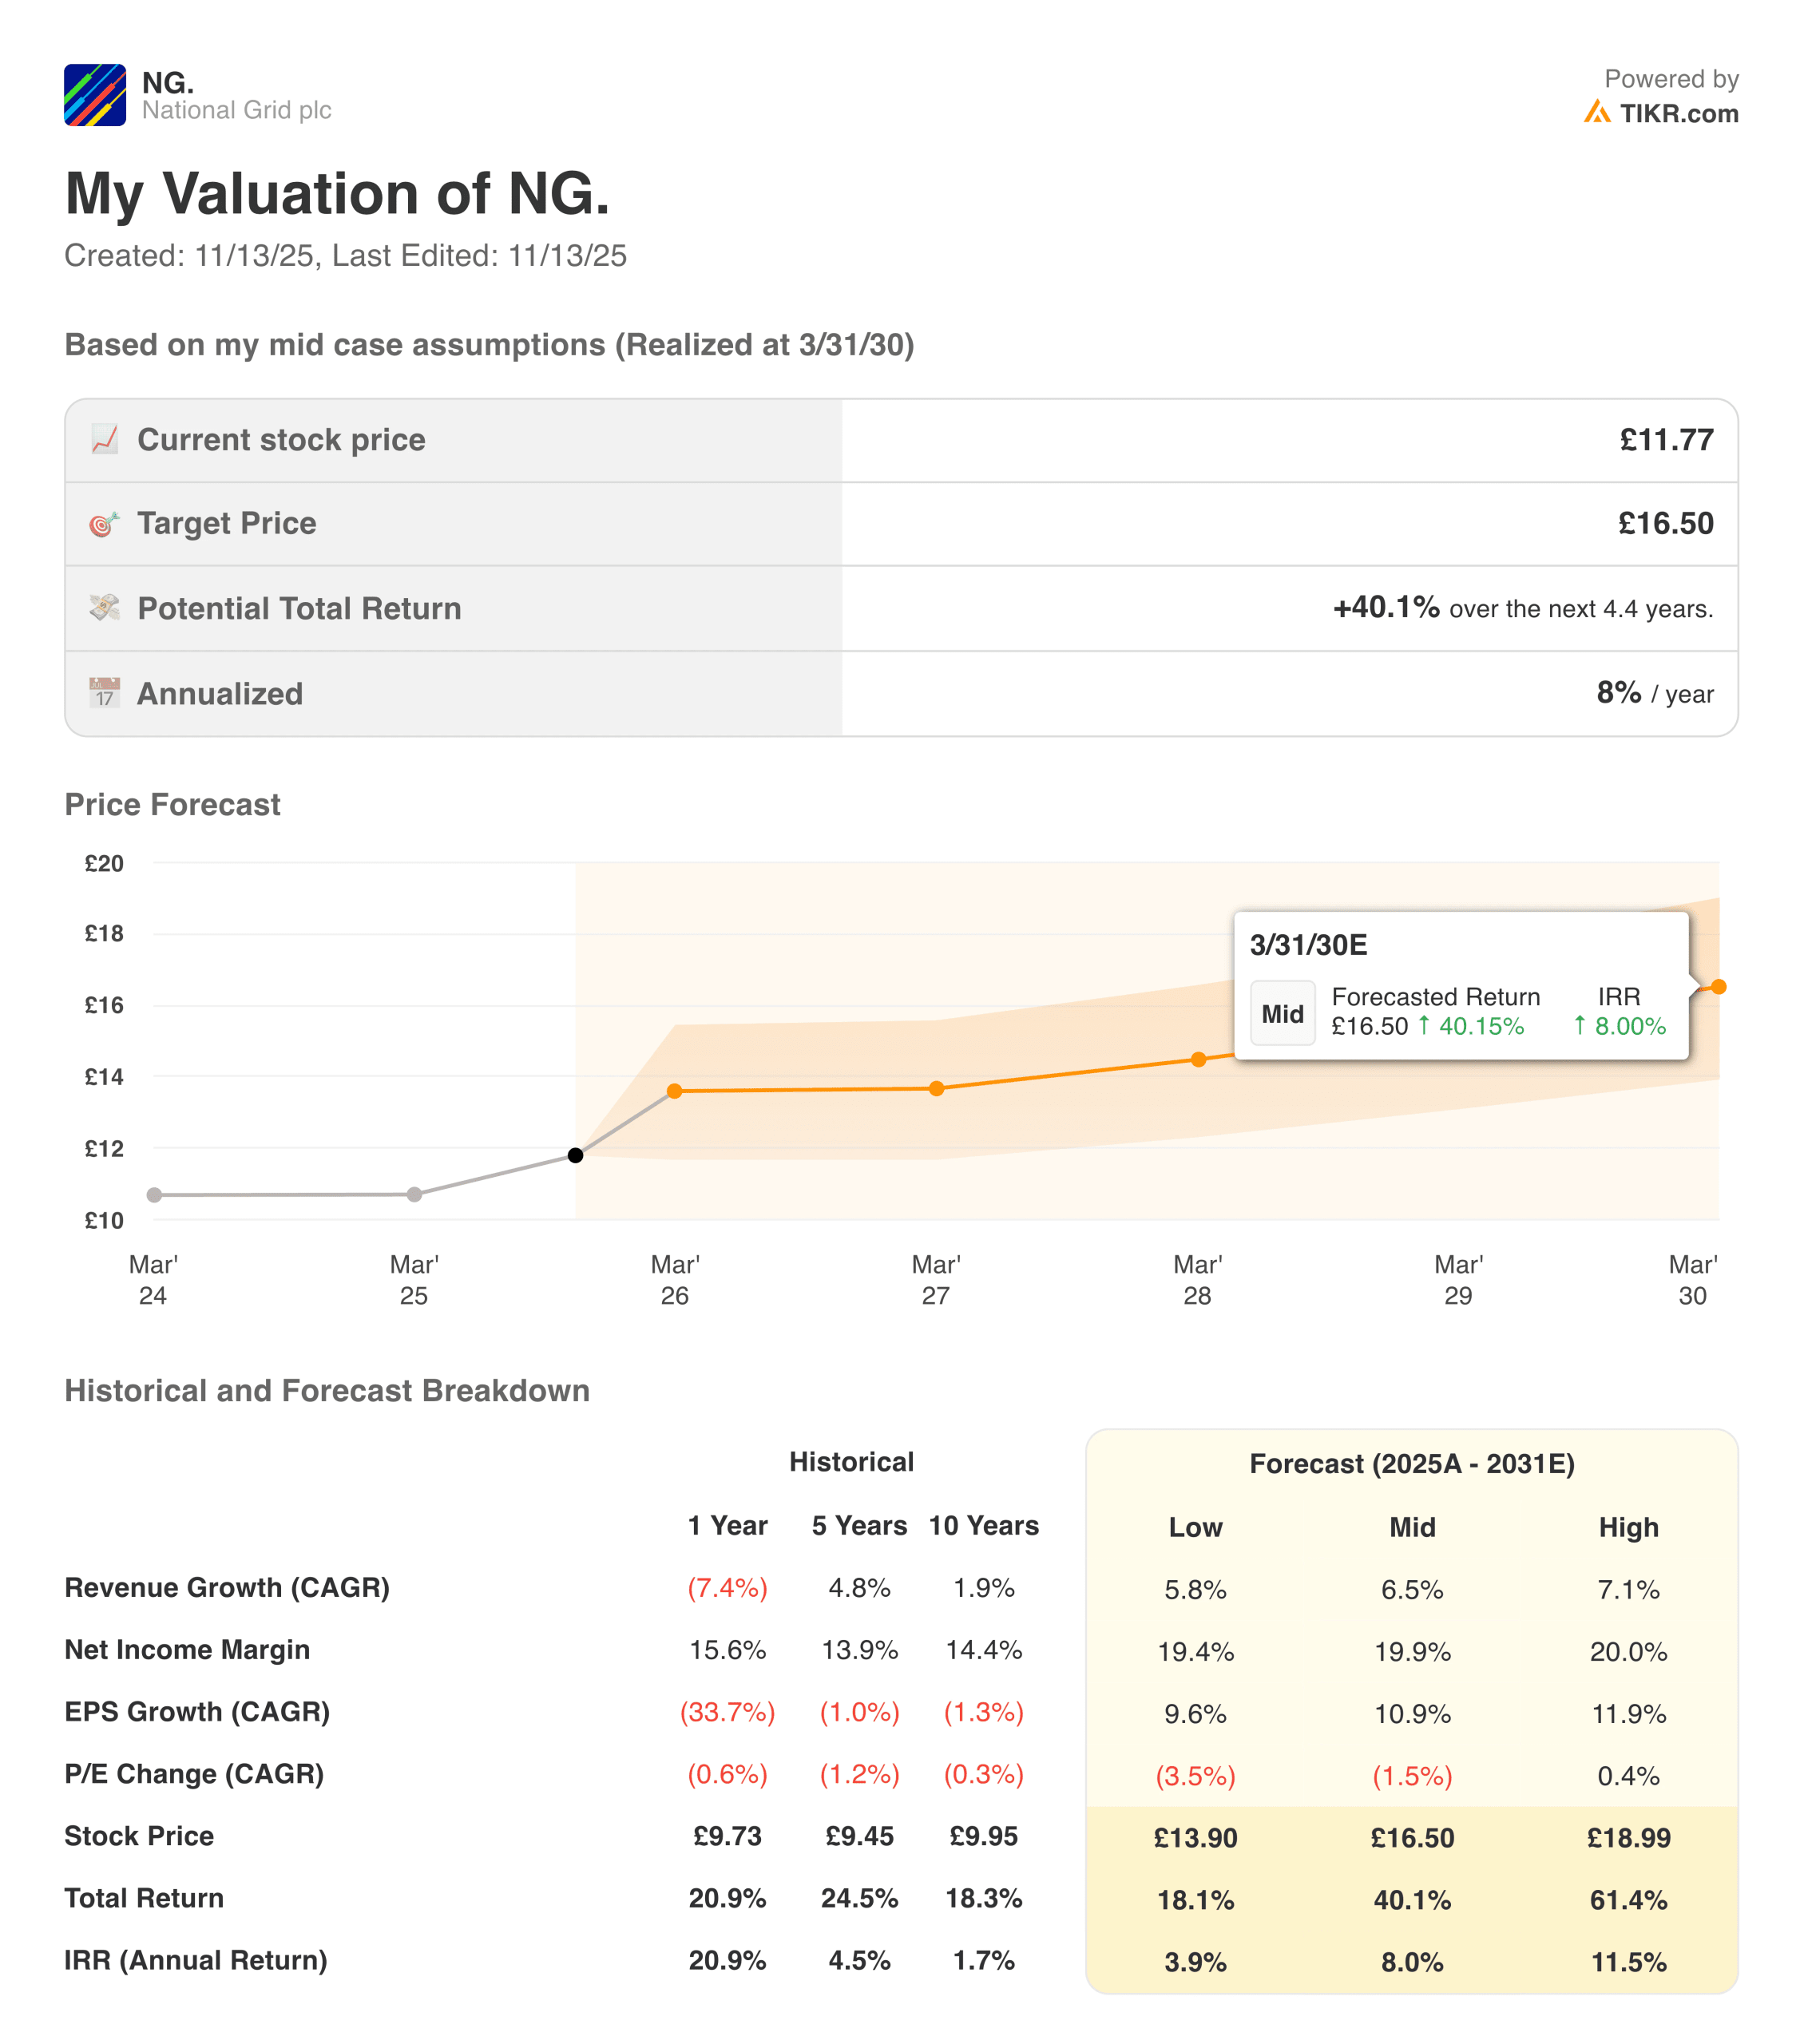
With TIKR’s new Valuation Model tool, you can estimate a stock’s potential share price in under a minute.
All it takes is three simple inputs:
- Revenue Growth
- Operating Margins
- Exit P/E Multiple
If you’re not sure what to enter, TIKR automatically fills in each input using analysts’ consensus estimates, giving you a quick, reliable starting point.
From there, TIKR calculates the potential share price and total returns under Bull, Base, and Bear scenarios so you can quickly see whether a stock looks undervalued or overvalued.
See a stock’s true value in under 60 seconds (Free with TIKR) >>>
Looking for New Opportunities?
- See what stocks billionaire investors are buying so you can follow the smart money.
- Analyze stocks in as little as 5 minutes with TIKR’s all-in-one, easy-to-use platform.
- The more rocks you overturn… the more opportunities you’ll uncover. Search 100K+ global stocks, global top investor holdings, and more with TIKR.
Disclaimer:
Please note that the articles on TIKR are not intended to serve as investment or financial advice from TIKR or our content team, nor are they recommendations to buy or sell any stocks. We create our content based on TIKR Terminal’s investment data and analysts’ estimates. Our analysis might not include recent company news or important updates. TIKR has no position in any stocks mentioned. Thank you for reading, and happy investing!