

Key Stats for Home Depot Stock
- Current Price: $334.28
- Target Price (Mid): ~$510
- Street Target: ~$370
- Potential Total Return: ~53%
- Annualized IRR: ~10% / year
- Earnings Reaction: +2.69% (May 19, 2026)
Now Live: Discover how much upside your favorite stocks could have using TIKR’s new Valuation Model (It’s free) >>>
What Happened?
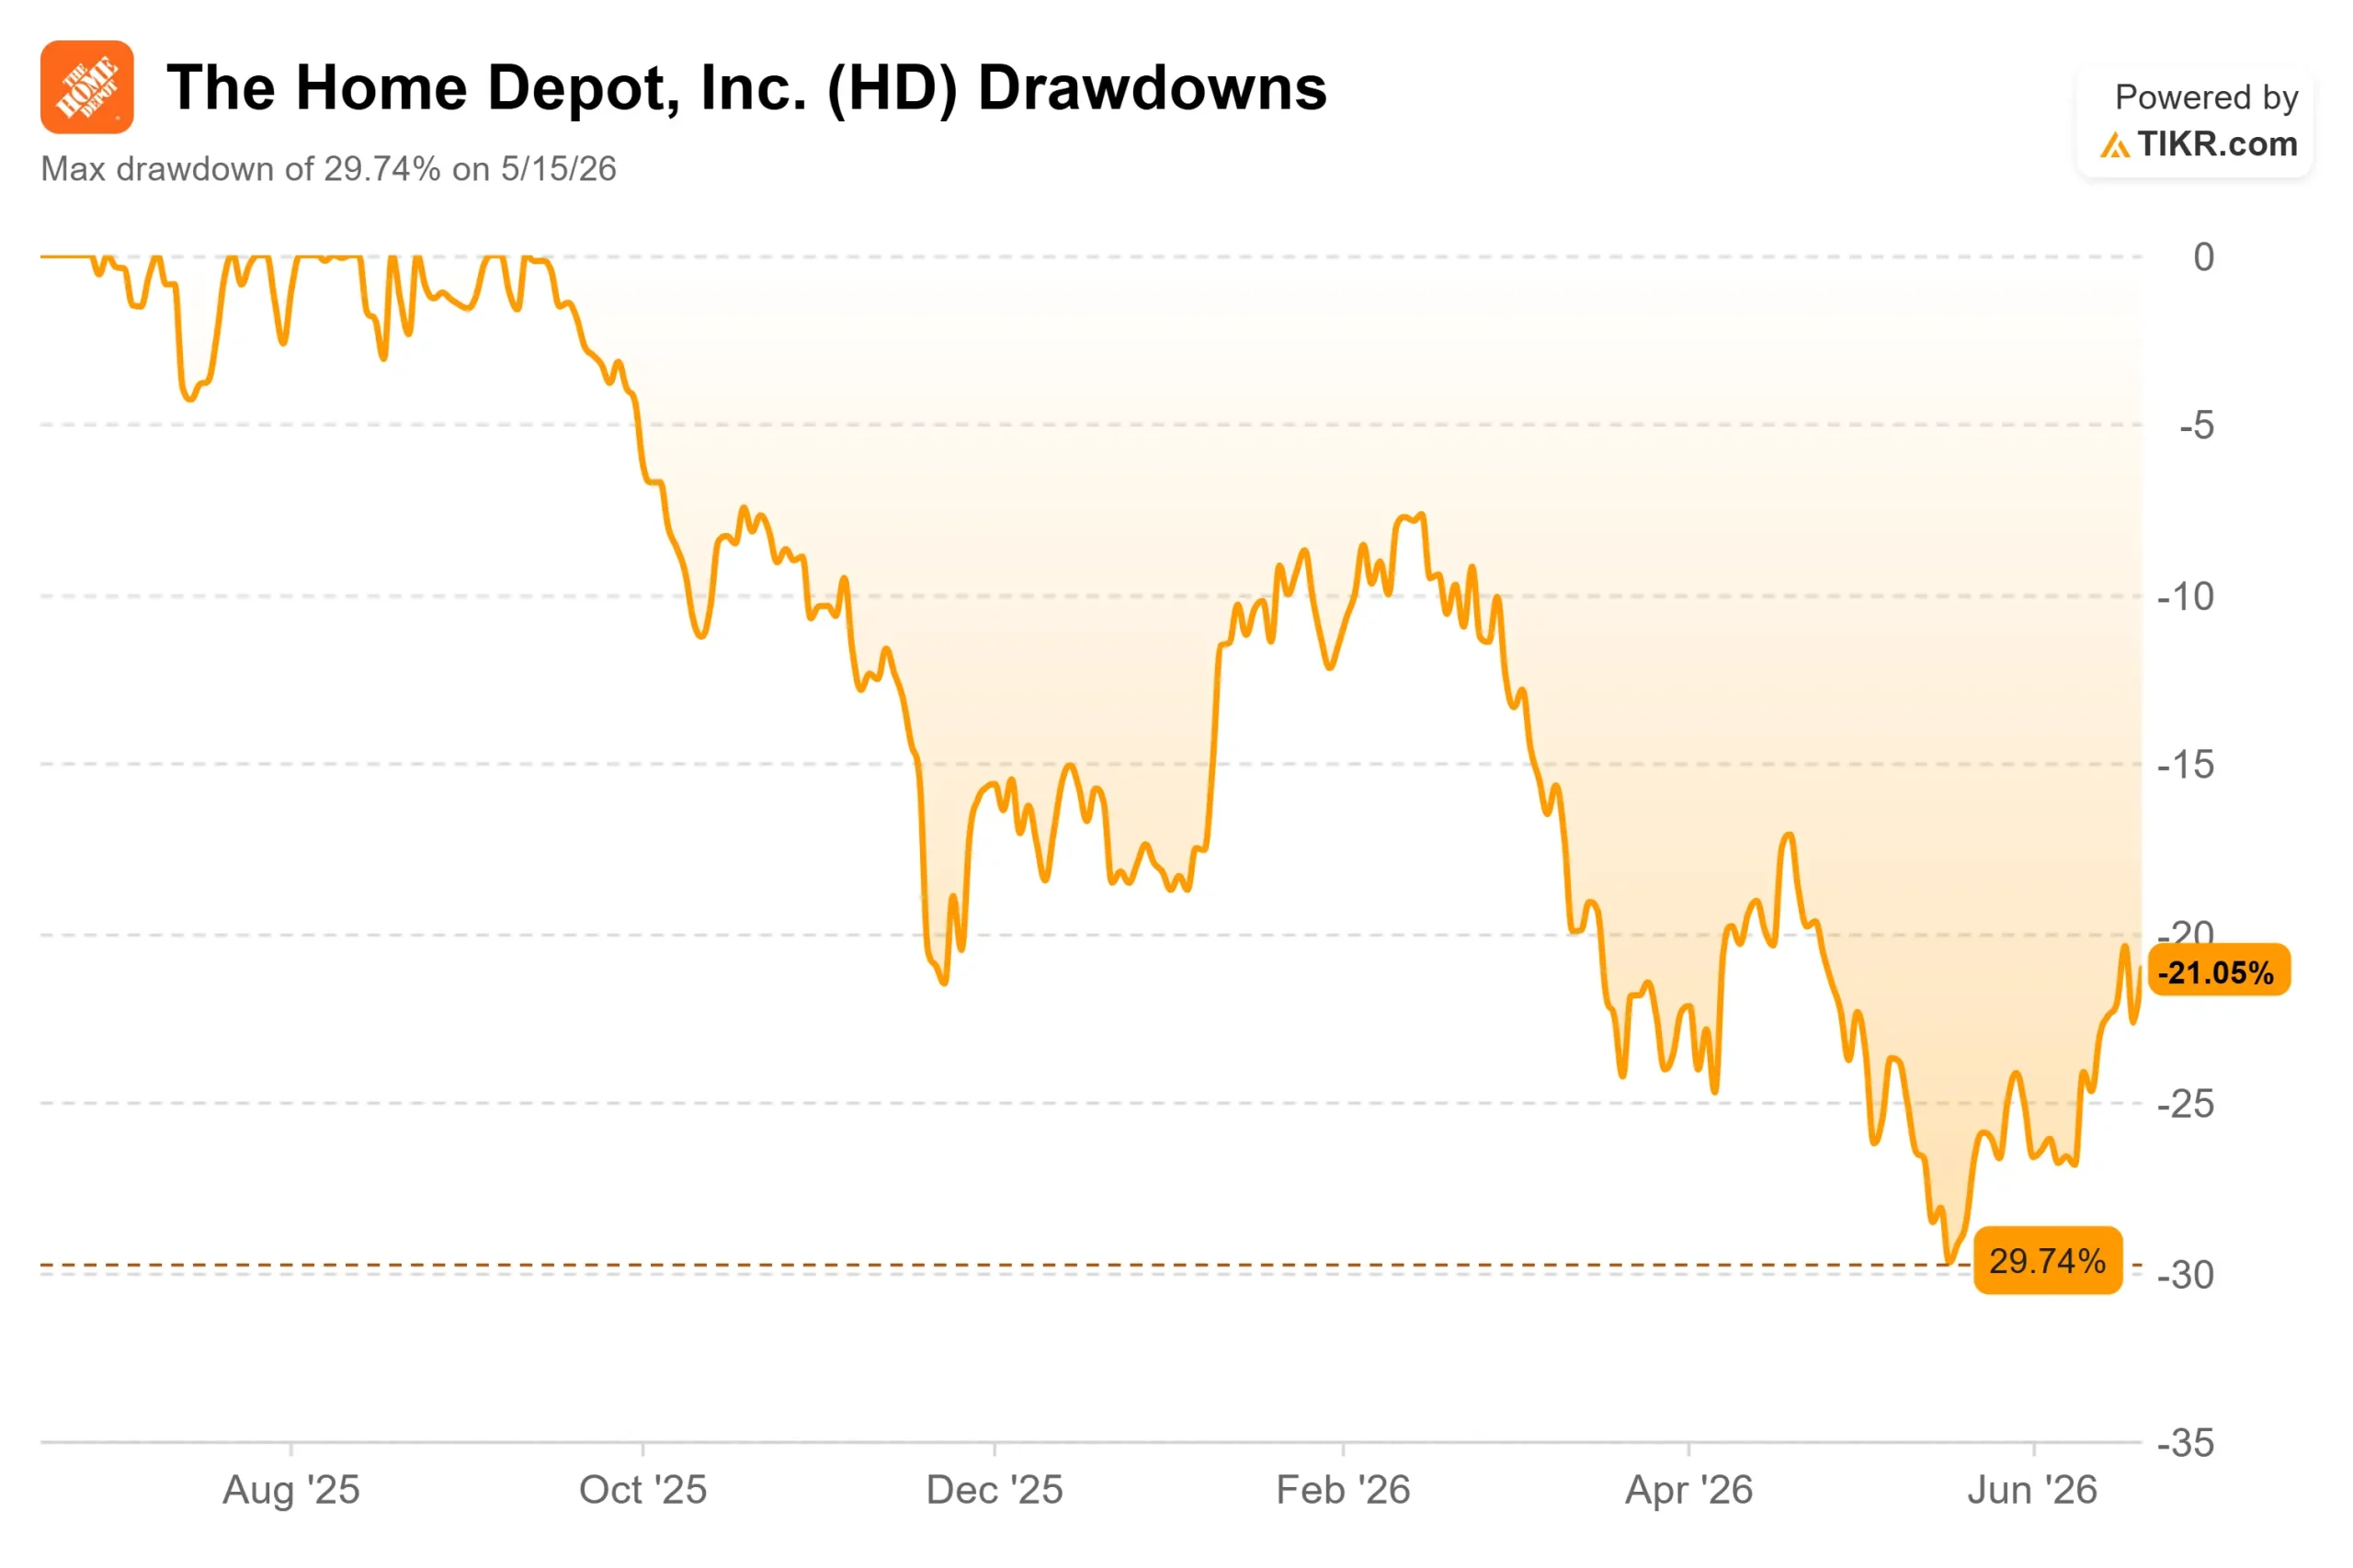
The Home Depot (HD) spent most of 2026 frustrating its shareholders, and then it quietly started to climb. The stock closed at $334.28 on June 18, up about 8% over two weeks after a slide that took it nearly 30% below its 52-week high of $426.75. That bounce raises a fair question: is the market seeing something it missed, or is this a reflex off an oversold low?
The answer has little to do with the thing investors keep watching. Bulls and bears have argued about mortgage rates for two years. But the real driver of Home Depot’s second-half setup is something management said plainly on the Q1 call, and it got buried under the macro noise.
The One Number Management Wants You to Watch
On the Q1 fiscal 2026 earnings call, an analyst asked CEO Ted Decker what would lift comps in the back half. His answer was direct: “We’re not looking at a marked improvement in underlying demand. We are looking at a higher comp in the second half of the year, and that is solely driven by a return to normal storm activity.” That reframes the stock. The expected improvement is storm normalization at SRS, Home Depot’s specialty distribution arm that sells roofing, building materials, and HVAC to professional contractors.
Here is why it matters. SRS roofing demand spikes when storms damage homes and collapses when the weather is calm. The back half of 2025 saw some of the lowest recorded storm activity on record, which gutted roofing volumes. CFO Richard McPhail said that if SRS sees a normal seasonal storm curve, the business should deliver mid-single-digit positive organic growth for the year. The recovery depends on weather reverting to average, not on the Fed.
The engine underneath is working. Total sales rose 4.8% to $41.8 billion, and while the headline comp was just 0.6%, that number understates the business. Nine of 16 departments posted positive comps, big-ticket transactions over $1,000 grew 0.8%, Pro outperformed DIY, and online sales rose more than 10% for the fourth straight quarter.
See historical and forward estimates for Home Depot stock (It’s free!) >>>
Why the Margin Story Is Temporary
The bears have a real point. Home Depot’s operating margin fell to 11.9% in Q1 from 12.9% a year earlier, and gross margin slipped about 75 basis points to 33%. That looks like deterioration until you trace the cause. McPhail said the vast majority of the decline reflects the inclusion of GMS, the interior building products distributor, which carries lower profit margins than core retail. He expects the gap to narrow meaningfully in the back half as that comparison normalizes.
This is a mix effect, not a profitability problem. Management reaffirmed full-year gross margin guidance of around 33.1%. The honest risk is timing: if mortgage rates stay high and housing turnover stays frozen through 2027, big-ticket demand stays suppressed, and the comp recovery slips. Even then, Home Depot generated about $10.1 billion in trailing free cash flow, which funds the 2.9% dividend yield and the roughly $2.3 billion it paid in dividends in Q1 alone.
Valuation sits in this tension. Home Depot trades at 15.27x NTM EV/EBITDA, a discount to housing-insulated peers like TJX Companies at 20.77x and Ross Stores at 19.64x, per TIKR’s Competitors page. That 4-to-5-turn gap reflects the housing cycle weighing on HD, not a weaker franchise. Whether the discount is justified comes down to one belief: that the Pro business keeps compounding while the market waits. The Street is cautiously on board, with a mean target of around $370.

See how Home Depot performs against its peers in TIKR (It’s free!) >>>
TIKR Advanced Model Analysis
- Current Price: $334.28
- Target Price (Mid): ~$510
- Potential Total Return: ~53%
- Annualized IRR: ~10% / year

See analysts’ growth forecasts and price targets for Home Depot stock (It’s free!) >>>
Using TIKR’s mid-case, the model values Home Depot at around $510 by January 2031, about 53% total return, and a roughly 10% annualized IRR. The two revenue CAGR drivers are organic Pro share gains in the retail stores and mid-single-digit organic growth at SRS as storm comparisons normalize. The margin driver is gross margin recovery as the GMS drag clears. The primary risk is a prolonged housing lock-in that suppresses large-project demand through 2027.
The model assumes a revenue CAGR of around 3% and a net income margin of around 9.5%, with the multiple drifting modestly lower. The return comes from compounding earnings and the dividend, not a re-rating. The upside case runs near $770 if storm activity normalizes alongside housing; the downside case sits near $530 if turnover stays frozen.
Conclusion
The next test is the Q2 fiscal 2026 results in August. Watch the SRS organic growth line and the storm commentary, because that is where the second-half thesis lives or dies. “Good” looks like SRS organic growth turning solidly positive and management holding the flat-to-2% full-year comp guide. “Bad” looks like roofing staying negative on another quarter of calm weather, which would push the recovery into 2027. Housing is the long-term swing factor, but near-term, this is a bet on the weather reverting to average. That is a stranger thesis than the bulls admit, and a more checkable one than the bears allow.
See what stocks billionaire investors are buying so you can follow the smart money with TIKR.
Should You Invest in Home Depot?
The only way to really know is to look at the numbers yourself. TIKR gives you free access to the same institutional-quality financial data that professional analysts use to answer exactly that question.
Pull up Home Depot, and you’ll see years of historical financials, what Wall Street analysts expect for revenue and earnings in the quarters ahead, how valuation multiples have moved over time, and whether price targets are trending up or down.
You can build a free watchlist to track Home Depot alongside every other stock on your radar. No credit card required. Just the data you need to decide for yourself.
Analyze Home Depot on TIKR Free →
Looking for New Opportunities?
- See what stocks billionaire investors are buying so you can follow the smart money.
- Analyze stocks in as little as 5 minutes with TIKR’s all-in-one, easy-to-use platform.
- The more rocks you overturn… the more opportunities you’ll uncover. Search 100K+ global stocks, global top investor holdings, and more with TIKR.
Disclaimer:
Please note that the articles on TIKR are not intended to serve as investment or financial advice from TIKR or our content team, nor are they recommendations to buy or sell any stocks. We create our content based on TIKR Terminal’s investment data and analysts’ estimates. Our analysis might not include recent company news or important updates. TIKR has no position in any stocks mentioned. Thank you for reading, and happy investing!


