Key Takeaways:
- Leadership Transition: Fastenal stock enters 2026 amid a CEO change in July, reinforcing strategic continuity after $8 billion in annual revenue.
- Earnings Snapshot: Fastenal stock posted $2 billion in quarterly revenue with 21% EBITDA margins, reflecting resilient demand despite tariff and volume pressure.
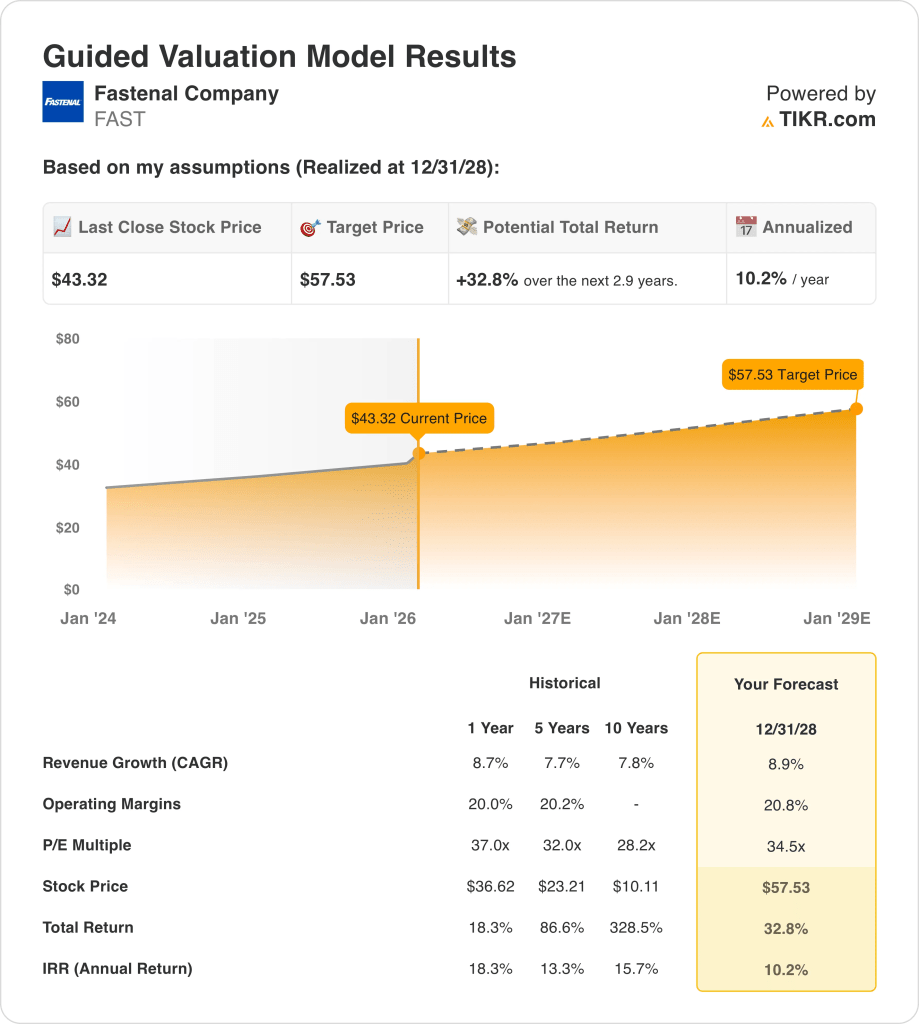
- Price Outlook: Based on 9% revenue growth and 21% operating margins, Fastenal stock could reach $57 by December 2028.
- Upside Math: That target implies 33% total upside from the current $43 price, translating to a 10% annualized return over 3 years.
Fastenal Company (FAST) distributes industrial and construction supplies globally, holding scale advantages across manufacturing, construction, and government customers after nearly 60 years.
Last week, Fastenal reported $8 billion in LTM revenue, supported by double-digit daily sales growth across manufacturing markets.
Fastenal generates about $2 billion in annual profit, with 21% operating margins reflecting pricing discipline and branch-driven efficiency.
The company’s $25 billion market capitalization reflects expectations for steady growth from contract customers, eCommerce expansion, and managed inventory programs.
Despite stable margins and a $57 valuation, Fastenal trades near $43, highlighting tension between execution strength and cautious pricing.
What the Model Says for FAST Stock
We analyzed Fastenal stock using assumptions tied to its distribution scale, contract penetration, and stable cash returns across industrial cycles.
Based on 8.9% revenue growth, 20.8% operating margins, and a 34.5x exit multiple, the model points to $57.53.
That implies 32.8% total upside, or a 10.2% annualized return over roughly 2.9 years.
Our Valuation Assumptions
TIKR’s Valuation Model lets you plug in your own assumptions for a company’s revenue growth, operating margins, and P/E multiple, and calculates the stock’s expected returns.
Here’s what we used for FAST stock:
1. Revenue Growth: 8.9%
Fastenal generated steady growth historically, with revenue rising at roughly 8% annually over the past decade through industrial cycles.
Recent execution reflects continued demand from manufacturing and construction customers, supported by managed inventory programs and expanding national account penetration.
Forward growth depends on industrial stability, contract pricing discipline, and vending adoption, constrained by tariffs and softer macro demand.
According to consensus analyst estimates, an 8.9% revenue growth assumption reflects durable share gains balanced against normalized industrial demand conditions.
2. Operating Margins: 20.8%
Fastenal has maintained operating margins around 20% historically, reflecting scale advantages, dense branch networks, and efficient distribution economics.
Margins remained resilient despite recent demand volatility, supported by pricing discipline, private-label mix, and productivity across selling and logistics infrastructure.
Upside requires sustained volume leverage and cost control, while downside risk stems from pricing competition and weaker manufacturing utilization.
In line with analyst consensus projections, operating margins near 20.8% represent normalized profitability without assuming peak-cycle efficiency.
3. Exit P/E Multiple: 34.5x
Fastenal has historically traded between 28x and 37x earnings during periods of steady growth and strong returns on capital.
Current valuation reflects investor confidence in cash generation and consistency, tempered by cautious sentiment around industrial demand and leadership transition timing.
The multiple assumes earnings durability and margin stability, but not a return to cycle highs seen during stronger manufacturing expansions.
Based on street consensus estimates, a 34.5x exit multiple balances Fastenal’s premium quality profile with restrained expectations for industrial growth normalization.
What Happens If Things Go Better or Worse?
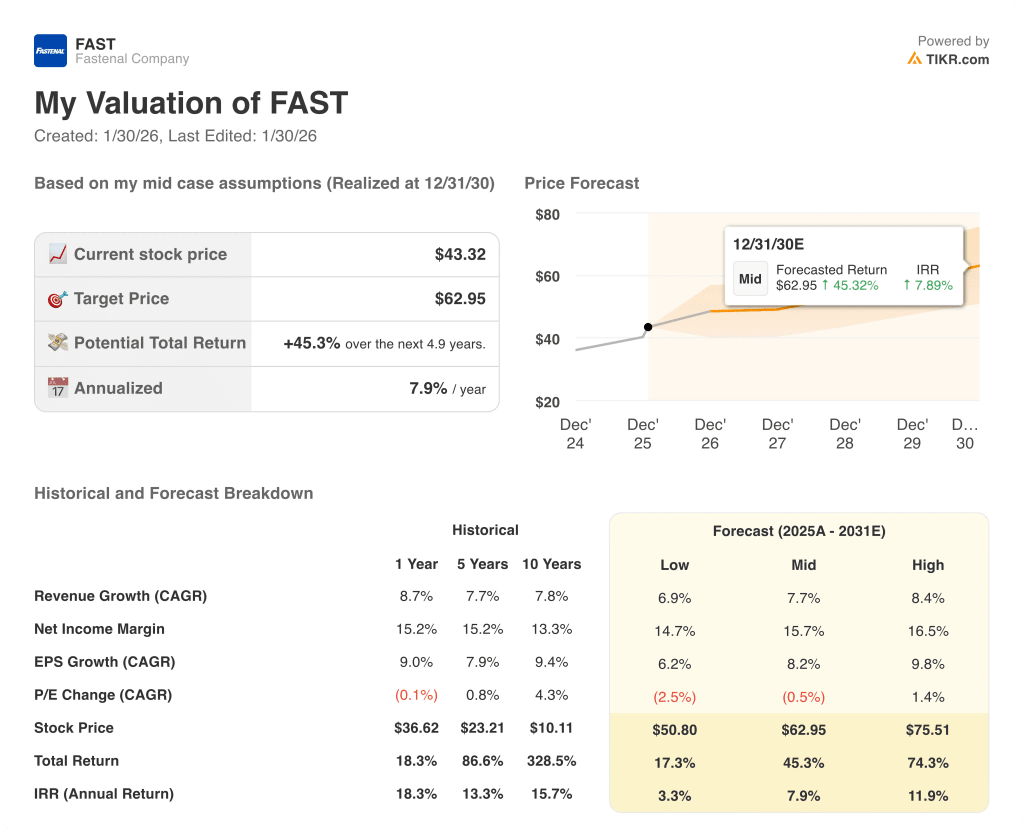
Fastenal’s outcomes depend on industrial demand, contract penetration, and cost discipline, setting up a range of execution paths through 2030.
- Low Case: If manufacturing softens and pricing tightens, revenue grows around 6.9% and margins stay near 14.7% → 3.3% annualized return.
- Mid Case: With core distribution execution holding steady, revenue growth near 7.7% and margins improve toward 15.7% → 7.9% annualized return.
- High Case: If onsite and vending programs scale faster, revenue reaches about 8.4% and margins approach 16.5% → 11.9% annualized return.
The $63 mid-case target price is achievable through steady execution and cost control, without multiple expansion or market hype.
How Much Upside Does It Have From Here?
With TIKR’s new Valuation Model tool, you can estimate a stock’s potential share price in under a minute.
All it takes is three simple inputs:
- Revenue Growth
- Operating Margins
- Exit P/E multiple
If you’re not sure what to enter, TIKR automatically fills in each input using analysts’ consensus estimates, giving you a quick, reliable starting point.
From there, TIKR calculates the potential share price and total returns under Bull, Base, and Bear scenarios so you can quickly see whether a stock looks undervalued or overvalued.
Looking for New Opportunities?
- See what stocks billionaire investors are buying so you can follow the smart money.
- Analyze stocks in as little as 5 minutes with TIKR’s all-in-one, easy-to-use platform.
- The more rocks you overturn… the more opportunities you’ll uncover. Search 100K+ global stocks, global top investor holdings, and more with TIKR.
Disclaimer:
Please note that the articles on TIKR are not intended to serve as investment or financial advice from TIKR or our content team, nor are they recommendations to buy or sell any stocks. We create our content based on TIKR Terminal’s investment data and analysts’ estimates. Our analysis might not include recent company news or important updates. TIKR has no position in any stocks mentioned. Thank you for reading, and happy investing!