Key Takeaways:
- Sanofi is sharpening its focus on higher‑growth specialty medicines and vaccines while preparing to separate its Consumer Healthcare business, aiming to drive more consistent growth and margins from a streamlined portfolio.
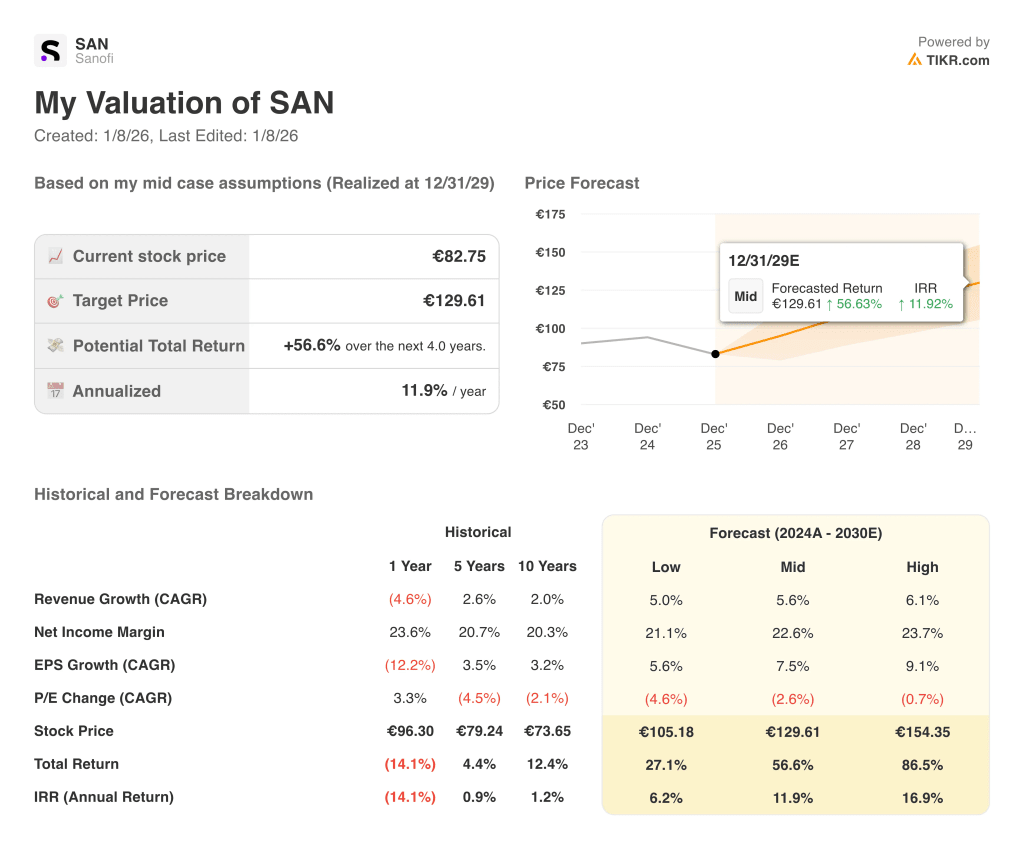
- SAN stock could reasonably reach €106 per share by December 2027 and €130 per share by December 2029, based on our valuation assumptions.
- This implies a total return of 28.0% through 2027 and 56.6% through 2029 from today’s price of €83, with annualized returns of 13.03% and 11.9% over the next 2.0 and 4.0 years, respectively.
Sanofi (SAN) is a global healthcare company with a broad portfolio spanning specialty care, vaccines, and consumer health products. The company is now prioritizing innovative medicines and vaccines while moving to spin off Consumer Healthcare to improve focus, efficiency, and long‑term earnings growth.
The stock has experienced mixed performance in recent years, reflecting both its defensive profile and investor concerns about litigation, R&D productivity, and near‑term margin pressure.
However, Sanofi’s strong balance sheet, durable cash flows, and leading positions in key therapeutic areas give it a solid foundation to deliver attractive total returns as new launches and cost measures ramp up.
Here’s why Sanofi stock could continue to reward shareholders through 2029, driven by a combination of earnings growth, dividends, and a more focused business mix.
What the Model Says for Sanofi Stock
We analyzed the upside potential for Sanofi stock using valuation assumptions based on its diversified portfolio of specialty medicines and vaccines, its leading position in immunology with Dupixent, and ongoing efforts to simplify the group through the planned Consumer Healthcare spin‑off.
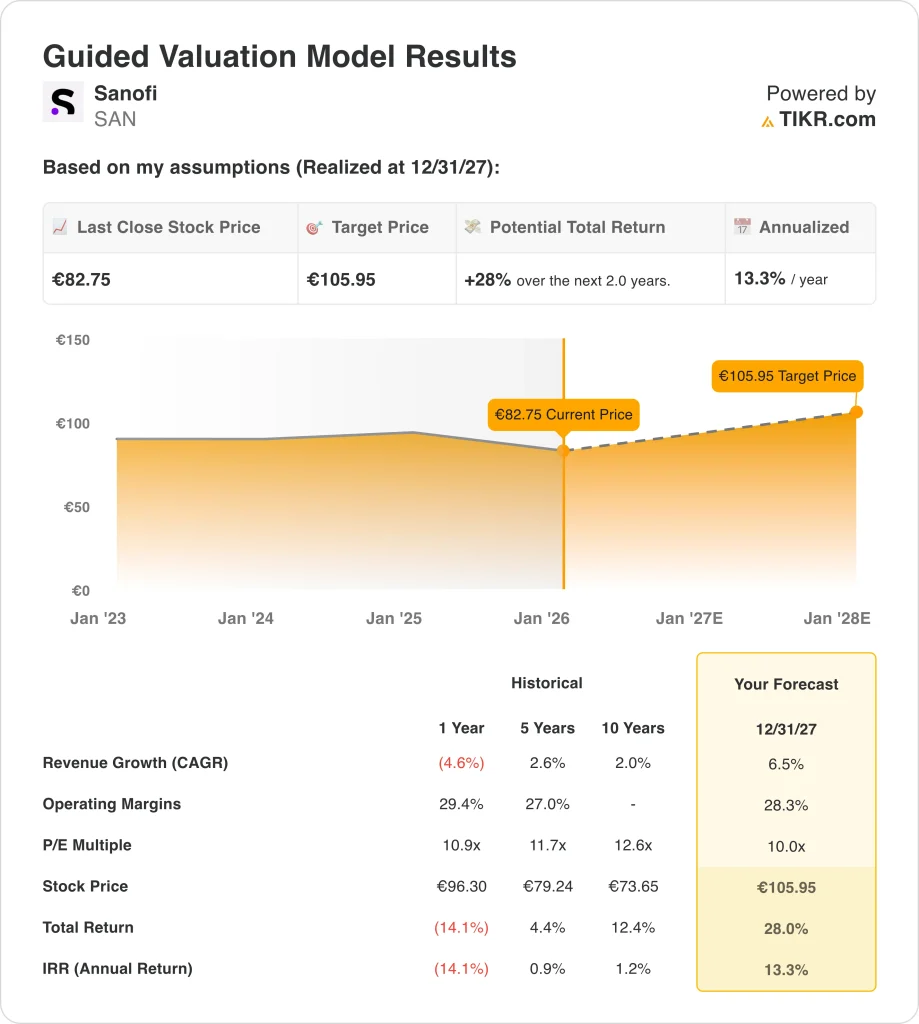
Based on estimates of 6.5% annual revenue growth, 28.3% net income margins, and a normalized exit P/E multiple of 10x, the model projects Sanofi stock could rise from €83 to €106 per share in the next 2 years.
That would be a 28% total return, or a 13.3% annualized return over the next 2 years.
Our Valuation Assumptions
TIKR’s Valuation Model lets you plug in your own assumptions for a company’s revenue growth, operating margins, and P/E multiple, and calculates the stock’s expected returns.
Here’s what we used for Sanofi stock:
1. Revenue Growth: 6.5%
Sanofi’s revenue has shown moderate growth over time, with a 10‑year revenue CAGR of 2.0% and a 5‑year CAGR of 2.6%, while the most recent year posted a –4.6% decline as the company navigated portfolio transitions and loss‑of‑exclusivity headwinds.
Looking ahead, growth drivers include the continued expansion of Dupixent in immunology, a strong vaccines franchise benefiting from rising global demand, and contributions from the specialty‑care pipeline.
Based on analysts’ consensus estimates, we used a 6.5% revenue growth forecast from 2024 through 2030, with a low case of 5.0% and a high case of 6.1%. This reflects expectations that specialty medicines and vaccines will accelerate top‑line growth, offsetting pressure from patent expirations and the planned separation of Consumer Healthcare.
2. Operating Margins: 28.3%
Sanofi has delivered solid profitability over time, with operating margins of 27.0% over 5 years, and 29.4% in the most recent year. The company benefits from high‑margin biologics like Dupixent and a large vaccines business, although it has also been increasing R&D investment to support its pipeline.
In our 2024 to 2030 forecast, based on analysts’ consensus estimates, we use a mid‑case operating margin of 28.3% assuming that higher R&D spend and restructuring costs will be offset by improving product mix, ongoing efficiency programs, and the eventual separation of the lower‑margin Consumer Healthcare unit.
3. Exit P/E Multiple: 10x
Sanofi’s valuation has fluctuated over time, with the P/E multiple declining at a -4.6% CAGR over the last year but minimally rising at 2.6% and 2.0% CAGRs over the past 5 and 10 years, respectively. The stock currently trades around 10.1x earnings, compared with 11.7x over 5 years and 12.6x over 10 years.
Based on analysts’ consensus estimates, our model assumes an exit multiple of 10x by December 2027, which embeds a conservative view on valuation while still allowing earnings growth to drive attractive total returns for shareholders.
Build your own Valuation Model to value any stock (It’s free!) >>>
What Happens If Things Go Better or Worse?
Different scenarios for SAN stock through 2030 show varied outcomes based on execution on cost savings, growth in Africa & the Middle East, and the stability of competitive dynamics in core European markets (these are estimates, not guaranteed returns):
- Low Case: More muted growth and weaker margin expansion → 6.2% annual returns
- Mid Case: Solid contribution from key drugs and vaccines with steady efficiency gains → 11.9% annual returns
- High Case: Stronger‑than‑expected uptake of new launches and sustained premium margins → 16.9% annual returns
These scenarios highlight how much of Sanofi’s potential value creation depends on execution: delivering on its pipeline, managing pricing and regulatory risk, and successfully executing the Consumer Healthcare separation.
Even so, the modeling suggests that the stock can offer attractive returns in a range of outcomes, helped by its diversified portfolio, strong cash generation, and shareholder‑friendly capital allocation.
SAN Stock Valuation Model (TIKR)
See what analysts think about SAN stock right now (Free with TIKR) >>>
How Much Upside Does Sanofi Stock Have From Here?
With TIKR’s new Valuation Model tool, you can estimate a stock’s potential share price in under a minute.
All it takes is three simple inputs:
- Revenue Growth
- Operating Margins
- Exit P/E Multiple
If you’re not sure what to enter, TIKR automatically fills in each input using analysts’ consensus estimates, giving you a quick, reliable starting point.
From there, TIKR calculates the potential share price and total returns under Bull, Base, and Bear scenarios so you can quickly see whether a stock looks undervalued or overvalued.
See a stock’s true value in under 60 seconds (Free with TIKR) >>>
Looking for New Opportunities?
- See what stocks billionaire investors are buying so you can follow the smart money.
- Analyze stocks in as little as 5 minutes with TIKR’s all-in-one, easy-to-use platform.
- The more rocks you overturn… the more opportunities you’ll uncover. Search 100K+ global stocks, global top investor holdings, and more with TIKR.
Disclaimer:
Please note that the articles on TIKR are not intended to serve as investment or financial advice from TIKR or our content team, nor are they recommendations to buy or sell any stocks. We create our content based on TIKR Terminal’s investment data and analysts’ estimates. Our analysis might not include recent company news or important updates. TIKR has no position in any stocks mentioned. Thank you for reading, and happy investing!