
Key Stats for Dave Stock
- YTD Price Change for Dave stock: 150%
- $DAVE Share Price as of Dec. 23: $221
- 52-Week High: $286
- $DAVE Stock Price Target: $1306
Now Live: Discover how much upside your favorite stocks could have using TIKR’s new Valuation Model (It’s free)>>>
What Happened?
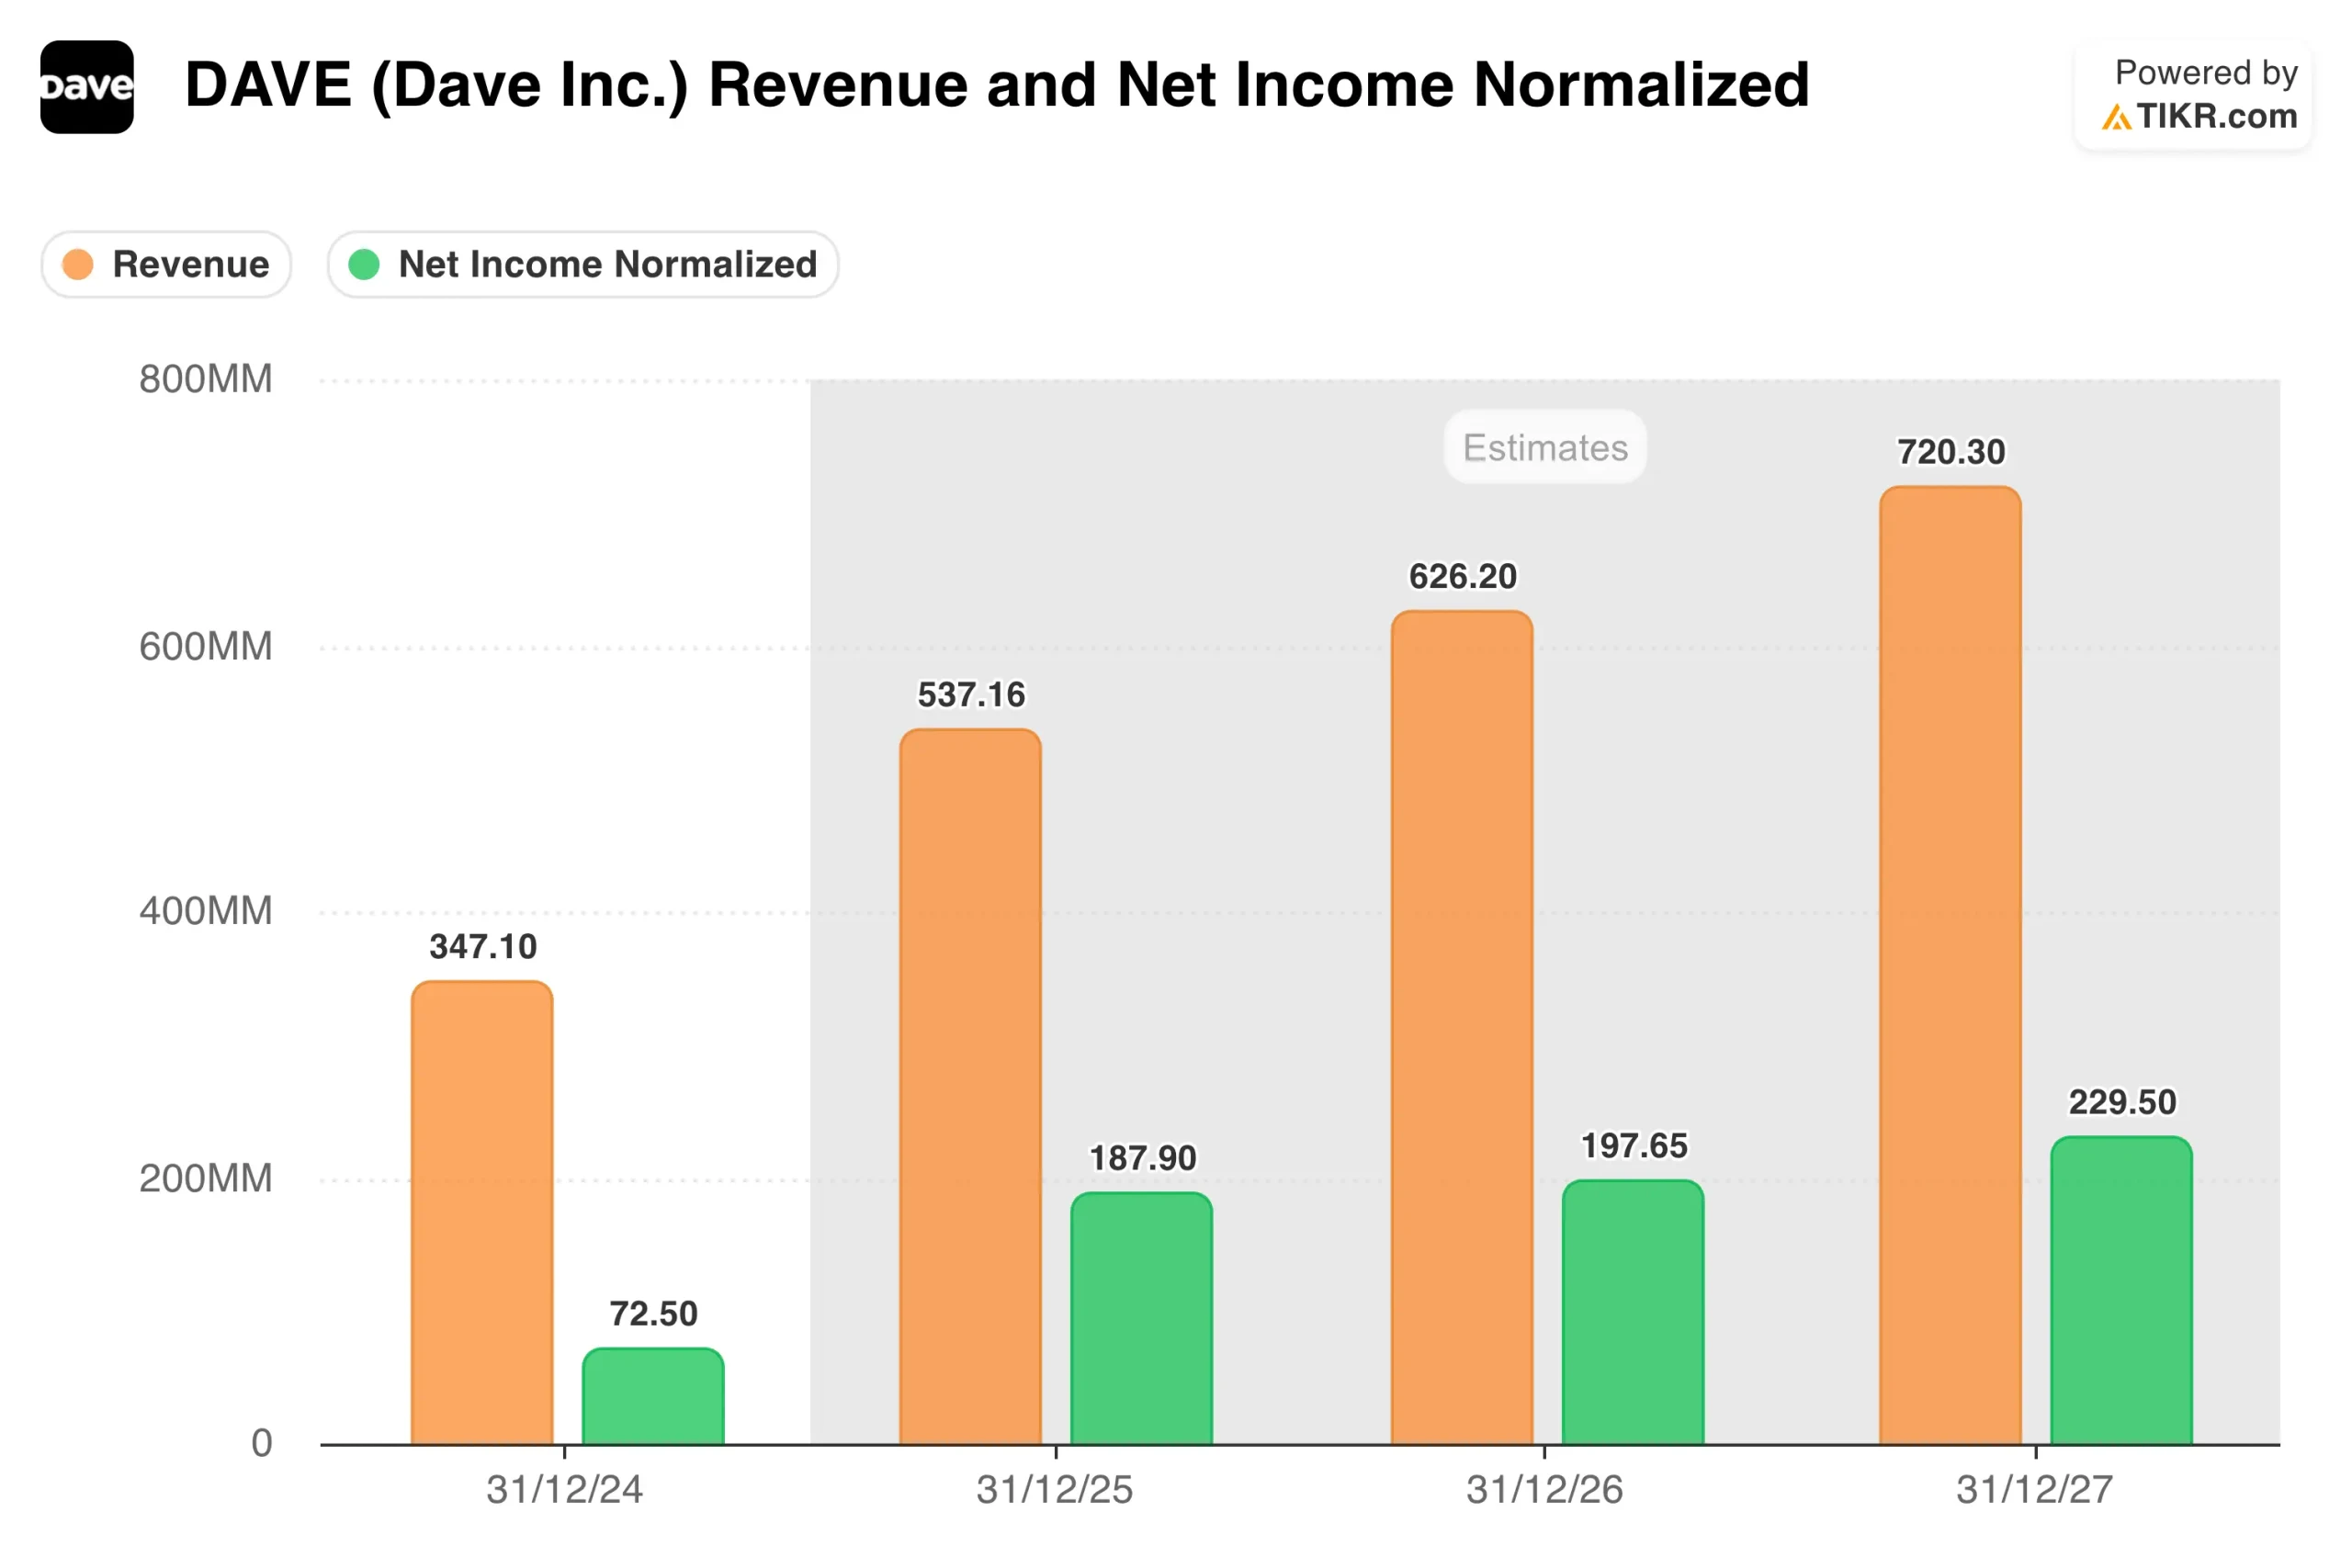
Dave (DAVE) stock is up 150% in 2025 as investors continue to digest the company’s explosive growth. The fintech company has increased revenue from $153 million in 2021 to $347 million in 2025. Analysts tracking DAVE stock forecast the top-line to surge to $720 million in 2027.
In Q3 of 2025, Dave reported revenue growth of 63% year-over-year to $150.8 million, while adjusted EBITDA surged 137% to $58.7 million, representing nearly 40% margins.
The strong performance prompted management to raise full-year 2025 revenue guidance to $544- $547 million from the previous range of $505- $515 million. Even more impressive, Dave stock got a boost from adjusted EBITDA guidance increasing to $215-$218 million from $180-$190 million.
CEO Jason Wilk emphasized that the company’s proprietary CashAI v5.5 underwriting engine is driving superior credit performance.
The 28-day delinquency rate improved to 2.33% in Q3, down seven basis points sequentially, and further declined to 2.19% in September following the CashAI rollout.
This new version uses nearly twice as many AI-driven features as the prior model, enabling better approval decisions and higher credit limits while maintaining strong economics.
See analysts’ growth forecasts and price targets for Dave stock (It’s free!) >>>
What the Market Is Telling Us About Dave Stock
The rally in Dave stock reflects growing confidence in the company’s ability to scale profitably while managing credit risk.
Monthly transacting members accelerated 17% to 2.77 million, while average revenue per user expanded nearly 40%.
Customer acquisition costs remained stable at $19, but the payback period improved to under 4 months, down nearly a month year-over-year.
Management made a critical strategic shift earlier this year by moving from an optional fee model to a mandatory one. This change increased credit revenue retention and allowed Dave to offer higher approval limits to members.
While it led to slightly elevated loss rates, the incremental gross spreads more than offset the losses, resulting in better net monetization per transaction and higher lifetime value.
Dave stock also benefited from news about the company’s partnership with Coastal Community Bank. The new off-balance sheet funding structure, expected to launch in early 2026, will meaningfully reduce direct funding obligations and lower Dave’s cost of capital.
The company expects to fully retire its existing warehouse debt facility by mid-2026, freeing up substantial liquidity for strategic capital allocation.
Looking ahead, Dave is preparing to launch a buy-now-pay-later product in Q1 of 2026. Management noted that roughly 60% of Dave’s members already use some form of BNPL service, representing a significant untapped opportunity.
Dave believes its cash flow data and CashAI underwriting will provide a competitive advantage, allowing it to approve more customers and offer higher limits than competitors using traditional bureau data.
With monthly transacting members accelerating, ARPU expanding, and the company exceeding the “Rule of 100” for two consecutive quarters, Dave stock appears positioned for continued momentum despite the recent pullback from its 52-week high.
Estimate a company’s fair value instantly (Free with TIKR) >>>
How Much Upside Does Dave Stock Have From Here?
With TIKR’s new Valuation Model tool, you can estimate a stock’s potential share price in under a minute.
All it takes is three simple inputs:
- Revenue Growth
- Operating Margins
- Exit P/E Multiple
If you’re not sure what to enter, TIKR automatically fills in each input using analysts’ consensus estimates, giving you a quick, reliable starting point.
From there, TIKR calculates the potential share price and total returns under Bull, Base, and Bear scenarios so you can quickly see whether a stock looks undervalued or overvalued.
See a stock’s true value in under 60 seconds (Free with TIKR) >>>
Looking for New Opportunities?
- See what stocks billionaire investors are buying so you can follow the smart money.
- Analyze stocks in as little as 5 minutes with TIKR’s all-in-one, easy-to-use platform.
- The more rocks you overturn… the more opportunities you’ll uncover. Search 100K+ global stocks, global top investor holdings, and more with TIKR.
Disclaimer:
Please note that the articles on TIKR are not intended to serve as investment or financial advice from TIKR or our content team, nor are they recommendations to buy or sell any stocks. We create our content based on TIKR Terminal’s investment data and analysts’ estimates. Our analysis might not include recent company news or important updates. TIKR has no position in any stocks mentioned. Thank you for reading, and happy investing!