

Compounders are businesses that steadily grow earnings year after year, often because they’re asset-light and can reinvest profits at high rates of return.
They’ve been some of the most reliable wealth builders in the market, and have consistently outperformed flashy growth stocks and the broader market over time.
This article highlights five compounders that Wall Street analysts believe are still undervalued, along with one bonus pick that’s flying under the radar.
Each company we’re going to talk about on this list is a high-quality stock that has outperformed in the past and has a strong potential to continue to outperform. Each of these stocks is worth a closer look!
Value stocks in as little as 30 seconds with TIKR’s new Valuation Model (It’s free) >>>
Stock #1: Alphabet (GOOGL)
Alphabet remains one of the highest-quality businesses in the world, with a dominant position in digital advertising and a growing presence in cloud infrastructure.
Its Google Search and YouTube platforms continue to throw off massive free cash flow, while Google Cloud is gaining operating leverage.
Analysts see both margin expansion and earnings growth ahead as Alphabet tightens spending and focuses on core efficiency.
What sets Alphabet apart right now is its early positioning in AI infrastructure. It’s building its own chips (TPUs), training massive multimodal models (Gemini), and integrating AI across Search, Docs, and Ads.
Valuation Model Summary
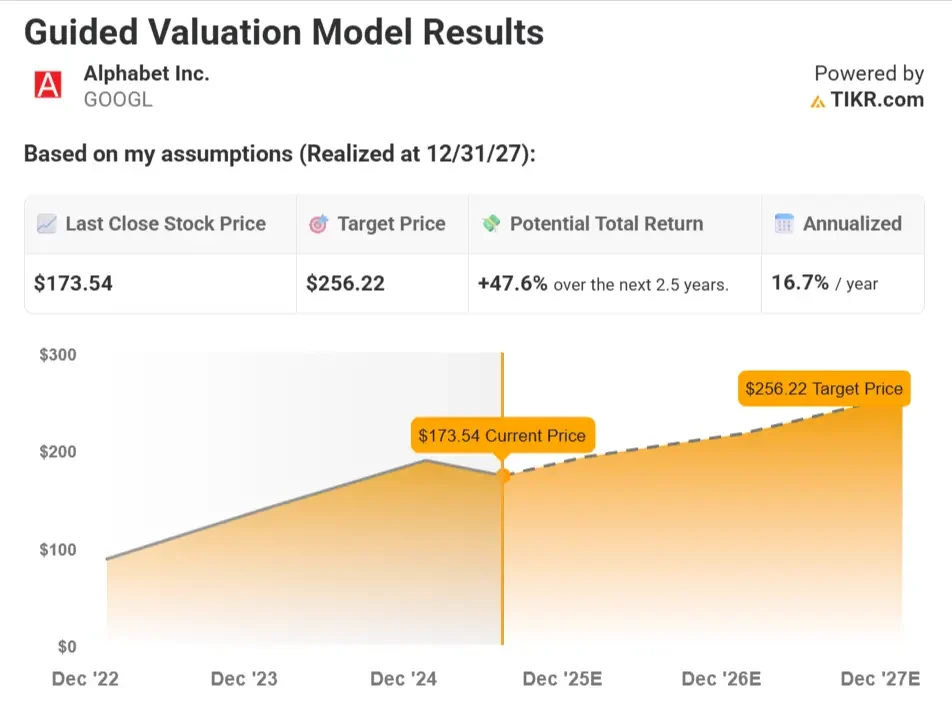
Based on analysts’ consensus estimates, Alphabet stock could have a fair value of about $257 by the end of 2027, implying a 47.6% total return from today’s price of ~$174. That equates to roughly 16.7% annualized returns over the next 2.5 years.
Model Assumptions
These inputs reflect moderate long-term growth in Alphabet’s core businesses, along with stable margins and a valuation in line with historical averages.
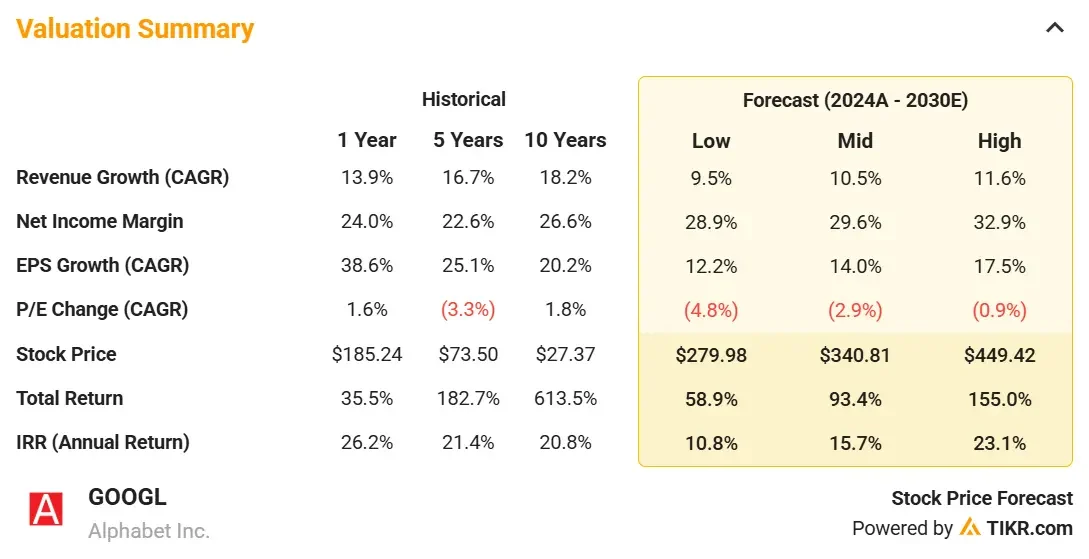
- Annual Revenue Growth of 10.5%: This assumes continued growth in Search, YouTube, and Google Cloud, with modest contribution from AI monetization and ongoing digital ad recovery.
- Operating Margin of 33.4%: Reflects tight cost control, improving Cloud profitability, and efficiency gains from AI across business units.
- P/E Multiple of 19x: Assumes a slight discount to historical averages, reflecting a mature growth profile but still strong earnings quality.
Run your own numbers for Alphabet stock in as little as 30 seconds with TIKR (It’s free) >>>
What Happens If Things Go Better or Worse?
The model adjusts for various scenarios depending on digital ad trends, cloud momentum, and Alphabet’s ability to monetize AI across its ecosystem.
Here’s how Alphabet stock could perform based on different scenarios:
- Low Case: Digital ad recovery remains sluggish and Google Cloud loses momentum to competitors, leading to slower top-line growth and limited margin expansion → 10.8% annual returns
- Mid Case: Search, YouTube, and Cloud continue growing at a steady pace, with stable margins and solid cost discipline driving consistent earnings growth → 15.7% annual returns
- High Case: AI monetization takes off across Search, Ads, and Workspace, while Cloud margins scale meaningfully and investor sentiment improves → 23.1% annual returns
Even in a conservative scenario, Alphabet’s cash flow engine and leading market position offer an attractive return profile.
Stock #2: Copart (CPRT)
Copart operates a business that most investors overlook, but few can match in terms of efficiency and economics.
It dominates the salvage vehicle auction space with a technology-enabled platform and a deeply integrated physical network.
Insurance companies rely on Copart to offload totaled vehicles, and buyers from around the world participate in its online auctions to source used inventory at scale.
Analysts highlight the company’s ability to generate consistent growth with minimal capital investment. Its margins have expanded steadily, and the network effect from its logistics infrastructure creates a durable moat.
With structural tailwinds in the auto market and international expansion underway, Copart continues to execute with precision.
Valuation Model Summary
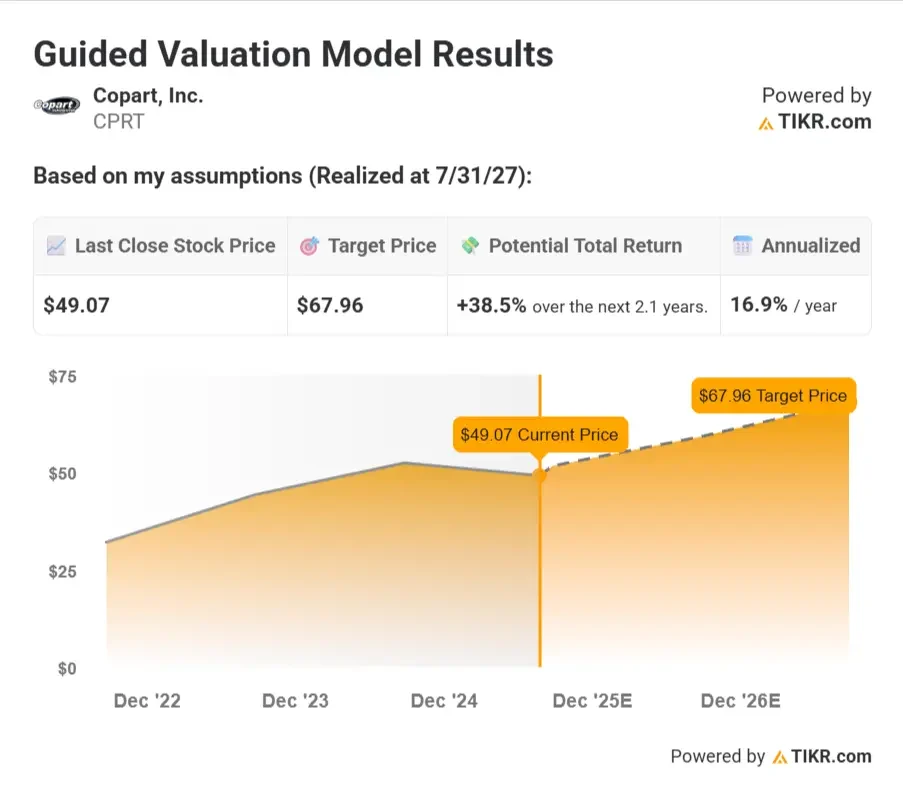
Based on analysts’ consensus estimates, Copart stock could have a fair value of about $68 by mid-2027, implying a 38.5% total return from today’s price of ~$49. That equates to roughly 16.9% annualized returns over the next 2.1 years.
See if Copart is a good stock to buy today with TIKR’s new Valuation Model (It’s free) >>>
Model Assumptions
These inputs reflect continued steady growth in vehicle volume and pricing, supported by operational leverage and a premium business model.
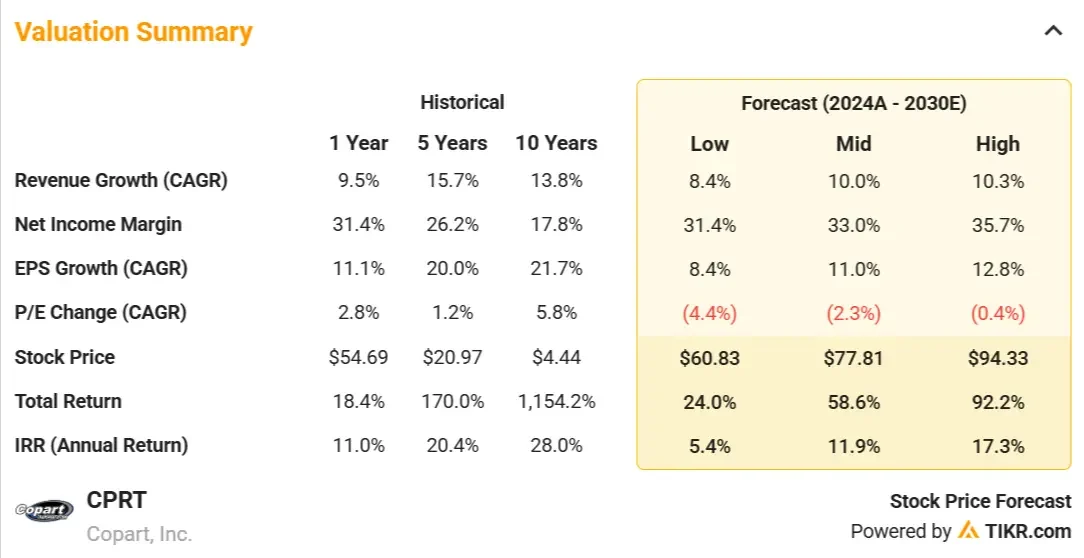
- Annual Revenue Growth of 10.0%: Assumes steady growth in salvage vehicle volumes, gradual expansion into global markets, and digital auction strength.
- Operating Margin of 38%: Reflects scale advantages, stable pricing, and Copart’s low-cost operating model as yard utilization improves.
- P/E Multiple of 29.7x: Assumes the market continues to assign a premium multiple due to Copart’s consistent growth and high return on capital.
What Happens If Things Go Better or Worse?
The model adjusts for various scenarios depending on vehicle volume, pricing trends, and Copart’s ability to expand globally.
This is how returns might look in different scenarios:
- Low Case: North American growth slows and international expansion proves costly, putting pressure on margins and limiting upside → 5.4% annual returns
- Mid Case: Salvage volumes remain steady, margins hold strong, and Copart benefits from gradual international scale → 11.9% annual returns
- High Case: Global operations ramp faster than expected and pricing power improves, driving strong earnings growth and investor enthusiasm → 17.3% annual returns
The mid and high cases suggest solid double-digit returns, with the downside case still delivering positive results due to Copart’s defensible business model.
Stock #3: Adobe (ADBE)
Adobe is a quiet compounder built on some of the most entrenched software products in the world.
Creative Cloud remains mission-critical for designers and marketers, and its high-margin, subscription-based model continues to produce strong cash flow. Analysts love Adobe for its pricing power, high retention, and durable dominance in creative tools.
The next leg of the story is AI.
Adobe has integrated generative tools directly into Photoshop and Premiere through Firefly, adding major value without increasing cost. This positions Adobe to drive upsells and higher ARPU in the years ahead.
Valuation Model Summary
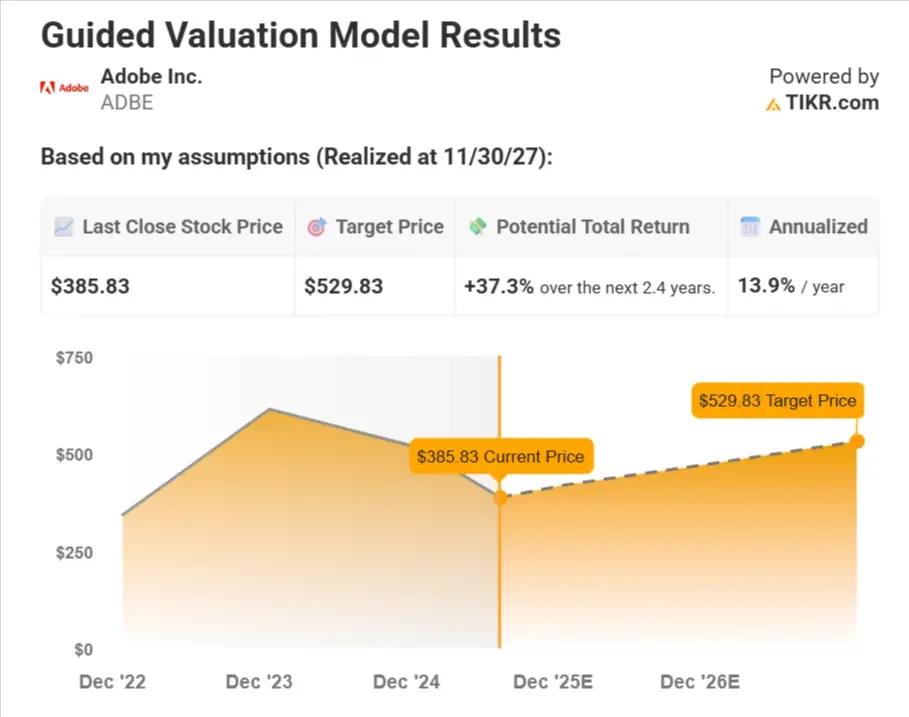
Based on analysts’ consensus estimates, Adobe stock could have a fair value of about $530 by the end of 2027, implying a 37.3% total return from today’s price of ~$386. That equates to roughly 13.9% annualized returns over the next 2.4 years.
Model Assumptions
These inputs assume Adobe maintains its dominant market position while integrating AI and expanding its enterprise footprint.
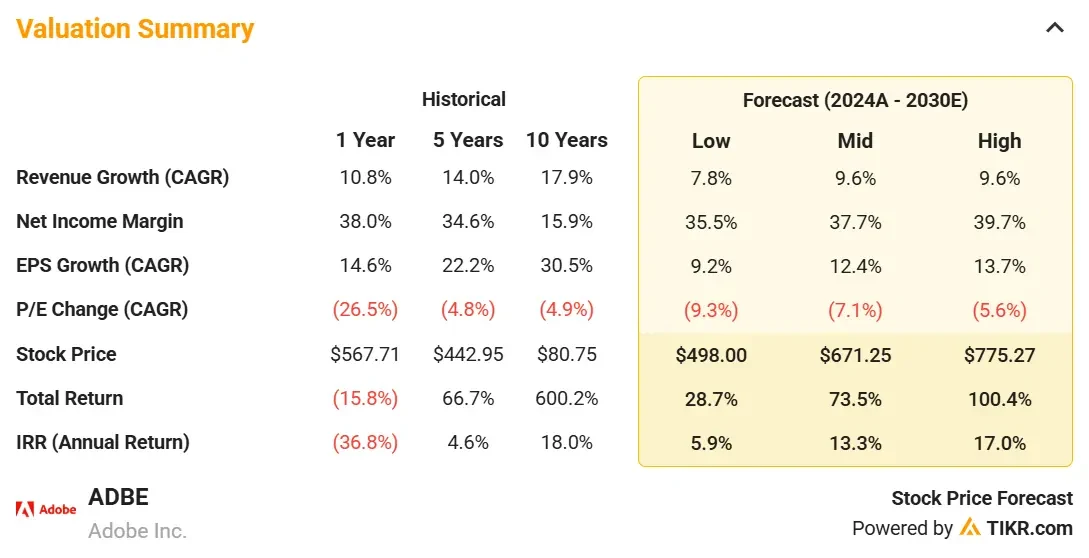
- Annual Revenue Growth of 9.6%: This assumes Adobe retains leadership in Creative Cloud and Document Cloud, with some acceleration from AI tools and enterprise demand.
- Operating Margin of 46.2%: Assumes Adobe maintains pricing power and scales efficiently, especially in its digital media business.
- P/E Multiple of 18x: Reflects a discounted multiple relative to history, suggesting investors remain cautious on competition and execution risks.
What Happens If Things Go Better or Worse?
The Valuation Model considers different paths for the stock depending on product momentum and competitive threats in creative software.
This is how returns could look depending on Adobe’s business performance.
- Low Case: Competition from AI-native tools and pricing pressure slow growth, leading to margin compression and a lower multiple → 5.9% annual returns
- Mid Case: Adobe defends its market share and maintains strong margins, supported by steady demand for creative and document tools → 13.3% annual returns
- High Case: AI tools drive a new wave of adoption across enterprise and SMBs, while Adobe reaccelerates growth and expands margins → 17.0% annual returns
Even the low case delivers positive returns, while the mid and high cases offer solid upside on top of Adobe’s consistent free cash flow.
Value any stock in under a minute with TIKR’s new Valuation Model (It’s free) >>>
Stock #4: Mastercard (MA)
Mastercard sits at the center of global commerce, earning a fee every time someone uses a Mastercard-branded card.
It doesn’t take on credit risk, which makes its model extremely profitable and scalable.
Analysts view it as one of the highest-return business models in the market because it benefits from powerful structural tailwinds as the world continues shifting from cash to digital payments.
Beyond its core business, Mastercard is expanding into B2B payments, cross-border flows, and embedded finance. These markets are large and underpenetrated, giving Mastercard room to grow well beyond traditional consumer spend.
Valuation Model Summary
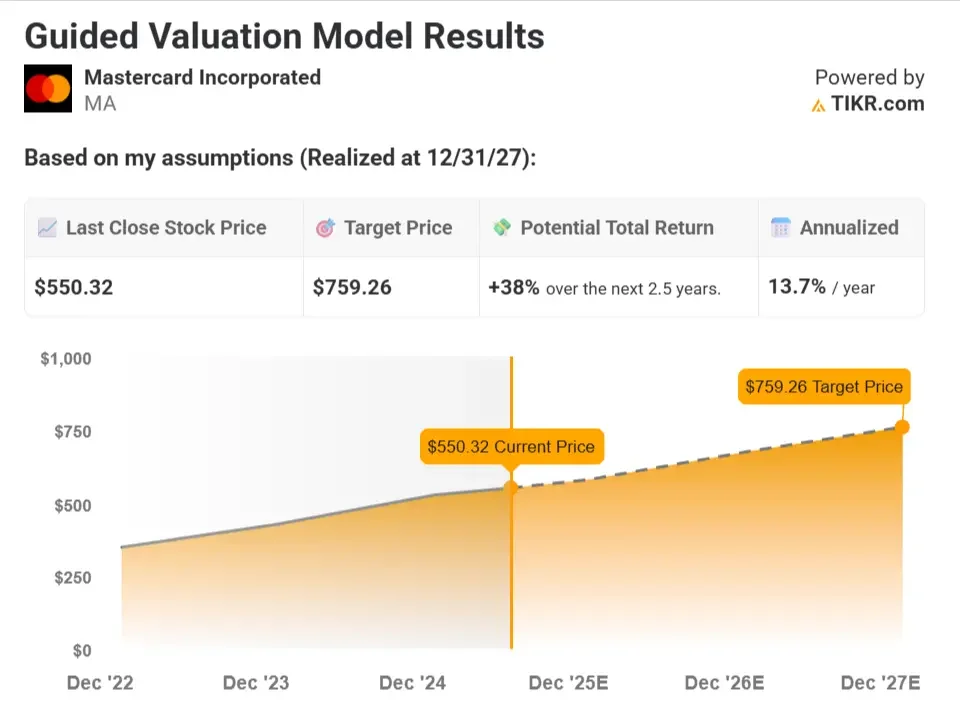
Based on analysts’ consensus estimates, Mastercard stock could have a fair value of about $612 by the end of 2027, implying a 42.5% total return from today’s price of ~$429. That equates to roughly 15.3% annualized returns over the next 2.5 years.
Model Assumptions
These inputs reflect Mastercard’s continued dominance in payments, along with strong cash flow and network effects that support long-term earnings growth.
- Annual Revenue Growth of 12.4%: Assumes ongoing growth in global consumer spending, continued shift to digital payments, and share gains in emerging markets.
- Operating Margin of 59%: Reflects Mastercard’s consistent discipline in spending, operating leverage from transaction growth, and limited need for reinvestment.
- P/E Multiple of 31.2x: Assumes the market maintains a premium multiple for Mastercard given its strong margins, cash flow, and global network effects.
What Happens If Things Go Better or Worse?
The model incorporates scenarios based on global consumer spending, cross-border volumes, and fintech disruption.
This is how returns might look depending on Mastercard’s business performance.
- Low Case: Global spending slows, cross-border volumes weaken, and fintech alternatives begin to chip away at volume share → 5.6% annual returns
- Mid Case: Mastercard benefits from stable global growth and rising digital transactions, with margins staying near historic highs → 12.8% annual returns
- High Case: Cross-border travel rebounds sharply, emerging markets accelerate digital adoption, and new services expand earnings power → 16.5% annual returns
With Mastercard’s proven ability to scale and adapt, even the lower end of outcomes still offers meaningful compounding.

Find stocks that analysts think have major upside >>>
Stock #5: UnitedHealth Group (UNH)
UnitedHealth has quietly become one of the most structurally advantaged businesses in the S&P 500.
Its scale in private insurance is unmatched, but the real differentiator is its Optum division, which gives the company direct access to pharmacy services, care delivery, and health data infrastructure.
By controlling multiple layers of the healthcare ecosystem, UnitedHealth can manage costs more effectively than competitors while still growing earnings at a high single-digit rate.
Analysts see recent political volatility mostly as noise rather than as a signal. The fundamentals remain intact, and management continues to deliver steady margin improvement and disciplined capital allocation.
UnitedHealth’s long-term track record of compounding cash flows and dividend growth speaks for itself.
Valuation Model Summary
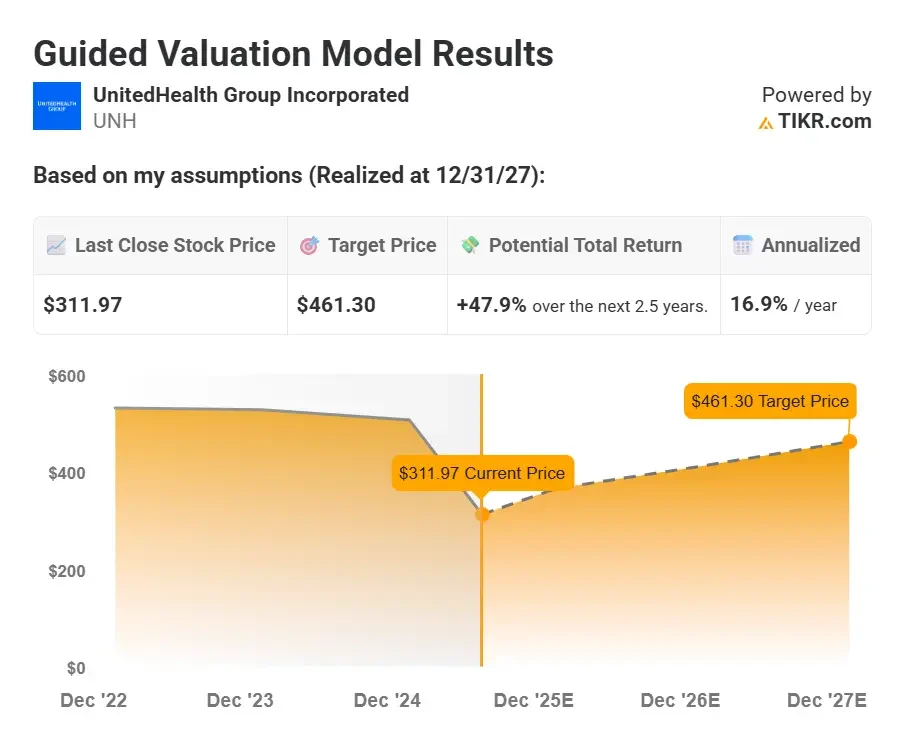
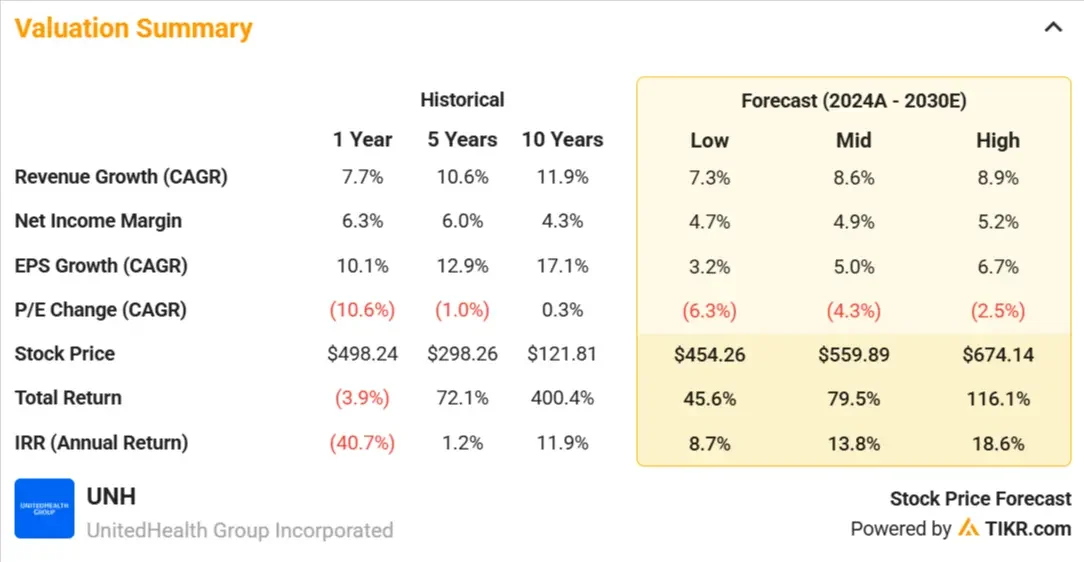
Based on analysts’ consensus estimates, UnitedHealth stock could have a fair value of about $461 by the end of 2027, implying a 47.9% total return from today’s price of ~$312. That equates to roughly 16.9% annualized returns over the next 2.5 years.
Model Assumptions
These inputs assume UNH continues to scale across both insurance and healthcare services while maintaining operational efficiency.
- Annual Revenue Growth of 8.6%: Assumes steady enrollment growth in Medicare Advantage and commercial plans, plus continued expansion of Optum.
- Operating Margin of 7.4%: Reflects stable insurance margins and gradual improvement in Optum’s services mix and scale efficiencies.
- P/E Multiple of 13.9x: Assumes a slight discount to historical averages due to policy risk, but still above typical managed care peers due to Optum’s strength.
Is now a good time to buy UnitedHealth stock? See for yourself now (It’s free) >>>
What Happens If Things Go Better or Worse?
The forecast accounts for variations in medical cost trends, regulatory shifts, and Optum’s growth trajectory.
This is how returns could play out for UnitedHealth stock based on different scenarios.
- Low Case: Medicare Advantage reimbursement pressure and rising medical costs weigh on profits and sentiment → 8.7% annual returns
- Mid Case: UNH balances insurance and services growth, keeps costs in check, and steadily expands margins across Optum → 13.8% annual returns
- High Case: Optum outperforms expectations, medical costs remain contained, and investors re-rate the stock higher → 18.6% annual returns
With strong cash flows and a defensive business model, UNH could deliver attractive returns across a range of outcomes.
Bonus: Zeta Global (ZETA)
Zeta Global helps businesses turn customer data into personalized marketing across channels like email, websites, and apps. It uses AI to help brands figure out the right message, timing, and audience to increase engagement.
It has carved out a niche in the crowded marketing tech space by focusing on identity resolution and first-party data. As cookies go away, Zeta’s platform becomes more valuable to marketers who need better targeting tools. The company’s long-term contracts and expanding wallet share also give it recurring, sticky revenue.
Analysts see a long runway ahead. Zeta is still unprofitable, but its operating leverage is improving as it scales. At just 3.5x forward sales, the stock trades at a discount to peers like HubSpot and Salesforce, despite growing faster.
Valuation Model Summary
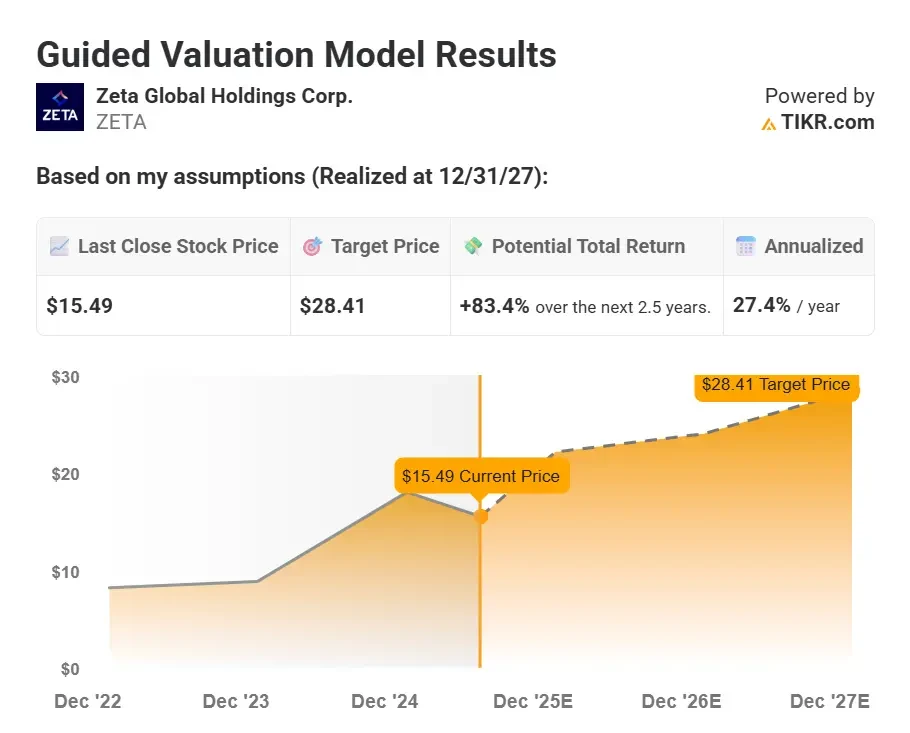
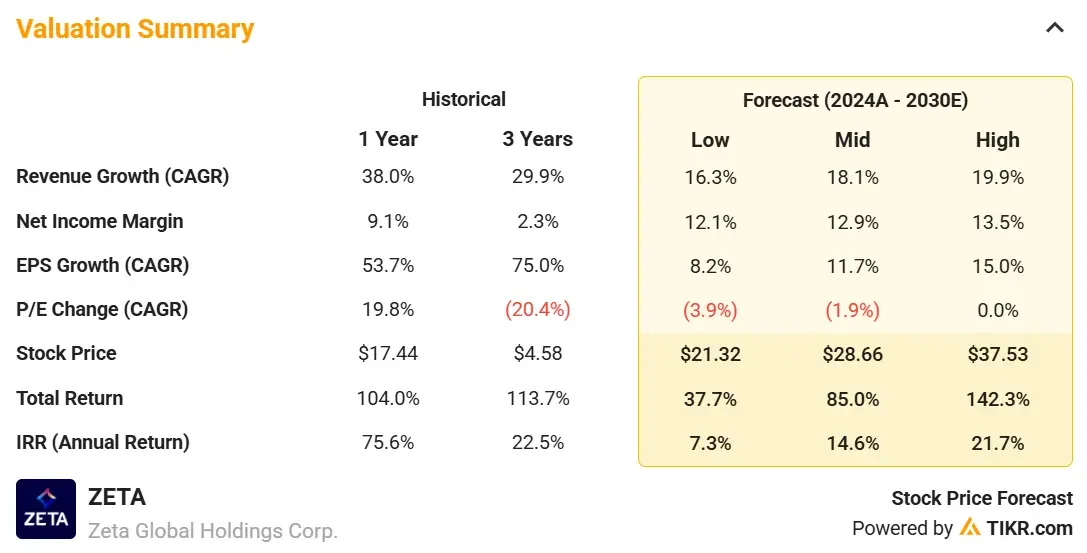
Based on analysts’ consensus estimates, Zeta stock could have a fair value of about $28 by the end of 2027, implying an 83.4% total return from today’s price of ~$15.50. That equates to roughly 27.4% annualized returns over the next 2.5 years.
Model Assumptions
These inputs reflect aggressive top-line growth with meaningful margin expansion as Zeta scales its software offering and improves operating leverage.
- Annual Revenue Growth of 20.2%: This assumes continued adoption of Zeta’s AI marketing tools, increased wallet share with existing clients, and strong traction with large enterprises.
- Operating Margin of 20%: Reflects margin expansion from greater scale, automation, and growing software contribution over lower-margin services.
- P/E Multiple of 22.7x: Assumes the market rewards Zeta with a mid-20s multiple for delivering profitable growth and gaining share in the martech space.
Use TIKR to see whether Zeta is undervalued based on analysts’ estimates (It’s free) >>>
What Happens If Things Go Better or Worse?
The scenarios factor in how well Zeta executes on identity resolution, expands wallet share, and converts revenue into earnings.
This is how returns could look for Zeta stock, depending on different scenarios.
- Low Case: Client budgets remain tight, adoption slows, and Zeta struggles to improve margins as fast as expected → 7.3% annual returns
- Mid Case: Zeta grows steadily, improves operating leverage, and continues landing larger enterprise contracts → 14.6% annual returns
- High Case: The platform gains strong market share, first-party data demand accelerates, and margins expand rapidly → 21.7% annual returns
Zeta’s upside is significant if it continues gaining market share. Even the low-case scenario shows the strength of its long-term recurring revenue model.
Keep in mind, this valuation assumes no multiple expansion, which significantly downplays the long-term value the company could see.
The stock currently trades at just over 20x earnings, but with nearly 20% expected annual revenue growth and expected margin expansion, it’s possible the stock could trade at closer to 30-40x earnings. This alone would increase the stock’s total upside by 50-100%.
TIKR Takeaway
Wall Street believes these compounders are undervalued and still have room to run.
With TIKR, you can build your own Valuation Model in just 30 seconds, so you can analyze stocks like a pro.
This allows you to test your assumptions, explore best- and worst-case scenarios, and see what a stock is really worth so you can invest with confidence.
Quickly value any stock with TIKR’s powerful new Valuation Model (It’s free!) >>>
Want to Know What a Stock Could Return in as Little as 30 Seconds?
TIKR just launched a powerful Valuation Model tool that shows you how much upside (or downside) a stock could have based on real analyst forecasts.
In seconds, you’ll see:
- What a stock’s fair value is based on revenue growth, margin, and P/E multiple estimates
- Return projections across bull, base, and bear case scenarios
- Whether Wall Street expects the stock to outperform, underperform, or stay flat based on consensus estimates
This tool helps you value stocks smarter in under a minute. No Excel required. No finance background needed.
Click here to sign up for TIKR and try TIKR’s new Valuation Model, completely free.
Looking for New Opportunities?
- See what stocks billionaire investors are buying so you can follow the smart money.
- Analyze stocks in as little as 5 minutes with TIKR’s all-in-one, easy-to-use platform.
- The more rocks you overturn… the more opportunities you’ll uncover. Search 100K+ global stocks, global top investor holdings, and more with TIKR.
Disclaimer:
Please note that the articles on TIKR are not intended to serve as investment or financial advice from TIKR or our content team, nor are they recommendations to buy or sell any stocks. We create our content based on TIKR Terminal’s investment data and analysts’ estimates. Our analysis might not include recent company news or important updates. TIKR has no position in any stocks mentioned. Thank you for reading, and happy investing!