Key Stats for Vulcan Materials Stock
- Past-6-Month Performance: 6%
- 52-Week Range: $215 to $331
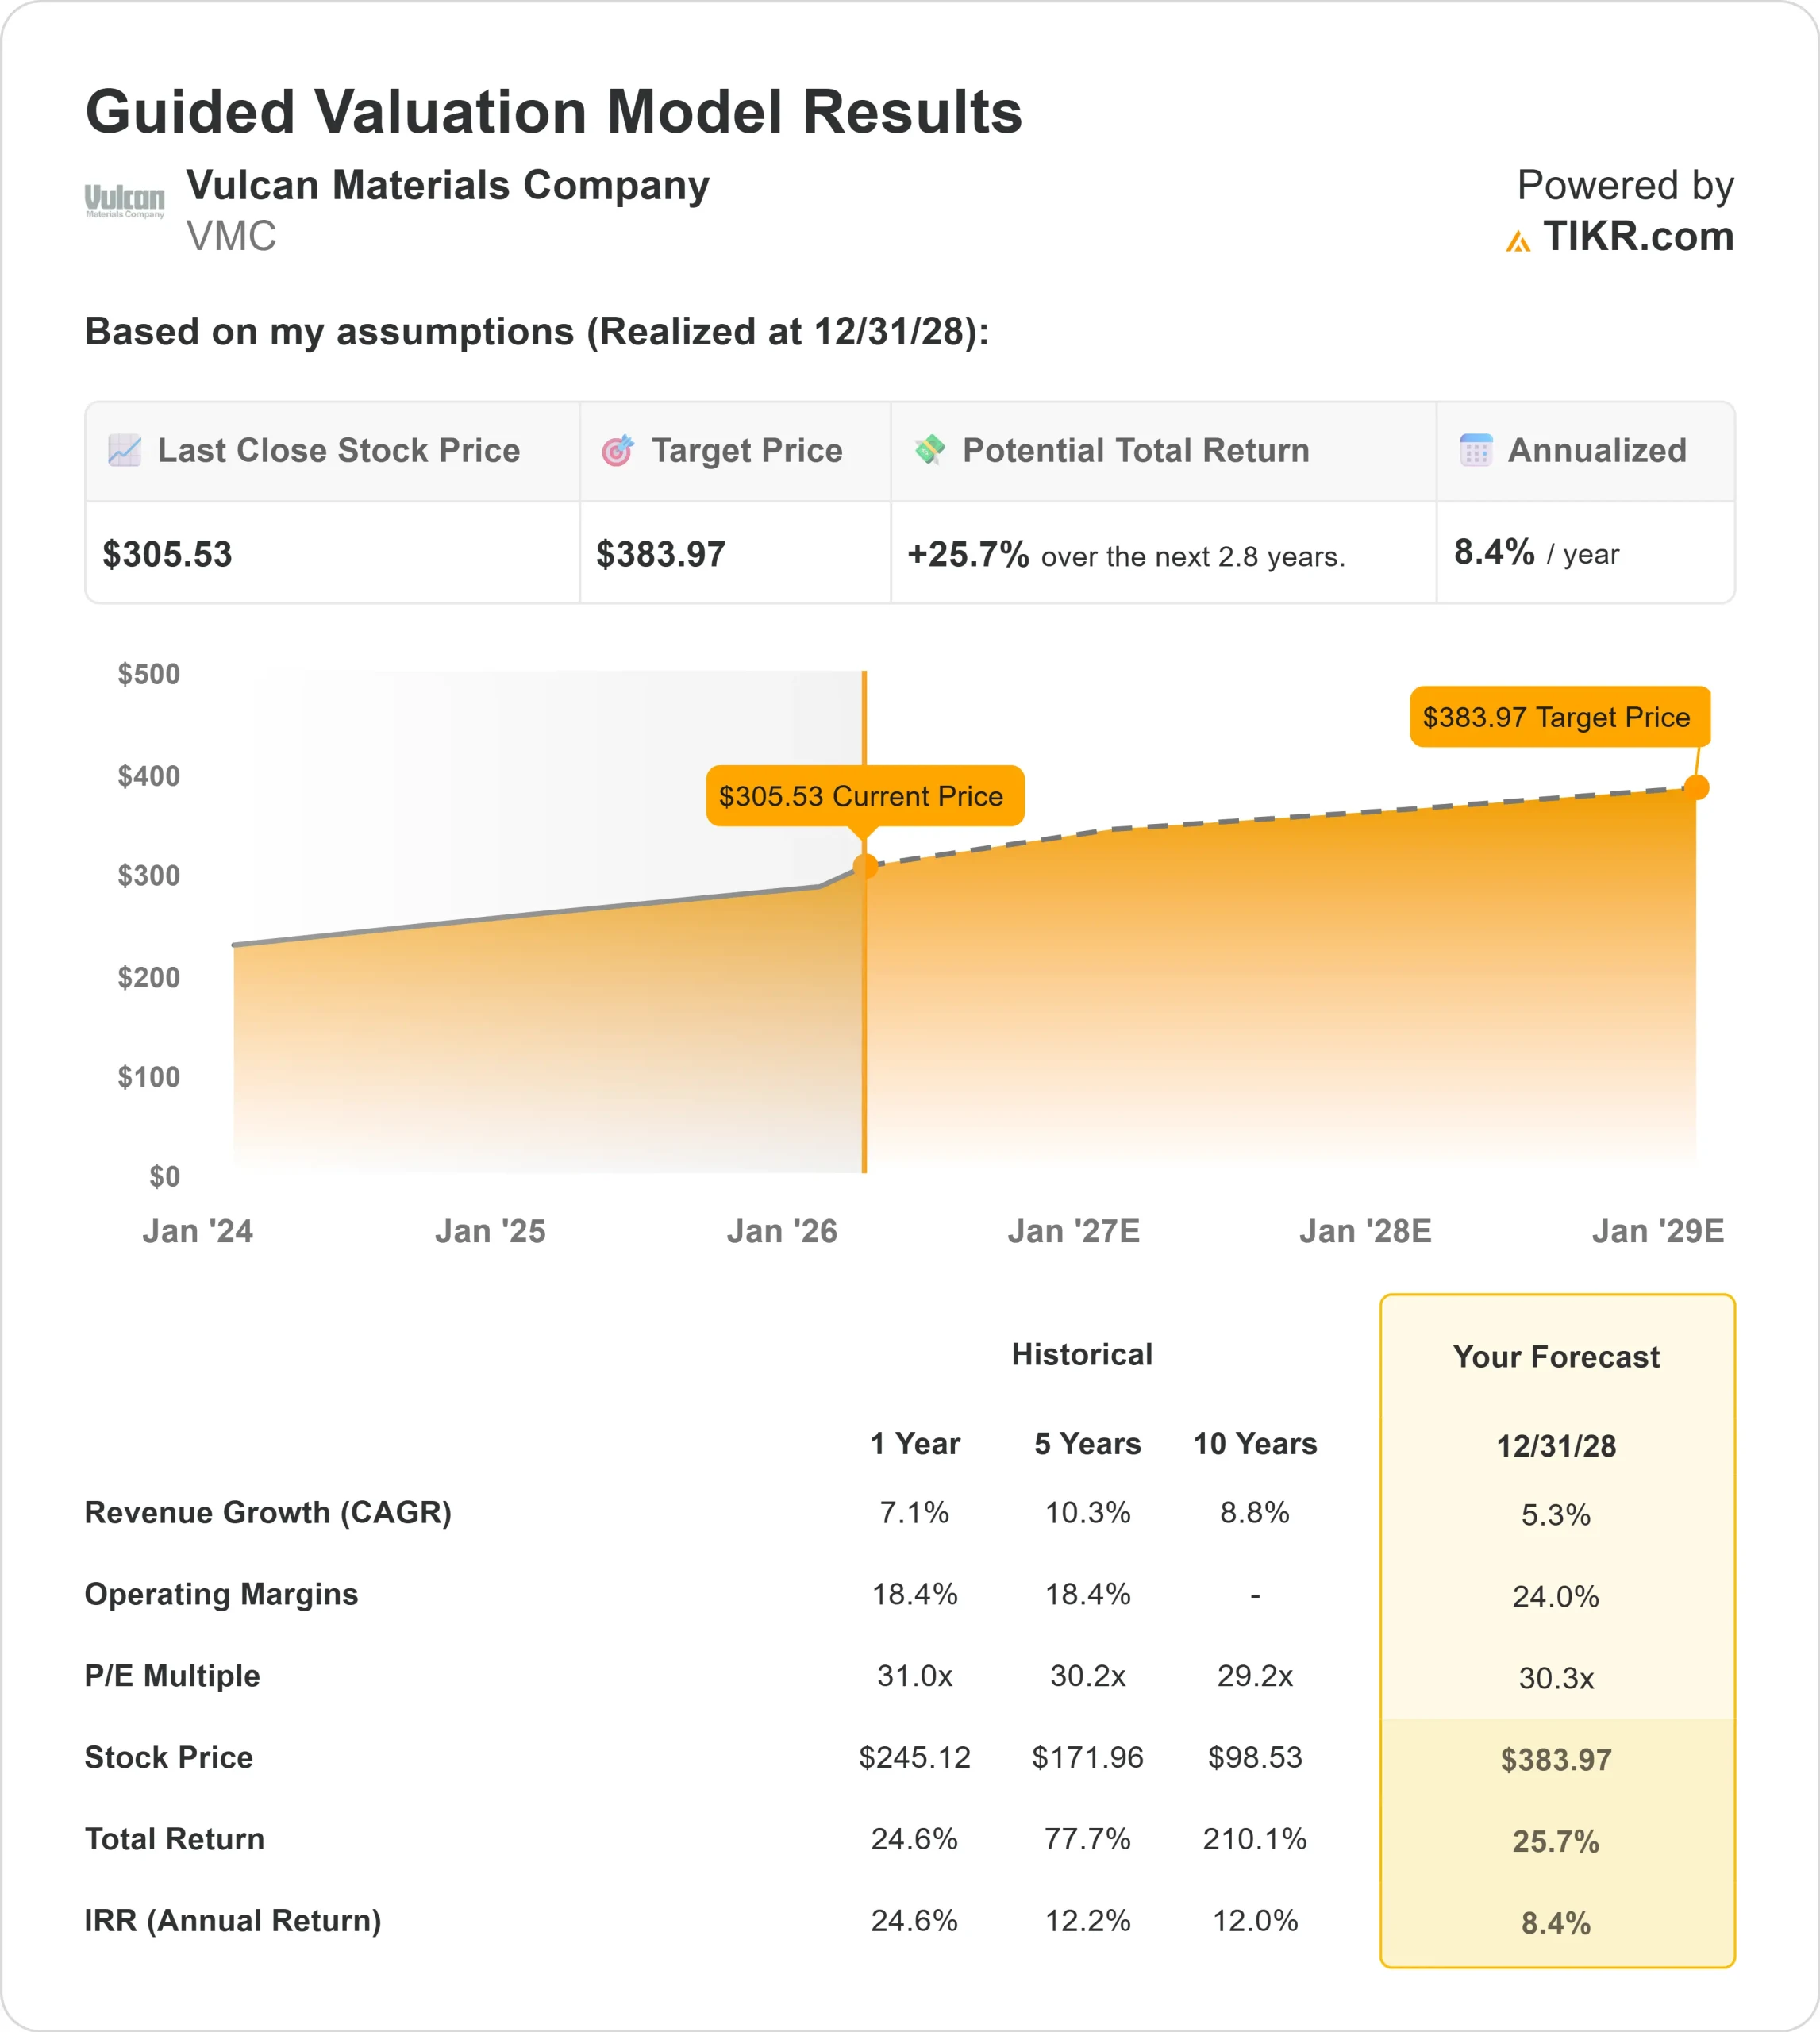
- Valuation Model Target Price: $384
- Implied Upside: 26%
Value your favorite stocks like Vulcan Materials with 5 years of analysts’ forecasts using TIKR’s new Valuation Model (It’s free) >>>
What Happened?
Vulcan Materials stock is up about 6% over the last 6 months, recently trading near $309 per share as investors responded to stronger earnings growth, expanding margins, and constructive 2026 guidance.
The advance reflects rising confidence that infrastructure demand and disciplined pricing can continue compounding profitability this year.
Shares strengthened after the company reported 2025 adjusted EBITDA of $2.3 billion, up 13%, with margins expanding 160 basis points to 29.3%, alongside a 29% increase in operating cash flow to over $1.8 billion. Aggregates cash gross profit per ton rose to $11.33, reaching the company’s long-term target range.
Management guided 2026 adjusted EBITDA to $2.4 billion to $2.6 billion, supported by expected aggregates shipment growth of 1% to 3% and pricing increases of 4% to 6%, with CEO Ronnie Pruitt stating the business is “in a very strong position to capture more profitability.”
Institutional activity has remained active. Vanguard increased its stake by 1.8% to 17.2 million shares valued at approximately $5.29 billion, representing about 13% of the company, while Principal Financial Group raised its holdings by 5.8% to 7.6 million shares worth roughly $2.35 billion.
Comgest Global Investors added 7,999 shares, NEOS Investment Management increased its position by 17.2%, and ING Groep NV boosted its stake by 67.3%, while Premier Fund Managers trimmed its stake by 32.4%.
Institutional investors collectively own about 90% of the stock, reinforcing strong long-term capital commitment.
Looking ahead to 2026, demand remains supported by IIJA-funded public infrastructure and accelerating data center construction, with over 150 million square feet under construction and nearly 450 million square feet announced, much of it within 30 miles of a Vulcan aggregates facility.
With net debt to EBITDA at 1.8x and continued pricing momentum, earnings durability remains the primary driver of the stock’s recent strength.
See analysts’ growth forecasts and price targets for Vulcan Materials (It’s free) >>>
Is Vulcan Materials Undervalued?
Under valuation assumptions, the stock is modeled using:
- Revenue Growth (CAGR): 5.3%
- Operating Margins: 24.0%
- Exit P/E Multiple: 30.3x
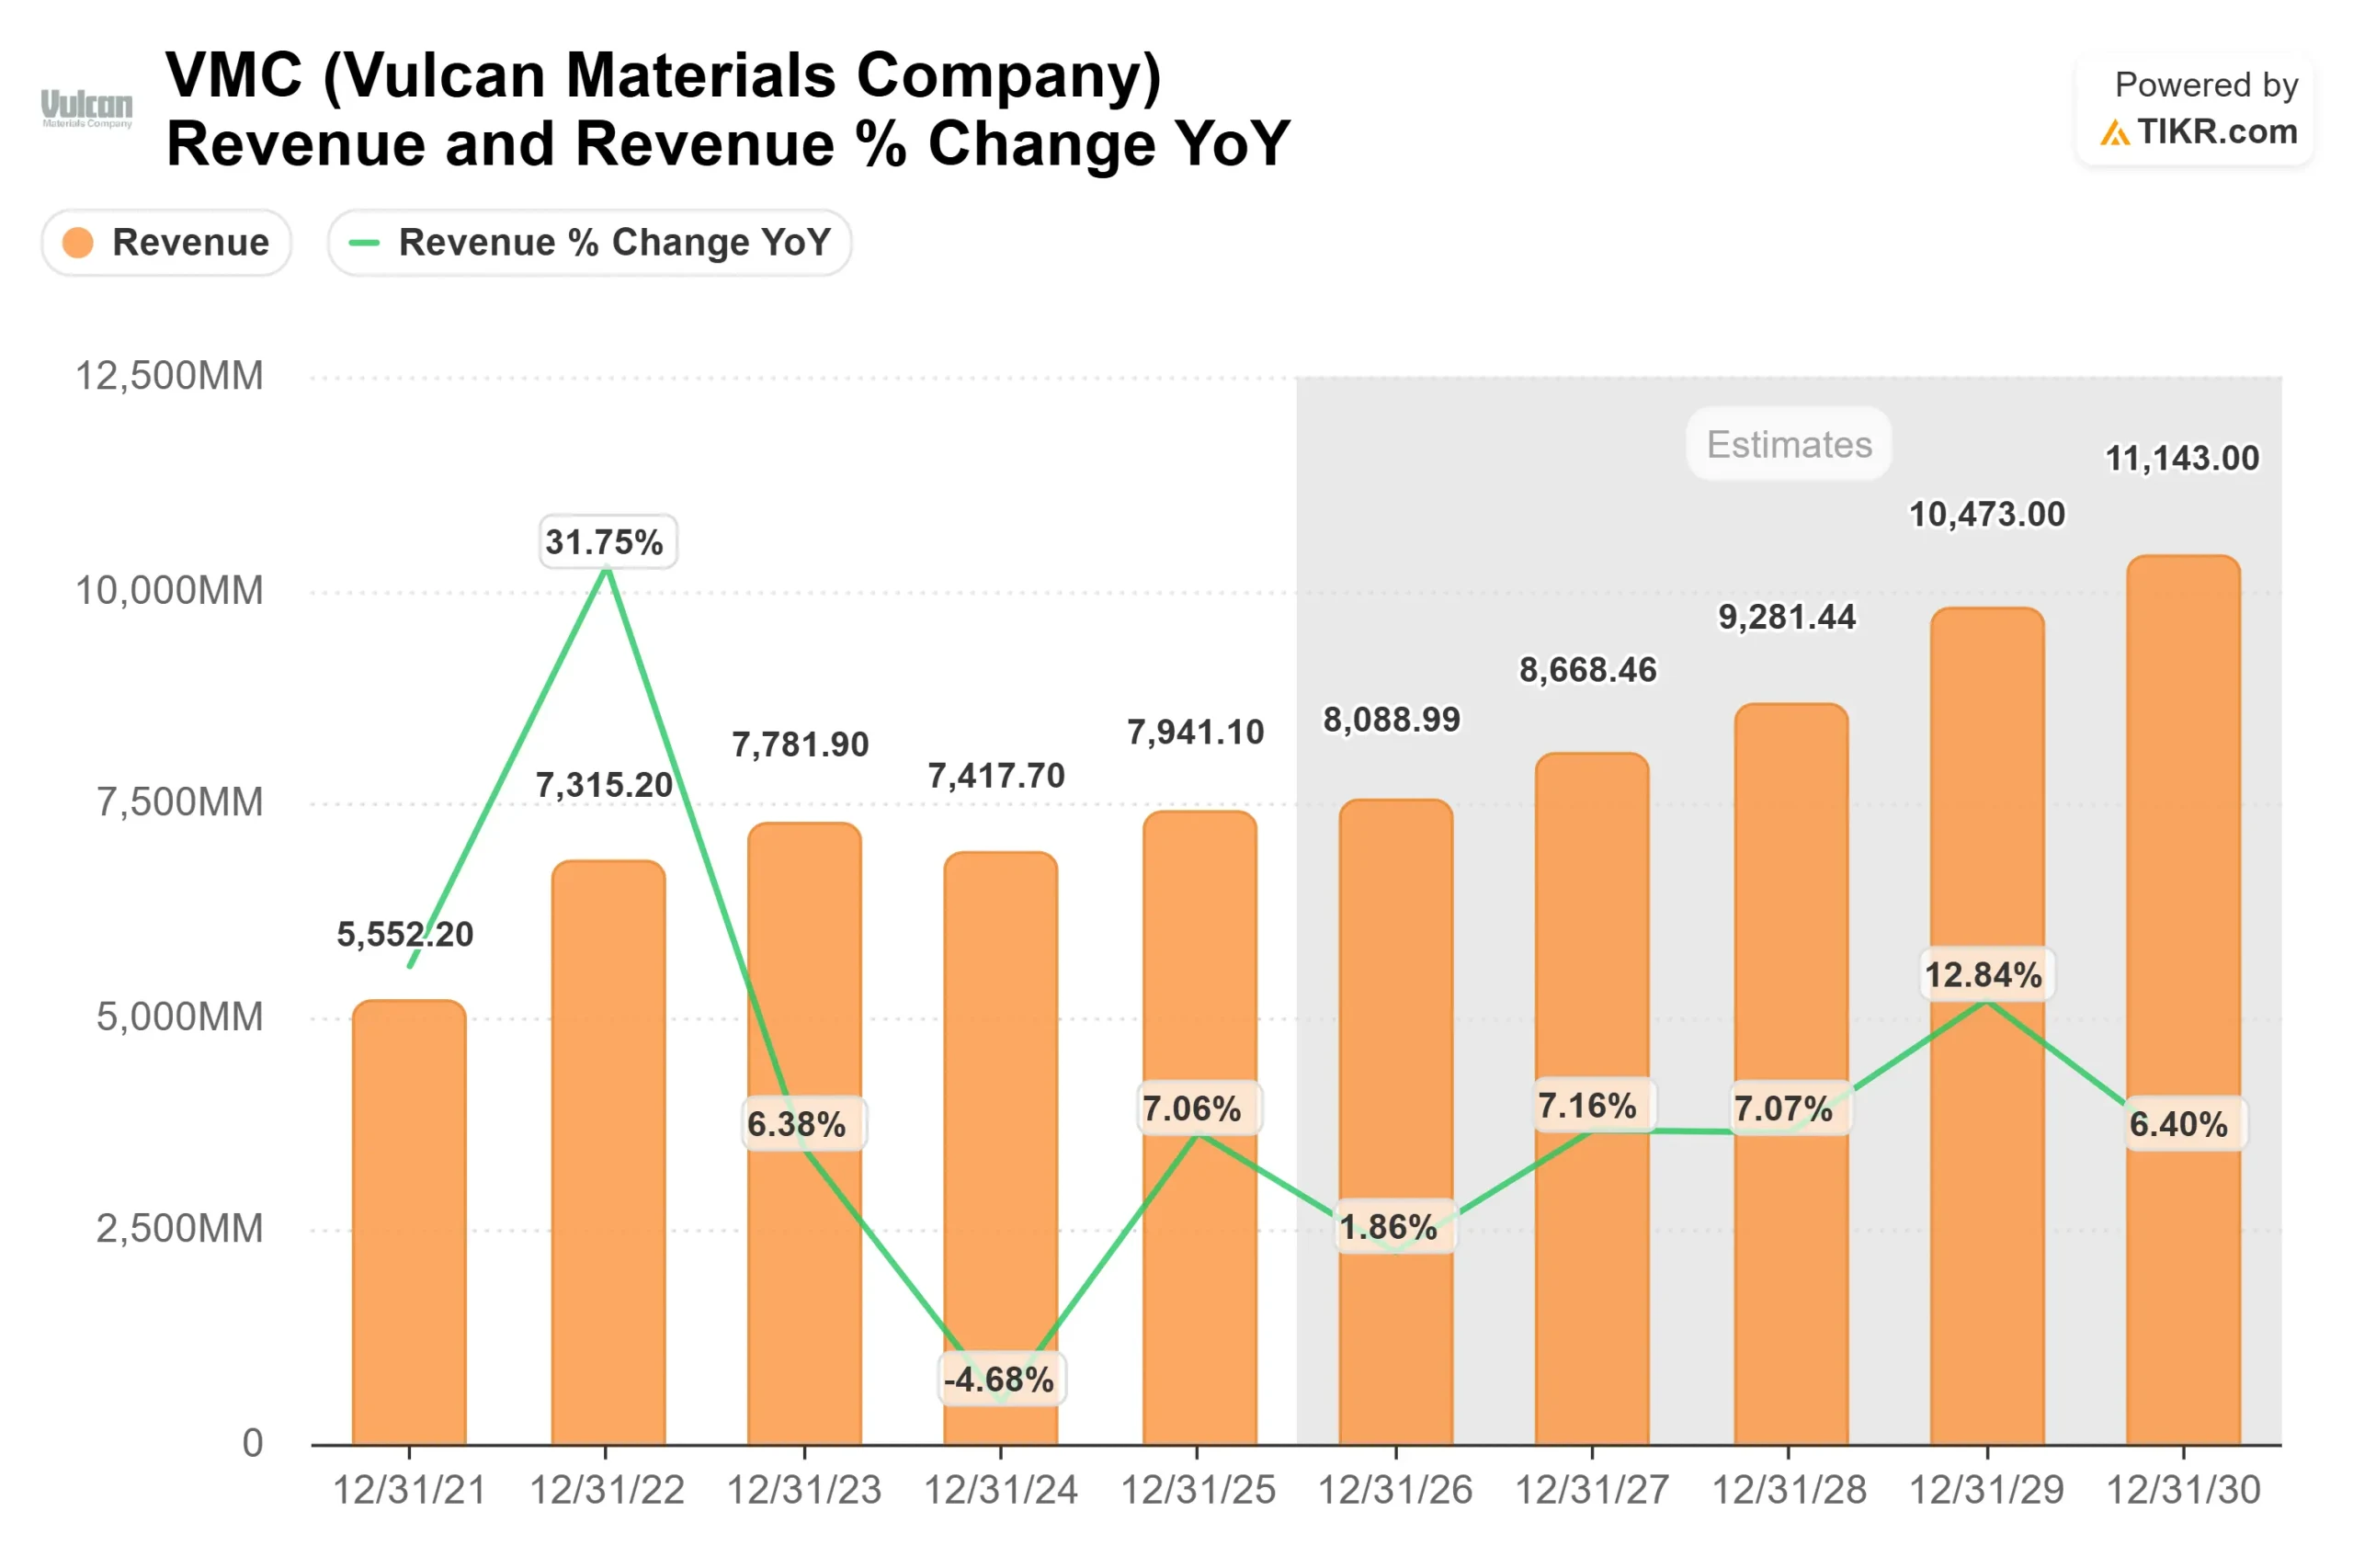
Revenue growth reflects steady aggregates demand tied to federal infrastructure programs, state highway budgets, and nonresidential construction rather than a housing-led surge.
The most meaningful driver remains aggregates pricing, where disciplined annual increases and freight optimization support margin expansion even with modest volume growth.
Operating margin expansion toward 24% assumes continued mix improvement, cost efficiency from Vulcan Way of Operating initiatives, and stronger project conversion from public and data center demand.
Large projects now represent roughly 45% of bookings versus a historical 30%, indicating stronger forward visibility into shipment growth.
Based on these inputs, the valuation model estimates a target price of $384, implying about 26% upside from current levels near $309, indicating the stock appears moderately undervalued.
Free cash flow strength and leverage near 1.8x provide flexibility for internal plant investment and strategic acquisitions, both of which can enhance regional density and pricing power.
In 2026, performance will likely be driven by pricing execution, infrastructure backlog realization, and sustained margin compounding rather than aggressive revenue acceleration.
Estimate a company’s fair value instantly (Free with TIKR) >>>
Value Any Stock in Under 60 Seconds (It’s Free)
With TIKR’s new Valuation Model tool, you can estimate a stock’s potential share price in under a minute.
All it takes is three simple inputs:
- Revenue Growth
- Operating Margins
- Exit P/E Multiple
From there, TIKR calculates the potential share price and total returns under Bull, Base, and Bear scenarios so you can quickly see whether a stock looks undervalued or overvalued.
If you’re not sure what to enter, TIKR automatically fills in each input using analysts’ consensus estimates, giving you a quick, reliable starting point.
See a stock’s true value in under 60 seconds (Free with TIKR) >>>