
Key Stats for United Airlines Stock
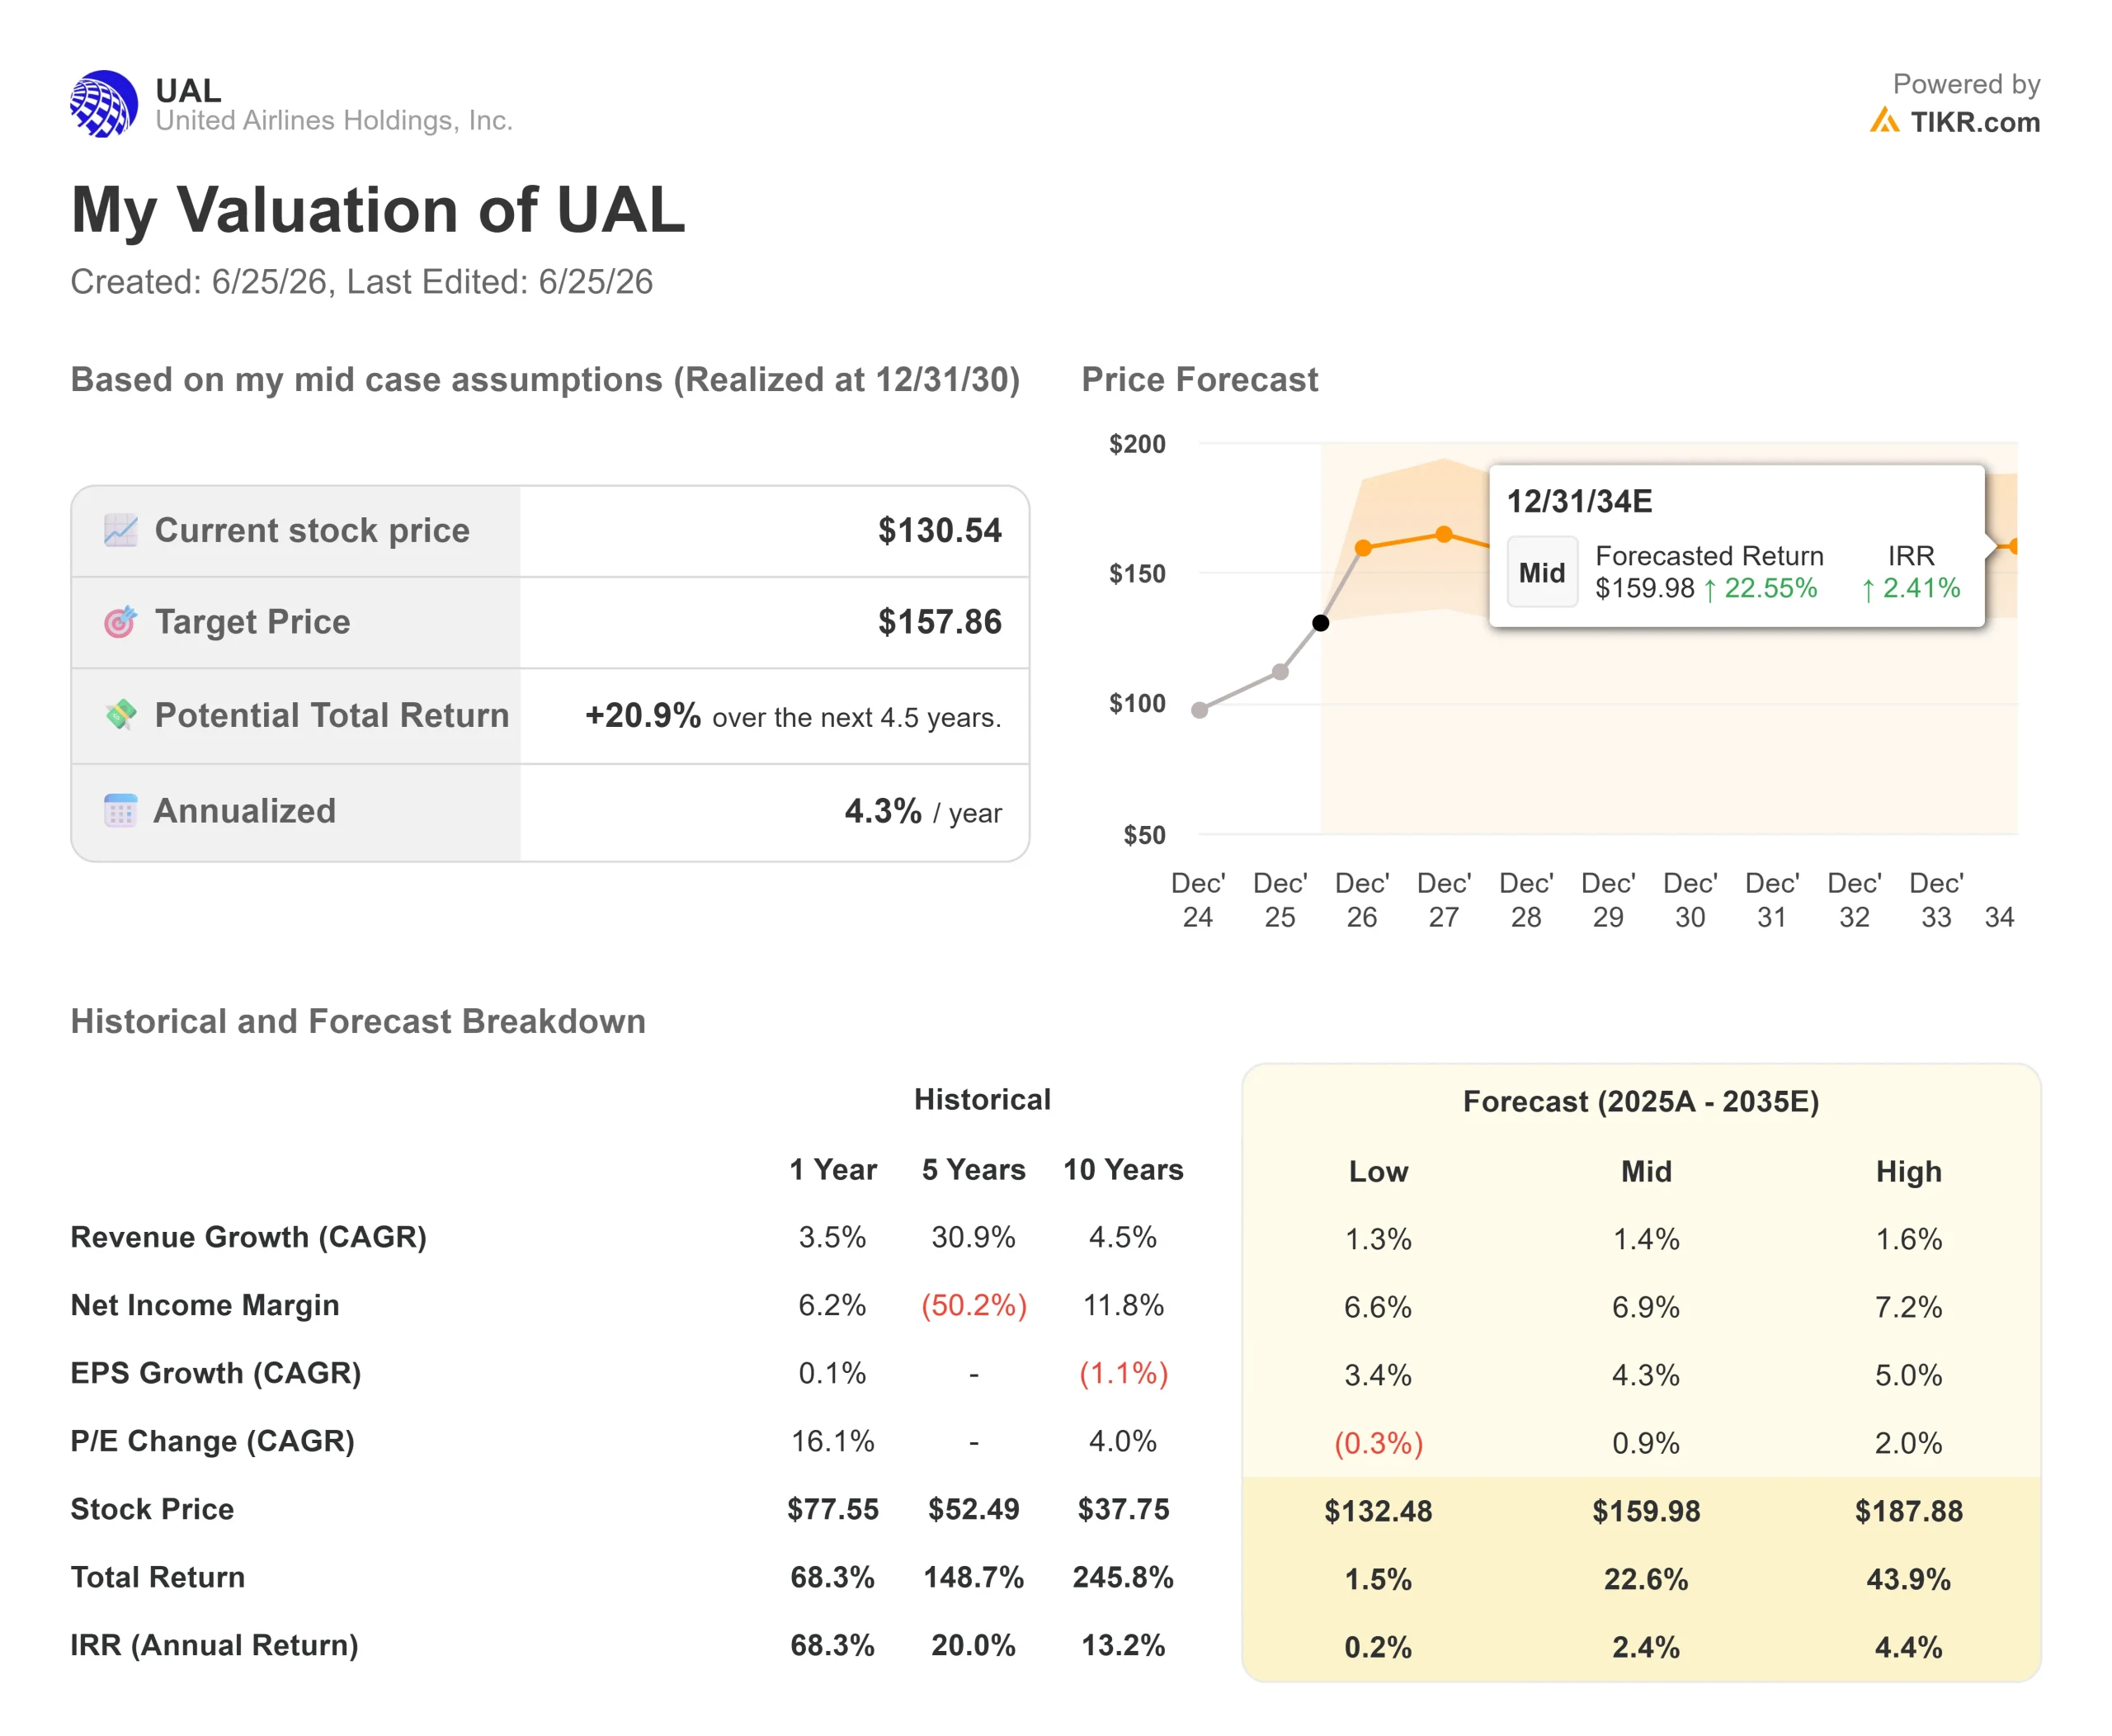
- Current Price: $130.54
- Target Price (Mid): ~$158
- Street Target: ~$133
- Potential Total Return: ~21%
- Annualized IRR: ~4% / year
- Earnings Reaction: (5.58%) (April 21, 2026)
- Max Drawdown: (27.50%) (March 30, 2026)
Now Live: Discover how much upside your favorite stocks could have using TIKR’s new Valuation Model (It’s free) >>>
What Happened?
United Airlines Holdings (UAL) closed at $130.54 on June 24, 2026, up 7.40% in a single session and at a record high. The cause was not subtle. Crude oil fell below $70 a barrel for the first time since early March, and UBS lifted its target the same week. For a business where fuel is the largest variable cost, cheaper oil reads straight through to earnings.
Here is the catch. At $130.54, the stock has already caught the Street’s average target of around $133. The cheap-oil trade that lifted United off its March lows is largely in the price. So the question for the United Airlines stock 2026 setup is no longer whether the recovery is real. It is what carries the stock from a record high once the fuel relief is paid for.
What Moved the Stock
Two things stacked on June 24. West Texas Intermediate crude, the U.S. oil benchmark, fell to roughly $69.84 a barrel as tankers resumed moving through the Strait of Hormuz after the U.S.-Iran peace agreement. Airline shares rose 3% to 7% across the board, and United led the large carriers.
The second catalyst was company-specific. UBS raised its price target to $153 from $148 on June 23, keeping a Buy rating. That target applies a multiple of 9 times UBS’s fiscal 2027 EPS estimate of about $17, well above where the Street models 2026. The takeaway investors heard: the earnings recovery has room to surprise as fuel normalizes.

See historical and forward estimates for United Airlines stock (It’s free!) >>>
Why the Move May Be Ahead of the Story
An oil-driven rally can reverse with oil. UBS itself flagged the risk, noting investors are unlikely to award higher multiples for earnings gains driven solely by cheaper fuel. Sustained revenue strength is what extends an airline rally, and United’s Q2 jet fuel is still tracking around $4.30 a gallon.
This is where management’s framing matters more than the oil tape. At the Bernstein Strategic Decisions Conference on May 27, 2026, CEO Scott Kirby argued the business does not need oil to cooperate. He said he is “increasingly confident that 2027 will be double-digit pretax margins” and that “nothing special needs to happen” to get there. That separates the fuel trade from the franchise: if Kirby is right, the earnings engine runs with or without $70 oil.
United has the record to back it. First-quarter 2026 revenue hit $14.6 billion, up 10.6% year over year, with adjusted EPS of $1.19, even after a $340 million higher fuel bill. Premium revenue rose 14% on only about 4% more capacity, the clearest sign the brand-loyalty strategy is pulling higher-paying customers onto the same planes.
The Loyalty Lever the Market Has Not Paid For
Kirby was explicit at Bernstein that the biggest untapped value lies in the loyalty program. He called the Chase partnership “a decade old” while rivals have modernized theirs, and said United expects to “double the EBITDA in that particular business” on top of the core airline. That is upside that does not depend on the price of jet fuel, and the oil-relief rally does not capture it.
The competitor angle cuts both ways. United trades at roughly 14x NTM P/E and around 7.8x NTM EV/EBITDA, a discount to where Delta’s earnings power gets valued. The bull reading is that the gap closes as United proves its margins. The bear reading is that Delta has earned that premium for a reason, and United has to deliver double-digit margins before the market hands it the same multiple.

See how United Airlines performs against its peers in TIKR (It’s free!) >>>
TIKR Advanced Model Analysis
- Current Price: $130.54
- Target Price (Mid): ~$158
- Potential Total Return: ~21%
- Annualized IRR: ~4% / year
See analysts’ growth forecasts and price targets for United Airlines stock (It’s free!) >>>
Using TIKR’s mid-case scenario, the model values United at around $158, implying roughly 21% total return from $130.54, or about 4% a year. The two revenue drivers are a modest top-line CAGR of around 1% to 2%, fitting a mature carrier at peak scale, and a premium-mix shift that lifts revenue per seat without adding capacity. The margin driver is net income margin expanding toward around 7% as fuel normalizes. The primary risk is fuel: a renewed crude spike compresses margins directly and fast.
The upside case is that loyalty re-rating and double-digit 2027 margins push the stock toward the high case above $180. The downside case is that fuel rebounds, the Street withholds a Delta-style multiple, and the stock gives back its oil-driven gains. The annualized return has thinned to around 4% precisely because the market has already closed much of the gap.
Conclusion
The next real test is mid-July, when United reports Q2 2026. Watch one number: full-year adjusted EPS guidance, currently $7 to $11. If management raises the floor as fuel falls, the 2027 double-digit-margin call gets concrete and the record high looks earned. If guidance holds flat or the fuel relief gets hedged into cautious language, this 7.40% pop will have front-run a recovery that still needs proof, and a stock at a record against a target it has already reached has little cushion. Kirby has been right about United’s structure for years. July tests whether the price has caught up to it.
See what stocks billionaire investors are buying so you can follow the smart money with TIKR.
Should You Invest in United Airlines?
The only way to really know is to look at the numbers yourself. TIKR gives you free access to the same institutional-quality financial data that professional analysts use to answer exactly that question.
Pull up United Airlines, and you’ll see years of historical financials, what Wall Street analysts expect for revenue and earnings in the quarters ahead, how valuation multiples have moved over time, and whether price targets are trending up or down.
You can build a free watchlist to track United Airlines alongside every other stock on your radar. No credit card required. Just the data you need to decide for yourself.
Analyze United Airlines on TIKR Free →
Looking for New Opportunities?
- See what stocks billionaire investors are buying so you can follow the smart money.
- Analyze stocks in as little as 5 minutes with TIKR’s all-in-one, easy-to-use platform.
- The more rocks you overturn… the more opportunities you’ll uncover. Search 100K+ global stocks, global top investor holdings, and more with TIKR.
Disclaimer:
Please note that the articles on TIKR are not intended to serve as investment or financial advice from TIKR or our content team, nor are they recommendations to buy or sell any stocks. We create our content based on TIKR Terminal’s investment data and analysts’ estimates. Our analysis might not include recent company news or important updates. TIKR has no position in any stocks mentioned. Thank you for reading, and happy investing!


