

Key Takeaways:
- AWS is now a $150 billion annualized revenue business growing at 28% year over year, its fastest pace in 15 quarters, and deserves a premium cloud multiple on its own.
- Amazon Advertising is on a $72 billion LTM revenue run rate and should be valued against Meta and Alphabet, not lumped in with retail.
- A blended earnings multiple on Amazon as a whole distorts all three segments.
- A sum-of-the-parts approach is the only framework that gives investors an accurate picture.
Now Live: Discover how much upside your favorite stocks could have using TIKR’s new Valuation Model (It’s free)>>>
Most investors look at Amazon (AMZN) and see one company. That is the first mistake.
Amazon is actually three very different businesses sharing one stock price. Each grows at a different speed. Each earns a different profit margin. And each deserves its own valuation framework.
If you apply a single earnings multiple to the entire company, you are not analyzing Amazon. You are guessing.
The only honest approach is a sum-of-the-parts (SOTP) valuation, in which you break the company into its core segments and assign each segment an appropriate comparable multiple.
The Q1 earnings results make this clearer than ever.
AWS is the backbone of the AI economy
Amazon Web Services (AWS) is where the real valuation story lives.
AWS generated $37.6 billion in revenue in Q1, up 28% year over year, which Amazon CEO Andy Jassy called the fastest growth rate in 15 quarters. That puts AWS on a $150 billion annualized revenue run rate.
To put that in perspective: AWS is now growing at this pace on a base nearly double its level when it last grew this fast.
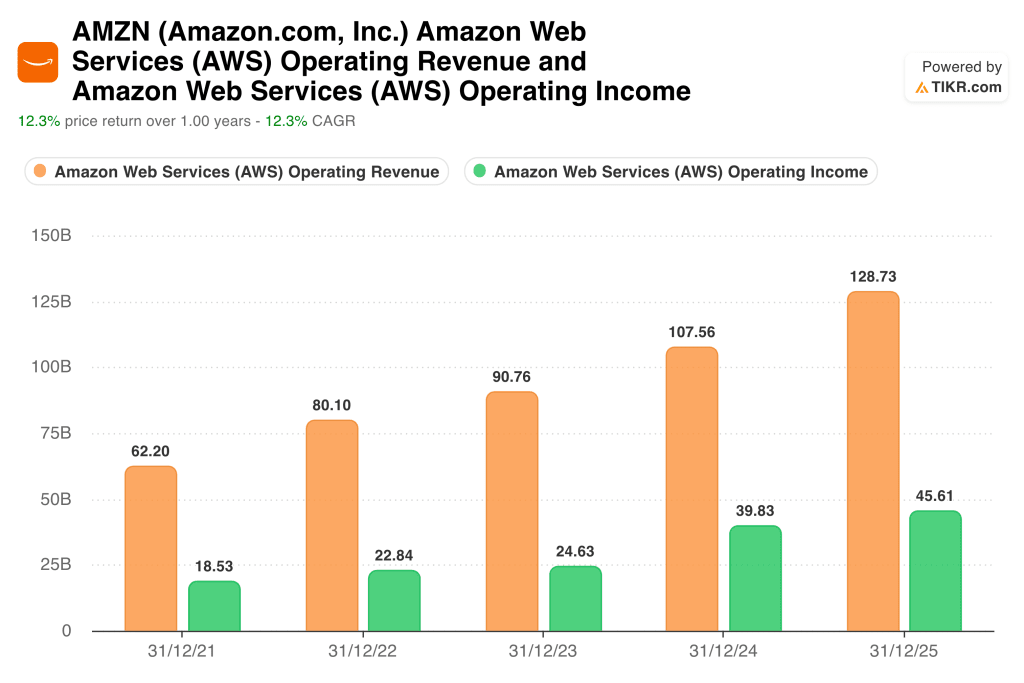
AWS operating income came in at $14.2 billion in Q1. On a last 12 months (LTM) basis, AWS operating income sits at $48.2 billion, per segment data. That is a margin profile that rivals any premium software business on the planet.
The right valuation framework here is enterprise value-to-operating income, benchmarked against Microsoft’s Azure and Alphabet’s Google Cloud Platform (GCP) as comparables.
Apply the multiples the market gives to those businesses, and AWS alone could command a valuation well above $1 trillion.
The artificial intelligence angle is not background noise. AWS AI revenue is growing triple digits year over year. Jassy said on the earnings call that AWS backlog stands at $364 billion. That figure does not even include a recently announced deal with Anthropic worth over $100 billion.
The two metrics every investor should track here are AWS revenue growth and operating margin. When Jassy talks about “AWS reacceleration” and “AI services adoption,” those are not empty phrases. They are the primary forward signal for this segment’s earning power.
See analysts’ full growth forecasts and estimates for AMZN stock (It’s free) >>>
North America retail is a logistics machine, not a tech company
Amazon’s North America retail segment posted $104.1 billion in revenue in Q1, up 12% year over year. Operating income for the segment came in at $8.3 billion, with a margin of 7.9%.
The right comparable for North American retail is Walmart (WMT), along with other large-scale retail peers, valued on an enterprise value-to-revenue basis.
Retail is a high-volume, thin-margin business. The investment thesis here is not explosive growth. It is a steady expansion of the margin as fulfillment automation compounds over time.

That automation is real and accelerating.
Amazon CFO Brian Olsavsky noted that 15% year-over-year unit growth outpaced fulfillment cost growth of just 9%.
The network is getting more efficient as it scales. Every U.S. large-format fulfillment center launched in 2026 will carry the company’s latest robotics generation.
AI is doing the same thing in retail that it does in AWS, except here the payoff shows up as cost savings rather than revenue acceleration. Watch the North America operating margin every quarter. That single number tells you how well the automation story is executing.
Estimate a company’s fair value instantly (Free with TIKR) >>>
Advertising is the sleeper segment that deserves a Meta-style multiple
Here is the part of Amazon most investors consistently undervalue.
Amazon Advertising generated $17.2 billion in Q1 revenue, up 22% year over year. On an LTM basis, advertising revenue now stands at $72 billion. That puts it firmly in the same conversation as Meta Platforms and Alphabet.
The correct framework here is a revenue multiple benchmarked against those two advertising giants. Advertising carries a completely different cost structure than warehousing and shipping. The margins are far higher.
AI is sharpening the advertising flywheel, too. Amazon expanded its Creative Agent, which plans and executes the full ad creative process, across seven new markets in Q1.
It also introduced sponsored prompts inside Rufus, its AI shopping assistant. Nearly 20% of shoppers who interact with brand prompts in Rufus continue the conversation about that brand, according to Jassy on the call.
If you spun advertising out as a standalone business and applied a Meta-style revenue multiple, it would be worth hundreds of billions of dollars.
Build your own Valuation Model to value any stock (It’s free!) >>>
Why the blended multiple approach fails Amazon investors every time
Pull up the segment data, and the picture becomes unavoidable.
- AWS LTM operating income: $48.2 billion.
- North America LTM operating income: $32 billion.
- International LTM operating income: $5.2 billion.
These three segments have completely different growth rates, margin structures, and competitive dynamics.
Treating them as a single blended entity is like owning a gold mine, a grocery chain, and a billboard company and valuing all three at the same average margin. The math will mislead you every time.

An honest SOTP model adds the individually valued segments together, subtracts net debt, and arrives at a per-share intrinsic value. That exercise will almost certainly produce a very different number than what a blended price-to-earnings multiple suggests.
Amazon is in the midst of several major business inflection points at once. The only way to track them properly is to watch each segment on its own terms, with the right comps for each one.
See what analysts think about AMZN stock right now (Free with TIKR) >>>
How Much Upside Does Amazon Stock Have From Here?
With TIKR’s new Valuation Model tool, you can estimate a stock’s potential share price in under a minute.
All it takes is three simple inputs:
- Revenue Growth
- Operating Margins
- Exit P/E Multiple
If you’re not sure what to enter, TIKR automatically fills in each input using analysts’ consensus estimates, giving you a quick, reliable starting point.
From there, TIKR calculates the potential share price and total returns under Bull, Base, and Bear scenarios so you can quickly see whether a stock looks undervalued or overvalued.
See a stock’s true value in under 60 seconds (Free with TIKR) >>>
Looking for New Opportunities?
- See what stocks billionaire investors are buying so you can follow the smart money.
- Analyze stocks in as little as 5 minutes with TIKR’s all-in-one, easy-to-use platform.
- The more rocks you overturn… the more opportunities you’ll uncover. Search 100K+ global stocks, global top investor holdings, and more with TIKR.
Disclaimer:
Please note that the articles on TIKR are not intended to serve as investment or financial advice from TIKR or our content team, nor are they recommendations to buy or sell any stocks. We create our content based on TIKR Terminal’s investment data and analysts’ estimates. Our analysis might not include recent company news or important updates. TIKR has no position in any stocks mentioned. Thank you for reading, and happy investing!


