Key Stats for Target Stock
- 52-Week Range: $83 to $133
- Current Price: $131
- Street Mean Target: $125
- Street High Target: $160
- Analyst Consensus: 9 Buys / 2 Outperforms / 23 Holds / 3 Underperforms
- TIKR Model Target (Dec. 2030): $176
What Happened?
Target (TGT), the Minneapolis-based big-box retailer known for its design-led merchandise and same-day delivery services, has surged 57% off its 52-week low of $83.44 even as the underlying business posted its fifth consecutive quarter of revenue declines.
New CEO Michael Fiddelke, who took the helm February 1, unveiled a $6 billion investment plan at the company’s March investor day, including $5 billion in capital expenditures and $1 billion reinvested into the P&L for store labor, marketing, and technology.
The centerpiece of the early turnaround effort is a price reset on more than 3,000 products across apparel, home goods, and daily essentials, with most cuts running 5% to 20% below original prices, designed to win back value-conscious shoppers lost to Walmart and Amazon over the past three years.
Fiddelke stated on the Q4 FY2026 investor day call that “Target’s new chapter is all about fueling growth, and we’ll do so by playing our own game and making big changes to delight our guests,” pointing to February’s sales trends as early confirmation the strategy is gaining traction.
The company guided FY2026 for net sales growth of approximately 2% and adjusted EPS of $7.50 to $8.50, representing roughly 5% to 6% earnings growth at the midpoint, with Q1 expected to be flat to up slightly before the investment plan’s benefits accelerate in the back half of the year.
Wall Street’s Take on TGT Stock
The run in Target stock from $83 to $131 represents the market getting ahead of a turnaround that, as of Q1 guidance, has not yet shown up in reported earnings growth.
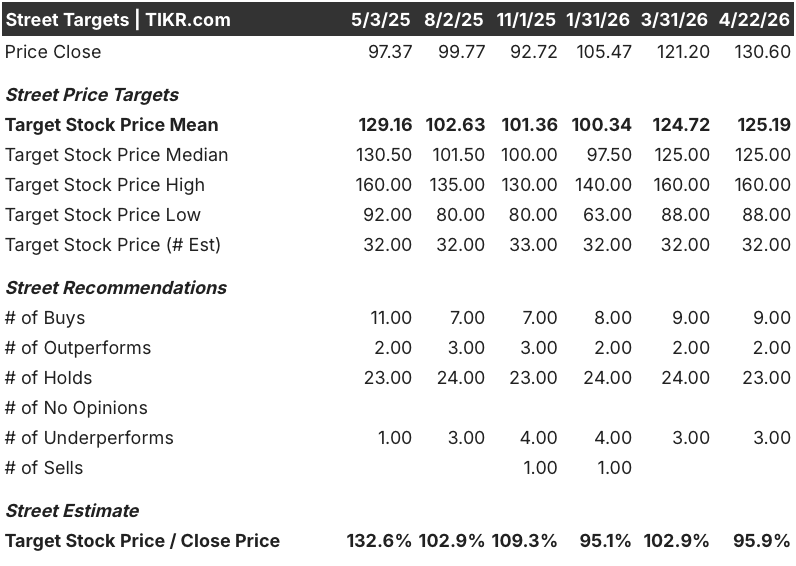
Eleven analysts rate Target stock a buy or outperform, but 23 hold and 3 underperform, with a mean price target of $125, meaning the current price sits roughly 4% above where the median analyst believes the stock should be.
The target spread captures the debate cleanly: the high sits at $160 while the low sits at $88, a $72 range reflecting genuine disagreement between bulls who see Fiddelke’s $6 billion investment plan as a credible multi-year compounding story and bears who point to five straight quarters of revenue declines and a Q1 outlook of flat earnings as evidence the recovery is not yet earned.
Priced at $131, sitting just below its 52-week high of $133 while the street consensus clusters at $125 and the majority of covering analysts remain on hold, Target stock appears fairly valued as the market prices in a full turnaround before the first full quarter under the new strategy is even on the books.
If consumer spending deteriorates further under energy-price and tariff pressure, the $6 billion investment commitment becomes a fixed cost headwind rather than a growth catalyst, and the 4.8% operating margin target for FY2026 faces real downside risk.
Comparable sales growth in Q1 FY2027, the first quarter with the full investment plan in effect, is the number to watch: Fiddelke has guided for growth in every quarter this year, and any miss will test whether the 57% rally from the lows was justified.
What Does the Valuation Model Say?
TIKR’s mid-case model targets Target stock at $176, anchored to a 2.9% revenue CAGR and net income margins recovering toward 3.8%, assumptions that require Fiddelke’s store investment and price repositioning to translate into durable traffic and basket-size gains over the next several years.
The model’s extended scenario reaches $237 by FY2035 at a 7% annualized return, with the low case of $192 representing a 47% total return from current levels — suggesting meaningful long-term upside if the turnaround executes.
At $131, above the $125 street consensus but below the $176 TIKR mid-case, Target stock is fairly valued for investors who believe the recovery is real but want to see it confirmed before adding exposure.

The central tension is whether $6 billion in incremental investment over a single year generates enough traffic and comp sales improvement to justify the near-term margin compression it demands.
Bull Case
- Remodeled stores produce consistent 2% to 4% same-store sales lifts in year 1, and the 130+ remodels planned for FY2026 represent the most aggressive in-store renewal program Target has run in over a decade
- Target Circle 360 membership doubled in FY2025, and members who use same-day delivery services spend 7x more than non-loyalty shoppers, creating a compounding retention engine that grows independent of the macro backdrop
- Good & Gather, Target’s largest owned food brand, is on pace to reach $4 billion in annual sales, providing a durable margin-rich revenue stream that peers cannot easily replicate
- February FY2026 sales growth was explicitly described as “healthy” and broad-based, including traffic gains, suggesting the turnaround is already touching the leading indicators Fiddelke flagged
Bear Case
- Five consecutive quarters of revenue decline and a FY2025 adjusted EPS drop of 14% to $7.57 establish that the business is recovering from a deep hole, not building off strength, and the 2% net sales growth guide barely offsets years of lost ground
- The $6 billion investment plan is front-loaded with costs: Q1 FY2026 EPS is guided flat to only slightly above $1.30, meaning shareholders are absorbing the investment before any meaningful return materializes
- At $131, Target stock trades above its $125 mean analyst target with only 30% of covering analysts at buy or outperform, a consensus posture that signals the street sees limited upside at current prices relative to execution risk
- Tariff and energy cost pressures are ongoing, and Fiddelke explicitly acknowledged ongoing macroeconomic uncertainty as a key variable, with lower-income consumers already showing measurable spending strain across the retail sector
Should You Invest in Target Corporation?
The only way to really know is to look at the numbers yourself. TIKR gives you free access to the same institutional-quality financial data that professional analysts use to answer exactly that question.
Pull up TGT stock and you’ll see years of historical financials, what Wall Street analysts expect for revenue and earnings in the quarters ahead, how valuation multiples have moved over time, and whether price targets are trending up or down.
You can build a free watchlist to track Target Corporation alongside every other stock on your radar. No credit card required. Just the data you need to decide for yourself.
Access Professional Tools to Analyze TGT stock on TIKR for Free →