Key Stats for T-Mobile Stock
- Past-Week Performance: +2%
- 52-Week Range: $181.4 to $276.5
- Current Price: $222
What Happened?
After 17 years and 35 consecutive J.D. Power reports, T-Mobile finally dethroned Verizon as America’s top-rated network, and at $220.1, down just 0.9%, the market has yet to fully reprice what that competitive shift means for subscriber momentum ahead.
Reinforcing that conviction, Viking Global raised its T-Mobile stake by 15.1% to 3.8 million shares as of December 31, signaling that one of the most sophisticated institutional players sees the current price as a compelling entry point before the growth story fully accelerates.
The engine powering that confidence is T-Mobile’s Q4 earnings call delivery: 261,000 postpaid net account additions, 10x what the next competitor reported, service revenue up 10% year-over-year, and a free cash flow conversion rate of 22% that no peer in the industry matches.
Consequently, the market is actively re-rating T-Mobile from a mature telecom compounder into a multi-vertical growth platform, as its broadband business targets 18 to 19 million total customers by 2030 and new verticals including T-Ads, T-Fiber, and T-Mobile Visa add revenue streams that traditional wireless multiples never priced in.
President and CEO Srinivasan Gopalan stated on the Q4 earnings call that T-Mobile today holds the number one ranking in network quality as judged by J.D. Power after 35 reports and 17 years, directly validating the company’s multi-year spectrum and 5G stand-alone core investment thesis.
Further cementing institutional confidence, Deutsche Telekom announced on February 11 that it will not sell any T-Mobile U.S. shares in 2026 and is actively exploring strategic alternatives to deepen its investment, effectively removing a major overhang and amplifying the $5 billion Q1 share buyback acceleration.
Looking out 3 to 5 years, T-Mobile’s convergence of best network, best value, and best experience positions it to capture the remaining under-indexed network seeker population, scale broadband to nearly 19 million customers, and compound free cash flow at an industry-leading pace that competitors structurally cannot replicate.
Wall Street’s Take on T-Mobile Stock
With T-Mobile’s Capital Markets Day raising its broadband target to 15 million FWA customers by 2030, accelerating Q1 share buybacks to $5 billion, and locking in Deutsche Telekom’s commitment to hold all shares through 2026, the stock’s forward trajectory shifts decisively from execution story to compounding machine.
Fundamentally, the bull case rests on T-Mobile’s FY 2026 service revenue guidance of approximately $77 billion, representing 8% reported growth, paired with EPS expanding from $10.7 in 2025 to an estimated $11.3 in 2026, as EBITDA margins push toward 39.4%.
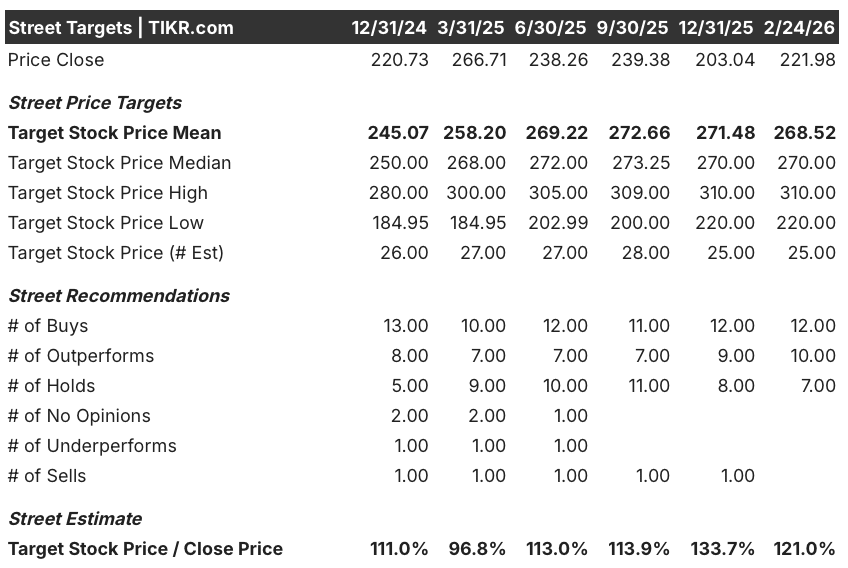
Wall Street stands firmly behind TMUS stock with 12 buys, 10 outperforms, and just 7 holds among 25 covering analysts, backing a mean price target of $268.5 against the current $220.1, as analysts anticipate T-Mobile’s broadband expansion, AI-driven cost savings, and sustained account growth to close that 21.1% gap.
The target spread runs from $220 on the low end to $310 on the high end, and where the stock ultimately lands depends on whether T-Mobile’s AI-driven $2.7 billion efficiency savings, FWA subscriber momentum, and T-Fiber ramp materialize on the aggressive timelines management outlined on February 11.
What Does the Valuation Model Say?
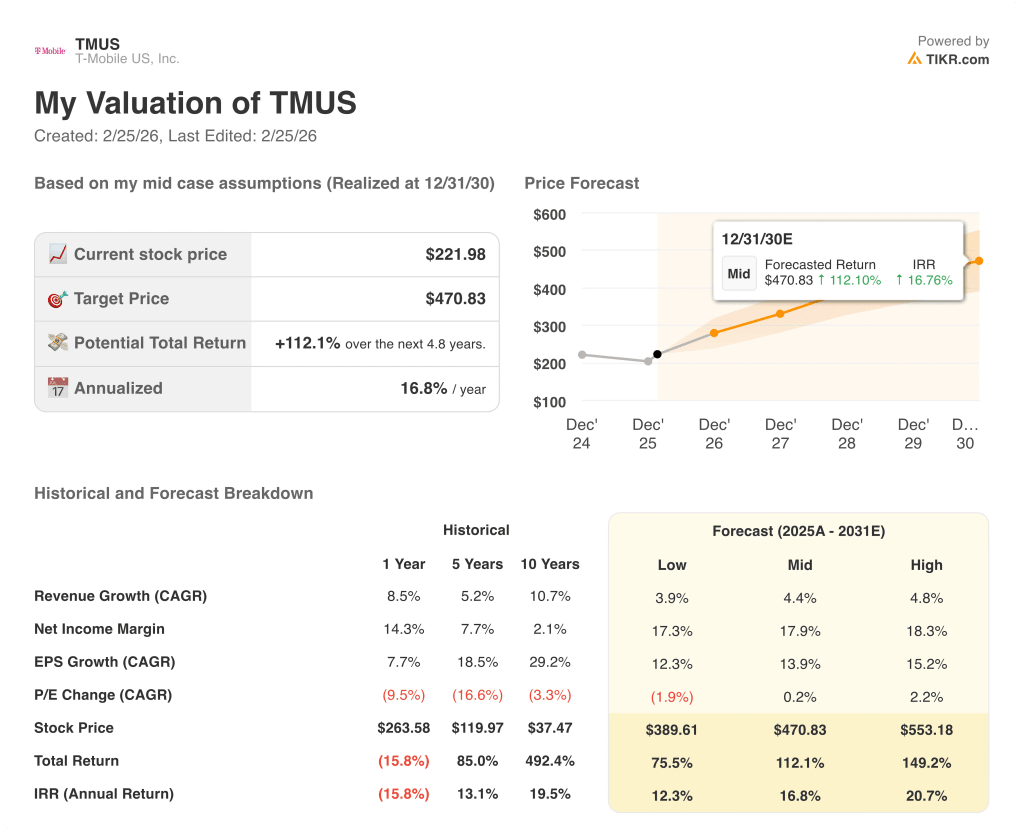
Backed by T-Mobile’s landmark J.D. Power #1 network ranking, its $5 billion Q1 buyback acceleration, and broadband targets revised sharply upward, a mid-case valuation model prices TMUS at $470.8, pointing to a 112.1% total return over 4.8 years at a 16.8% annualized IRR.
The primary risk is multiple compression: with P/E CAGR historically running negative at (9.5%) over one year and (16.6%) over five years, any deceleration in subscriber account growth or margin expansion below the 2.5% to 3% ARPA guidance range could weigh heavily on the stock’s re-rating story.
Altogether, TMUS looks undervalued at $220.1 given its #1 network position, 18 to 19 million broadband customer target by 2030, $52 billion capital allocation envelope, and a valuation model pointing to $470.8, though investors should watch Q1 account net additions and ARPA trajectory as the clearest early signals of whether this compounding thesis holds.
Should You Invest in T-Mobile US, Inc.?
The only way to really know is to look at the numbers yourself. TIKR gives you free access to the same institutional-quality financial data that professional analysts use to answer exactly that question.
Pull up TMUS stock and you’ll see years of historical financials, what Wall Street analysts expect for revenue and earnings in the quarters ahead, how valuation multiples have moved over time, and whether price targets are trending up or down.
You can build a free watchlist to track T-Mobile US, Inc. alongside every other stock on your radar. No credit card required. Just the data you need to decide for yourself.
Access Professional Tools to Analyze TMUS stock on TIKR for Free →