Key Stats for Workday Stock
- Pre-Market Price change for Workday stock: -10%
- $WDAY Share Price as of Feb. 24: $130
- 52-Week High: $281
- $WDAY Stock Price Target: $231
Now Live: Discover how much upside your favorite stocks could have using TIKR’s new Valuation Model (It’s free)>>>
What Happened?
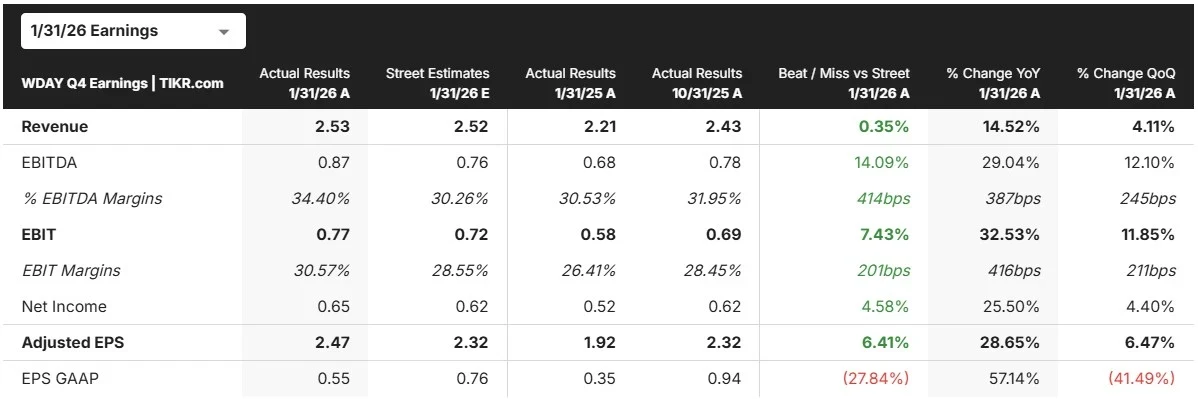
Workday (WDAY) stock plunged more than 10% in after-hours trading Tuesday after the enterprise software company issued weaker-than-expected guidance for the current quarter and full fiscal year.
- While Workday beat earnings estimates at $2.47 per share versus the expected $2.32, and revenue came in slightly ahead at $2.53 billion, investors focused on the disappointing outlook ahead.
- The company guided for first-quarter subscription revenue of $2.335 billion, falling short of the $2.35 billion analysts expected.
- For the full fiscal year 2027, Workday projected subscription revenue between $9.93 billion and $9.95 billion, implying growth of 12% to 13%.
- The company also set a fiscal-year operating margin target of 30%, below some investors’ expectations, signaling increased spending on AI initiatives.
Co-founder Aneel Bhusri, who recently returned as CEO after Carl Eschenbach stepped down earlier this month, acknowledged the company is prioritizing growth investments over near-term margin expansion.
Chief commercial officer Rob Enslin noted that some large enterprise deals are taking longer to close, particularly in the federal government and healthcare sectors, which impacted fourth-quarter results.
Workday stock has been under intense pressure in 2026, down 39% year-to-date before Tuesday’s after-hours selloff, which could mark the steepest decline in the stock price since the company went public.
See analysts’ growth forecasts and price targets for Workday stock (It’s free!) >>>
What the Market Is Telling Us About Workday Stock
The steep decline in Workday stock reflects growing investor anxiety about how AI might disrupt traditional software companies.
Despite management’s confidence that AI will enhance rather than replace Workday’s core HR and finance applications, the market appears skeptical about the company’s ability to maintain its growth trajectory.
On the positive side, Workday reported strong traction with its AI offerings, generating over $400 million in annualized revenue from emerging AI products and delivering 1.7 billion AI actions across its platform in fiscal 2026.
The company is rolling out multiple AI agents to automate HR and finance tasks, and recent acquisitions such as Sana and Pipedream demonstrate Workday’s commitment to expanding its AI capabilities.

However, Workday stock faces a challenge common across the software sector: converting AI hype into actual revenue growth.
The company’s shift toward a consumption-based “Flex Credits” pricing model for AI features could drive acceleration in the second half of the year, but this transition may also create near-term revenue uncertainty.
CFO Zane Rowe emphasized that management expects AI adoption to ramp throughout fiscal 2027, particularly in the back half.
Investors should watch whether Workday can prove that its deep integration with customer systems and 20 years of domain expertise in HR and finance create a defensible moat against pure-play AI competitors.
The company maintains strong fundamentals, with a 97% gross retention rate and solid cash flow of $2.78 billion in fiscal 2026.
But until Workday demonstrates that AI investments can reaccelerate growth rather than just maintain the status quo, the stock is likely to remain under pressure.
Estimate a company’s fair value instantly (Free with TIKR) >>>
How Much Upside Does Workday Stock Have From Here?
With TIKR’s new Valuation Model tool, you can estimate a stock’s potential share price in under a minute.
All it takes is three simple inputs:
- Revenue Growth
- Operating Margins
- Exit P/E Multiple
If you’re not sure what to enter, TIKR automatically fills in each input using analysts’ consensus estimates, giving you a quick, reliable starting point.
From there, TIKR calculates the potential share price and total returns under Bull, Base, and Bear scenarios so you can quickly see whether a stock looks undervalued or overvalued.
See a stock’s true value in under 60 seconds (Free with TIKR) >>>
Looking for New Opportunities?
- See what stocks billionaire investors are buying so you can follow the smart money.
- Analyze stocks in as little as 5 minutes with TIKR’s all-in-one, easy-to-use platform.
- The more rocks you overturn… the more opportunities you’ll uncover. Search 100K+ global stocks, global top investor holdings, and more with TIKR.
Disclaimer:
Please note that the articles on TIKR are not intended to serve as investment or financial advice from TIKR or our content team, nor are they recommendations to buy or sell any stocks. We create our content based on TIKR Terminal’s investment data and analysts’ estimates. Our analysis might not include recent company news or important updates. TIKR has no position in any stocks mentioned. Thank you for reading, and happy investing!