

Key Stats for Xcel Energy Stock
- Past-6-Month Performance: 14%
- 52-Week Range: $65 to $84
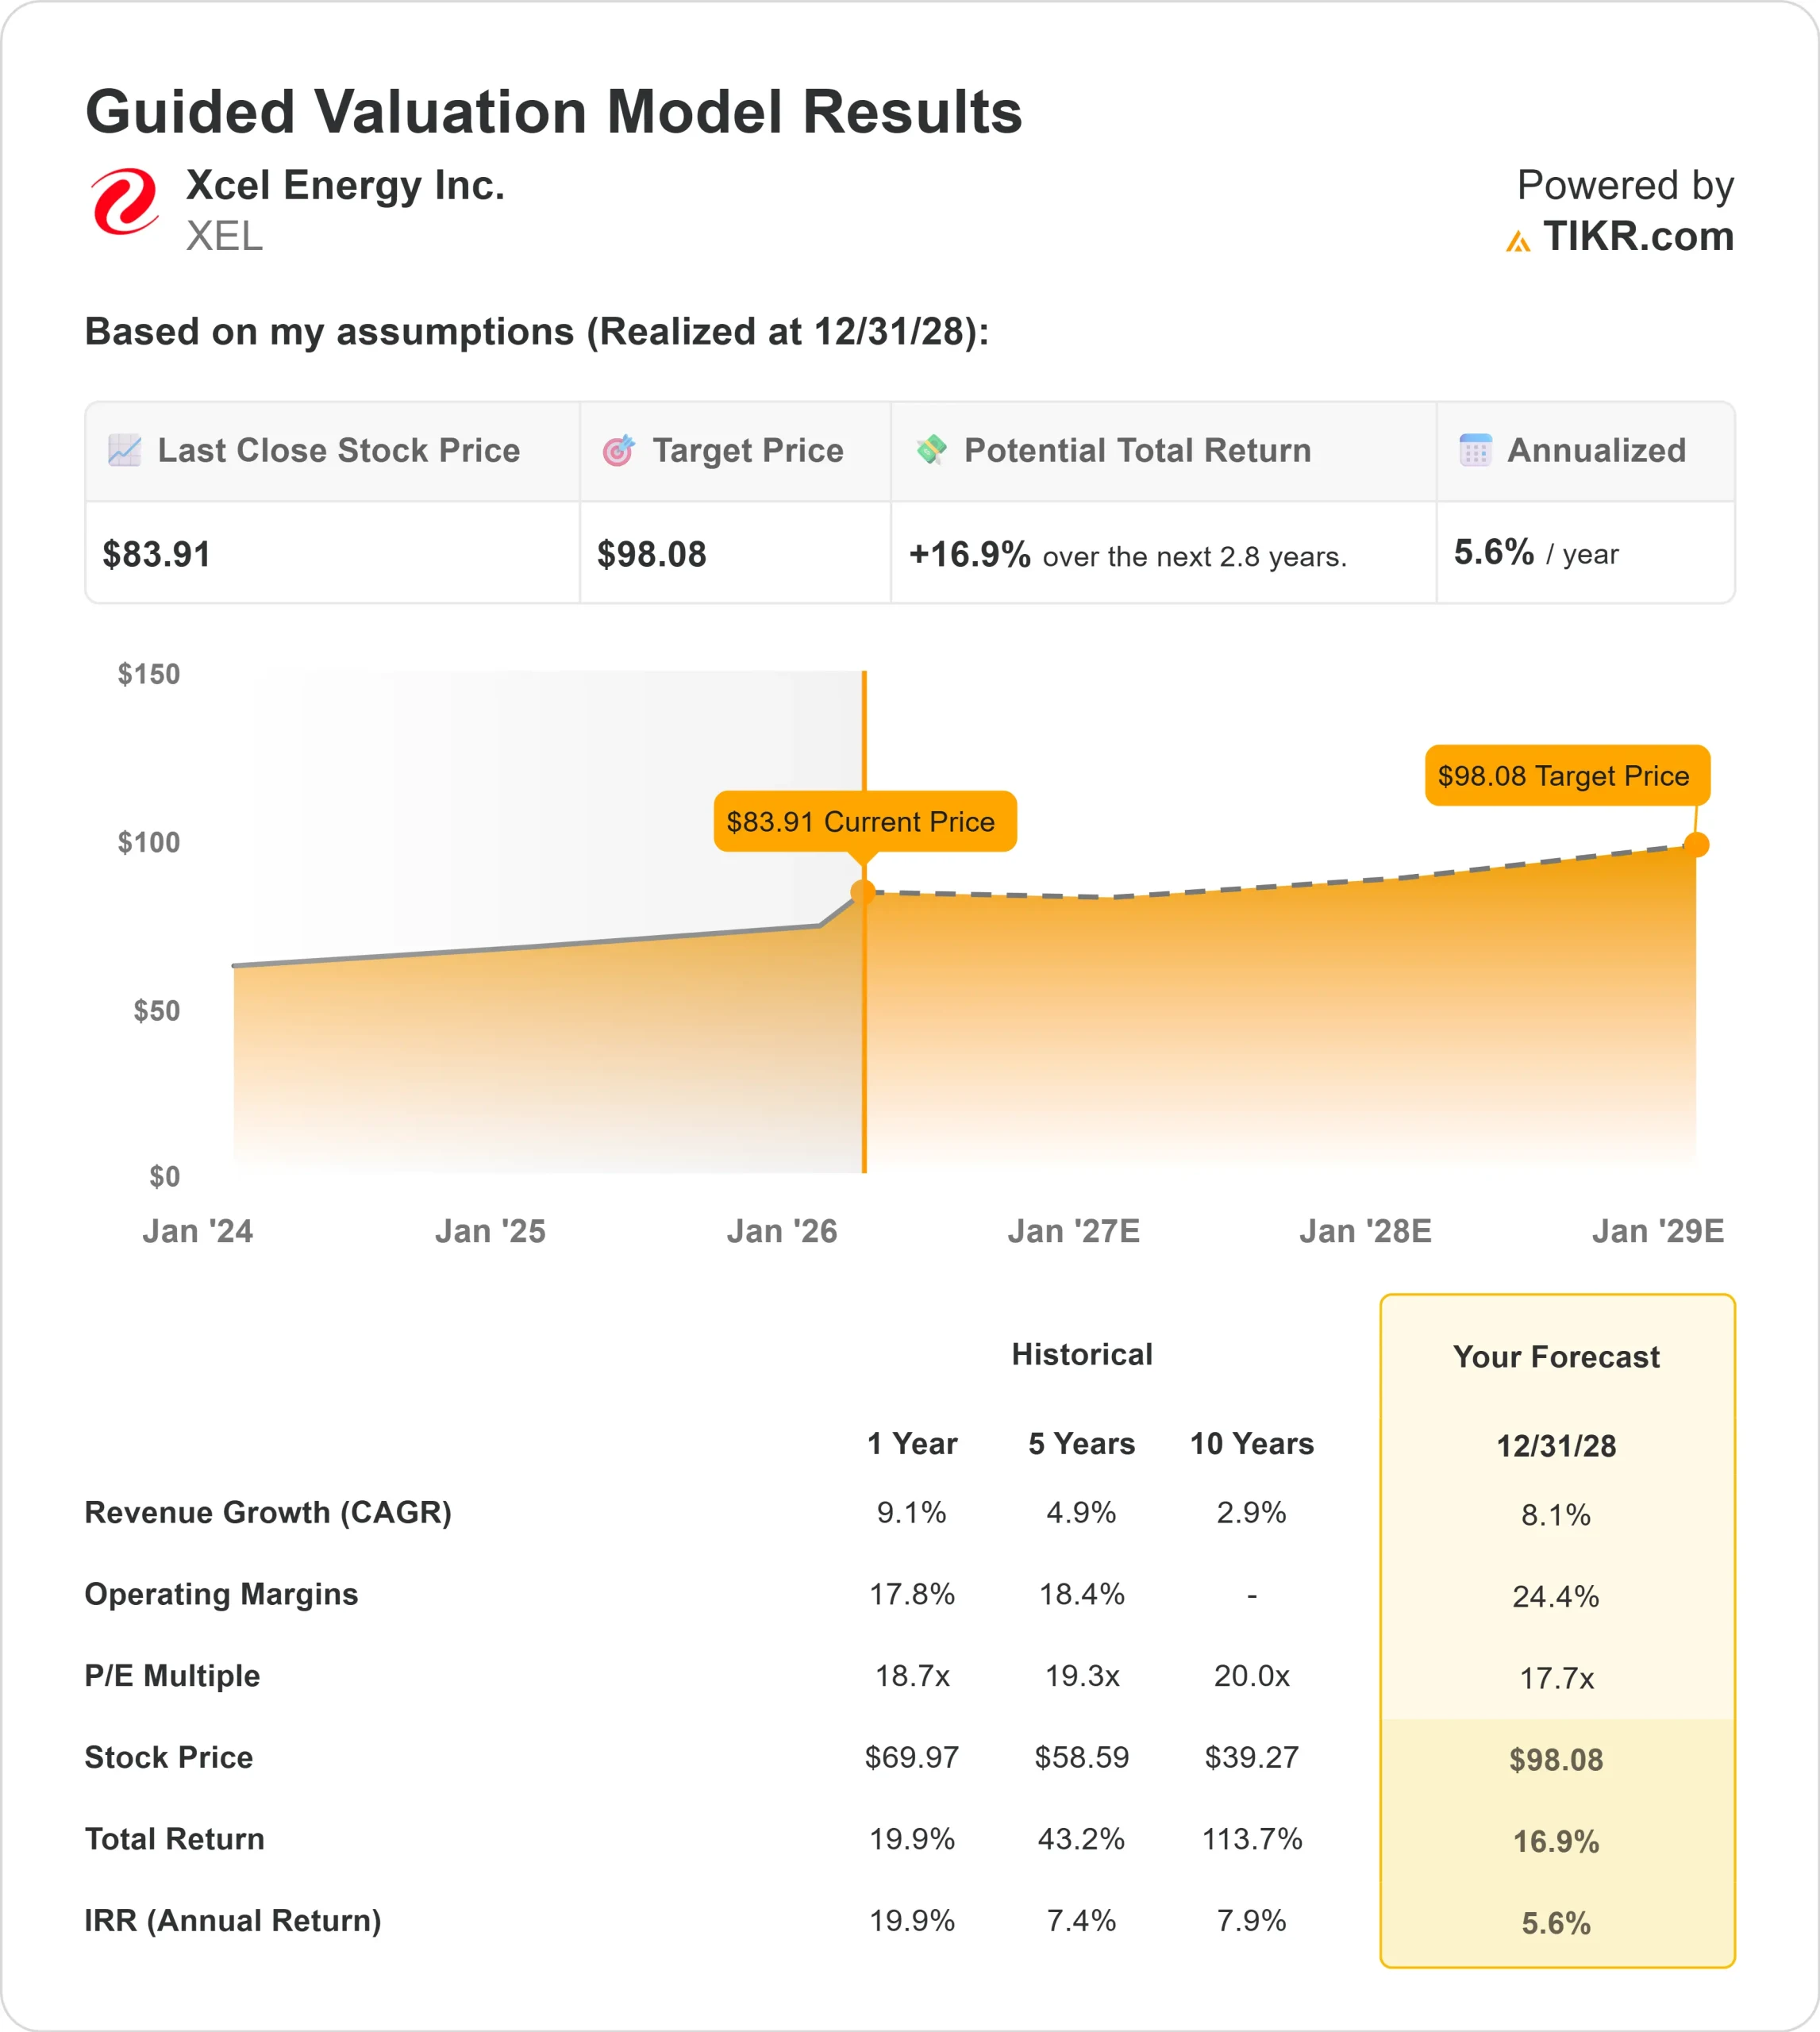
- Valuation Model Target Price: $98
- Implied Upside: 17%
Value your favorite stocks like Xcel Energy with 5 years of analysts’ forecasts using TIKR’s new Valuation Model (It’s free) >>>
What Happened?
Xcel Energy stock has risen about 14% over the past six months, recently trading near $84 per share and approaching its 52 week high of $84. The rally reflects growing investor confidence in the company’s expanding data center pipeline, transmission awards, and reaffirmed 2026 earnings outlook.
The stock moved higher after the company delivered stronger earnings visibility and reinforced its long-term growth plan.
This week, Xcel reported 2025 ongoing earnings of $3.80 per share, up from $3.50 in 2024, marking its 21st consecutive year of meeting or exceeding initial guidance while reaffirming 2026 EPS guidance of $4.04 to $4.16.
Management highlighted nearly $12 billion of capital investment in 2025 and plans to invest over $60 billion in the next five years, supported by a $10-plus billion incremental pipeline and a newly awarded 765 kV transmission project in SPP representing about $1.5 billion of additional investment.
CFO Brian Van Abel said the company “remain[s] confident in our ability to deliver 6% to 8-plus percent long-term earnings growth,” reinforcing earnings durability into the next decade.
Data center momentum has become a key driver of the re-rating. Xcel now has over 2 gigawatts of contracted data center capacity and expects to reach 6 gigawatts by the end of 2027, effectively doubling prior expectations.
Management noted that this load growth supports incremental generation buildout and extends capital investment opportunities into the 2030s, improving long-term rate base expansion.
Institutional positioning has also reinforced the advance. Citigroup boosted its stake by 135.3% in Q3, adding 1,160,205 shares to own 2,017,717 shares worth about $162.7 million.
Vanguard increased its position by 2,001,018 shares to 76,725,720 shares, representing about 12.97% of the company valued near $6.19 billion, while JPMorgan Chase raised its stake to 21,026,015 shares worth roughly $1.696 billion. Institutions now own about 78.38% of the stock, signaling sustained long-term accumulation.
See analysts’ growth forecasts and price targets for Xcel Energy (It’s free) >>>
Is Xcel Energy Undervalued?
Under valuation assumptions, the stock is modeled using:
- Revenue Growth (CAGR): 8.1%
- Operating Margins: 24.4%
- Exit P/E Multiple: 17.7x
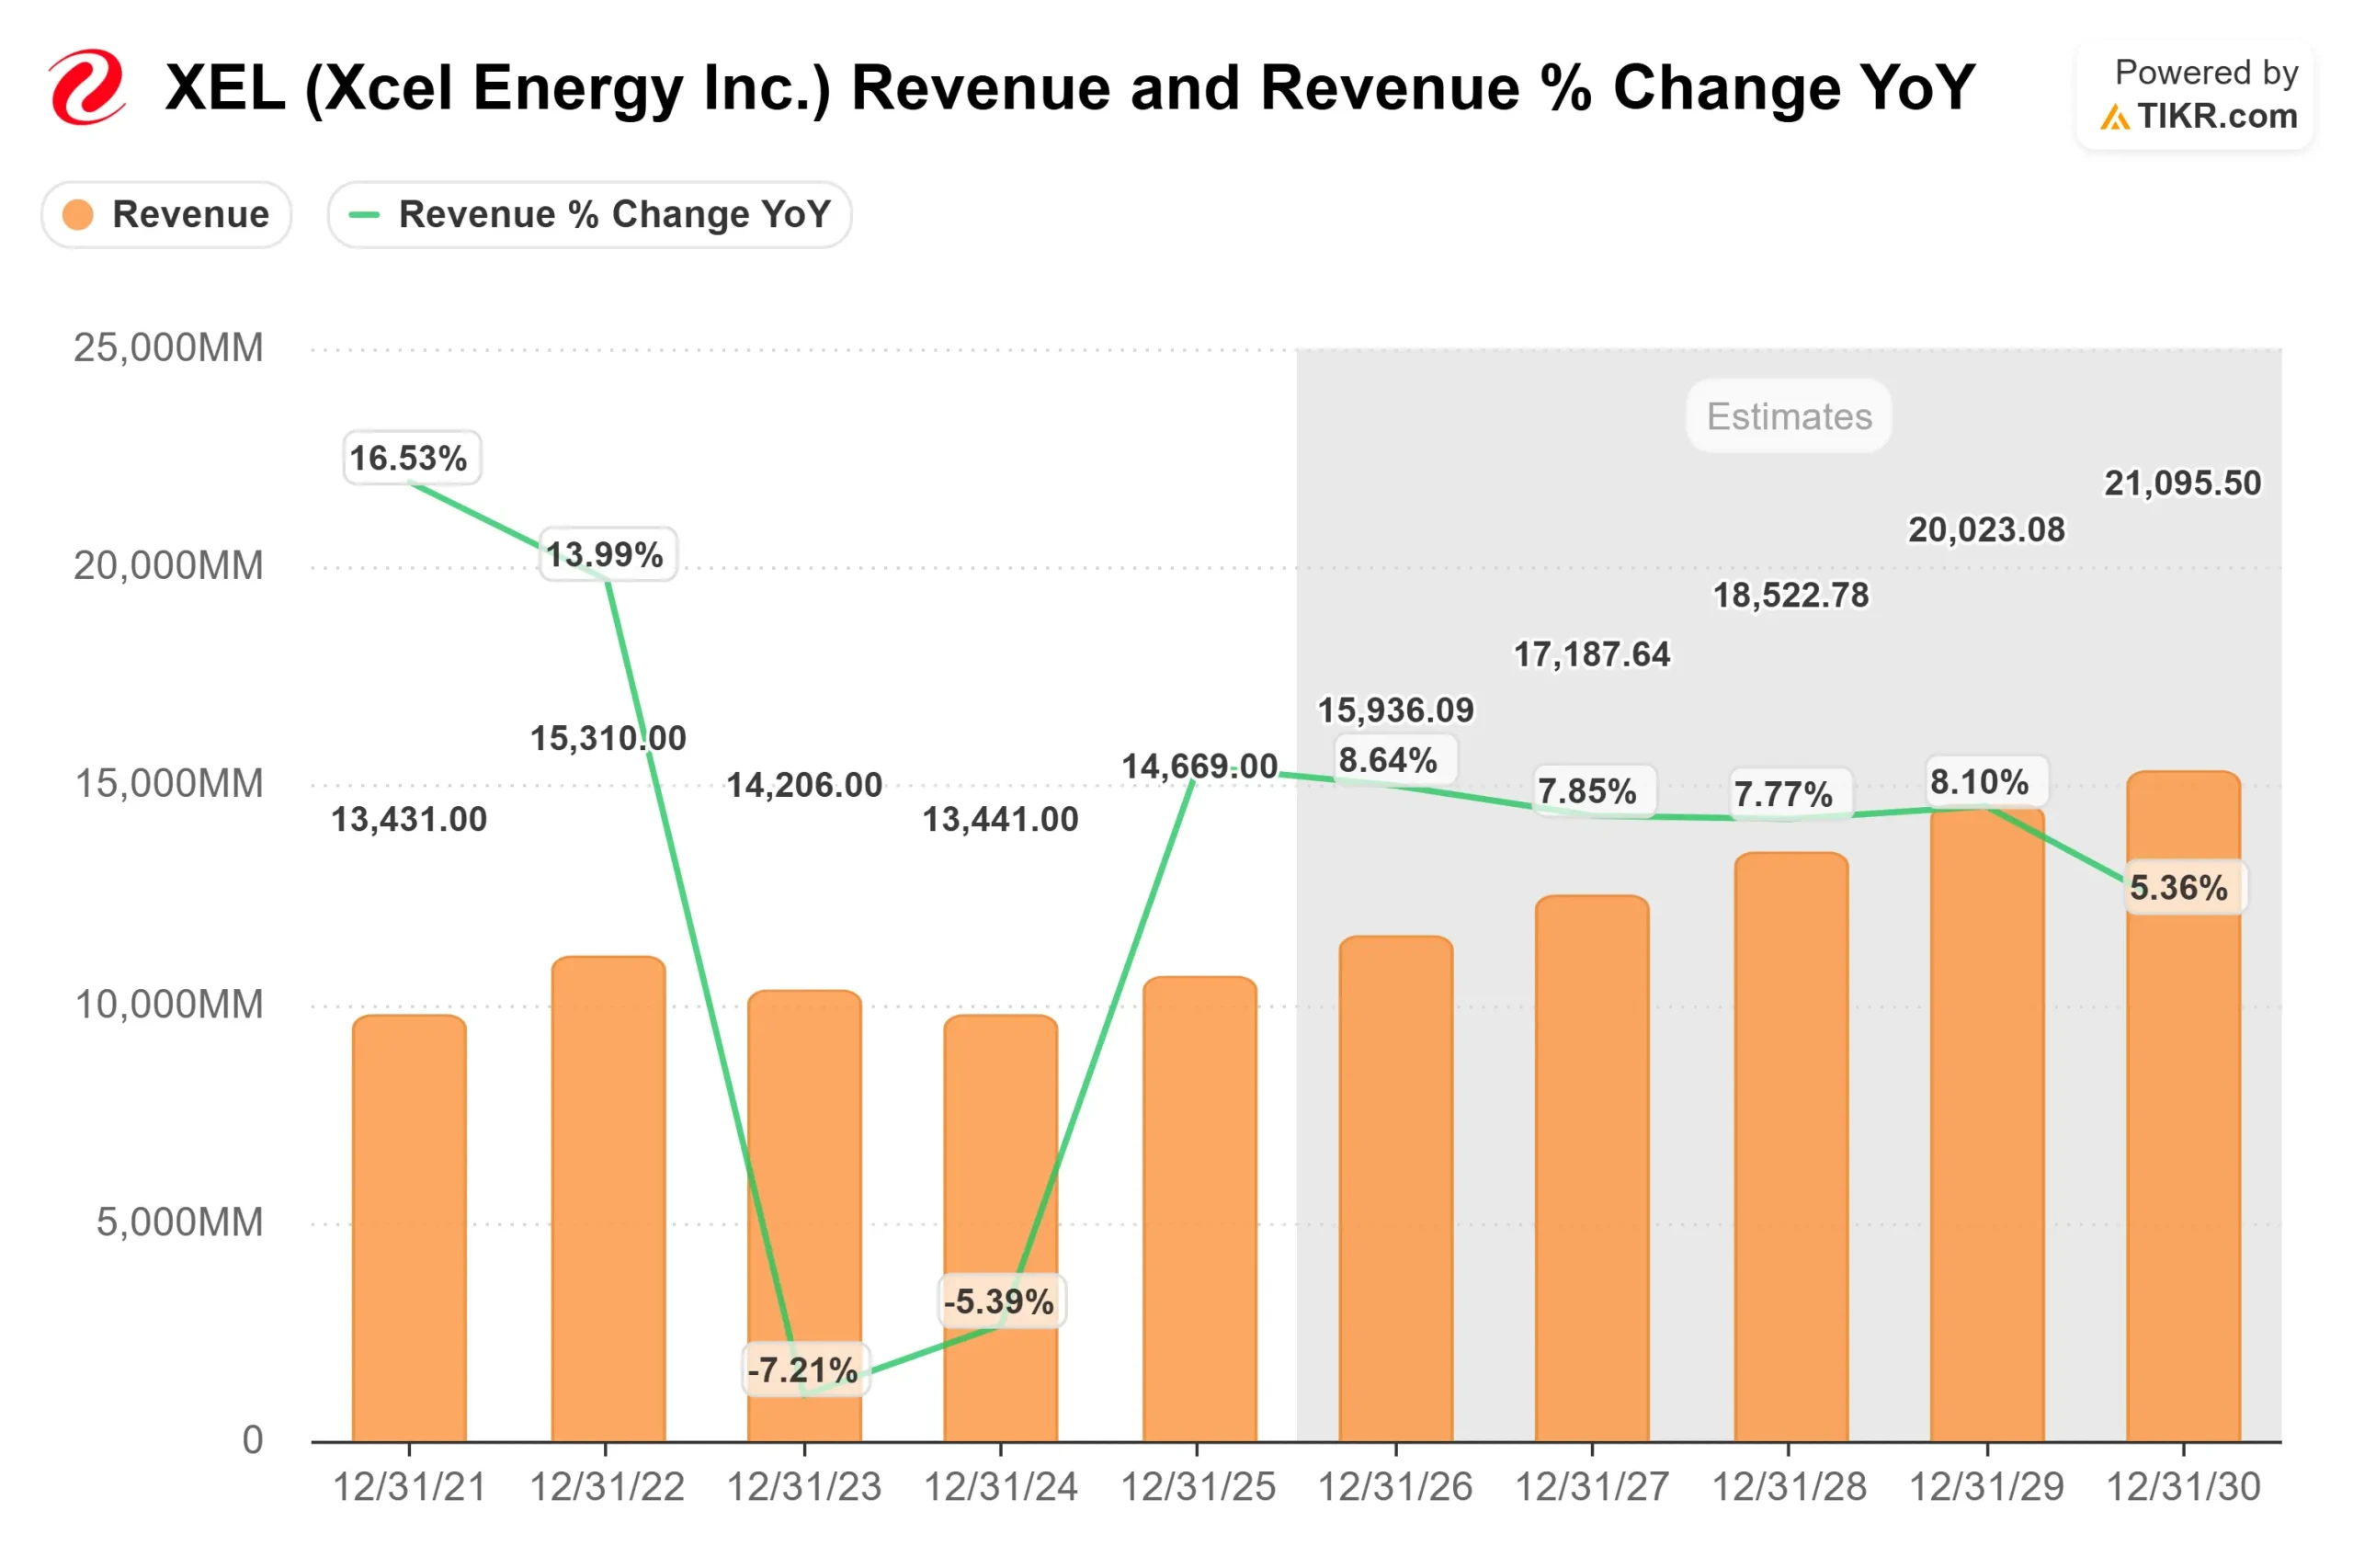
Revenue is projected to increase from about $15.9 billion in 2026 to roughly $21.1 billion by 2030, primarily driven by rate base expansion tied to transmission buildout, renewable integration, and accelerating data center demand.
Margin expansion toward the mid 20% range reflects operating leverage as new regulated assets are placed into service and begin earning approved returns.
Key developments this year include regulatory decisions on pending rate cases in Colorado and New Mexico, execution on recently awarded transmission projects, and additional data center contracting activity.
Constructive rate case outcomes would directly improve allowed returns, while continued load growth from large customers supports multi-year earnings visibility.
Capital deployment discipline and balance sheet stability remain important as the company funds over $60 billion of planned investment.
Based on these inputs, the model estimates a target price of about $98, implying roughly 17% total upside over the next 2 to 3 years.
At current levels near $84, Xcel Energy appears modestly undervalued, with 2026 performance likely driven by regulated rate base growth, transmission expansion, and accelerating large-load demand rather than short-term power price volatility.
Estimate a company’s fair value instantly (Free with TIKR) >>>
Value Any Stock in Under 60 Seconds (It’s Free)
With TIKR’s new Valuation Model tool, you can estimate a stock’s potential share price in under a minute.
All it takes is three simple inputs:
- Revenue Growth
- Operating Margins
- Exit P/E Multiple
From there, TIKR calculates the potential share price and total returns under Bull, Base, and Bear scenarios so you can quickly see whether a stock looks undervalued or overvalued.
If you’re not sure what to enter, TIKR automatically fills in each input using analysts’ consensus estimates, giving you a quick, reliable starting point.
See a stock’s true value in under 60 seconds (Free with TIKR) >>>