
Key Stats for SO Stock
- Past-Month Performance: 10%
- 52-Week Range: $83 to $101
- Valuation Model Target Price: $114
- Implied Upside: 19.2%
Value your favorite stocks like The Southern Company with 5 years of analysts’ forecasts using TIKR’s new Valuation Model (It’s free) >>>
What Happened?
Southern Company stock climbed about 10% over the past month, recently trading near $96 per share as investors reacted to stronger forward earnings guidance and accelerating large load demand visibility into 2026.
The rally followed the company’s fourth quarter earnings release and raised multi-year outlook, which reinforced confidence in earnings durability and capital deployment momentum.
Shares moved higher specifically because management introduced clear EPS growth acceleration for 2026 and beyond.
This week, Southern reported adjusted EPS of $4.30 for 2025, up 6% year over year and at the top of its guidance range for the 11th consecutive year, while retail electricity sales rose 1.7% and commercial sales increased 17% for the second straight year driven by data centers.
Management guided 2026 EPS to $4.50 to $4.60, representing roughly 7% growth, and introduced 2027 and 2028 ranges of $4.85 to $4.95 and $5.25 to $5.45.
CEO Chris Womack called 2025 “an outstanding year for Southern Company,” as the company lifted its long-term EPS growth outlook to 8% to 9% annually through 2028 supported by an $81 billion five-year capital plan and projected 9% rate base growth.
Institutional positioning reflected active reshuffling but continued strong ownership. Ameritas Investment Partners reduced its stake by 97.5%, Empirical Financial Services trimmed 54.5%, Alberta Investment Management cut 60.1%, and Zions Bancorporation lowered its holdings by 45.4%.
At the same time, Advisors Preferred increased its stake by 51.8%, NEOS Investment Management raised holdings by 24.4%, King Luther Capital added 16.1%, Glenview Trust boosted 21.5%, and Cornerstone Advisory lifted exposure by 325.6%, while institutional ownership remains around 64.1% with Norges Bank holding approximately $1.18 billion.
With shares still trading within their $83 to $101 52-week range, the recent advance reflects improving 2026 earnings visibility, durable contracted demand from data centers, and expanding rate base growth rather than short-term speculation.

See analysts’ growth forecasts and price targets for The Southern Company (It’s free) >>>
Is SO Undervalued?
Under valuation assumptions, the stock is modeled using:
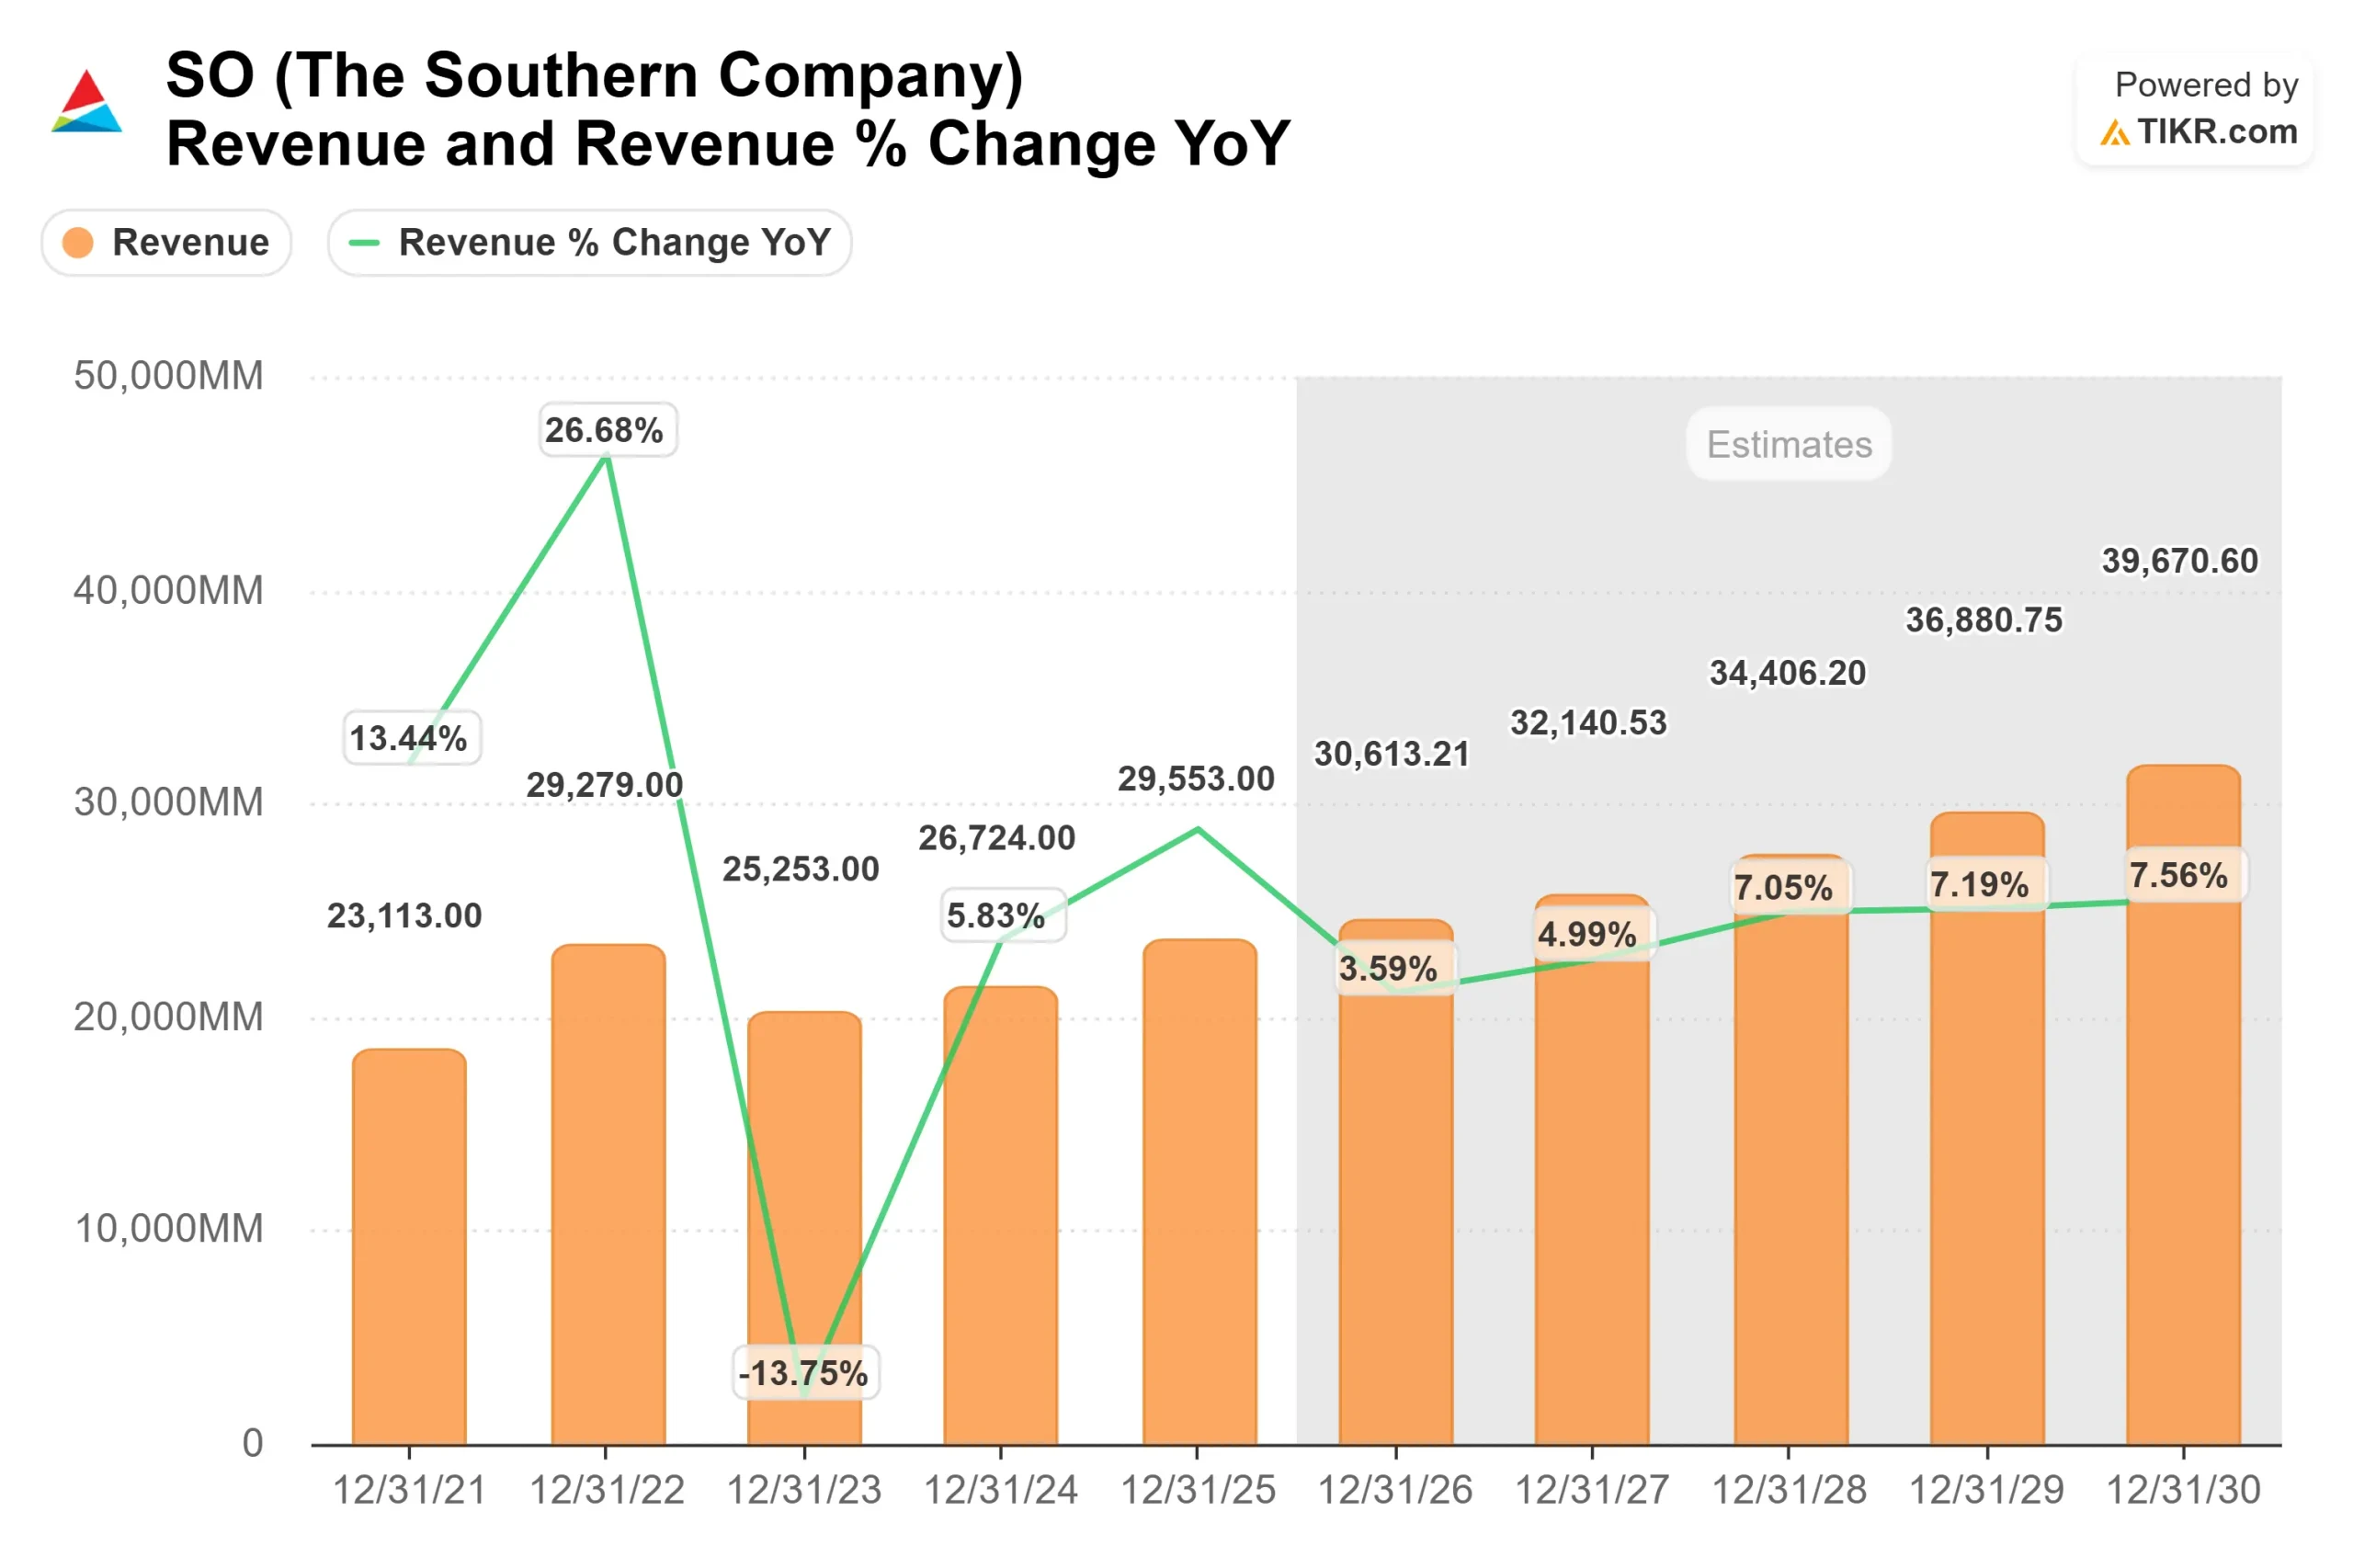
- Revenue Growth (CAGR): 5.2%
- Operating Margins: 29.3%
- Exit P/E Multiple: 19.4x
Revenue growth is supported by regulated rate base expansion across generation, transmission, and grid modernization, alongside accelerating commercial load growth from hyperscale data center customers.
The company now has 26 signed large load contracts totaling 10 gigawatts, with a pipeline exceeding 75 gigawatts, providing multi-year demand visibility that directly feeds into capital deployment and earnings growth.
Margin durability depends on disciplined cost management, constructive regulatory outcomes, and the company’s ability to structure large load contracts with minimum bill provisions that cover incremental costs.
The projected $81 billion five-year capital plan supports approximately 9% average annual rate base growth, which drives regulated earnings expansion rather than relying on commodity price swings.
Based on these assumptions, the valuation model estimates a target price of $114.34, implying about 19.2% total upside from the current $96 share price.
At current levels, Southern Company appears modestly undervalued, with 2026 performance likely driven by rate base growth, data center load ramp execution, regulatory stability, and disciplined capital allocation.
Estimate a company’s fair value instantly (Free with TIKR) >>>
Value Any Stock in Under 60 Seconds (It’s Free)
With TIKR’s new Valuation Model tool, you can estimate a stock’s potential share price in under a minute.
All it takes is three simple inputs:
- Revenue Growth
- Operating Margins
- Exit P/E Multiple
From there, TIKR calculates the potential share price and total returns under Bull, Base, and Bear scenarios so you can quickly see whether a stock looks undervalued or overvalued.
If you’re not sure what to enter, TIKR automatically fills in each input using analysts’ consensus estimates, giving you a quick, reliable starting point.
See a stock’s true value in under 60 seconds (Free with TIKR) >>>