Key Takeaways
- ServiceNow fell 19.6% in premarket trading after adjusted EPS of $1.00 missed the $1.02 consensus and it guided fourth-quarter cRPO growth down to 18.5%.
- Revenue beat, but a stock that had run up about 43% in three months needed a faster backlog.
- Interest costs from borrowing for the Armis deal held EPS growth to 5%, against 20.5% revenue growth.
- Salesforce’s early-December report will show whether the slowdown reaches it, while Microsoft’s Azure grew 48%.
ServiceNow (NOW) sank 19.6% to about $121 in premarket trading Thursday after a third-quarter report that CEO Bill McDermott called “the inflection point for ServiceNow as the Super Intelligence Control Tower.”
Investors looked at the slowing backlog instead, which raises a hard question for Salesforce (CRM). Microsoft (MSFT) showed the same evening where AI budgets are growing fastest.
A Beat With a Catch
The numbers, out after Wednesday’s close:
- Revenue: $4.11 billion, up 20.5%, ahead of the $4.095 billion consensus
- Adjusted EPS: $1.00, against the $1.02 consensus
- cRPO: up 21% in constant currency, guided to 18.5% for the fourth quarter, below the roughly 19.8% analysts expected
Borrowing for the Armis deal lifted interest expense to $81 million from $6 million a year ago. That extra cost works out to roughly 6 cents a share after tax, and it’s one reason EPS rose just 5% while revenue grew 20.5%.
The cRPO guide is the bigger concern, though CFO Gina Mastantuono explained part of it on the Q3 earnings call. Early renewals pulled into the third quarter, more on-premises public sector deals (a 25-basis-point drag) and contracts customers can cancel for convenience (about 50 basis points of backlog growth left out of cRPO) all weigh on the fourth-quarter number. She also said accounting for bundled deployment help is the only reason the full third-quarter beat didn’t flow into the full-year subscription guide, which rose $15 million to $15.785 billion at the midpoint.
Priced for More
ServiceNow had run up about 43% in three months, and its forward P/E went from a five-year low of 20x in April to 33x at Wednesday’s close:
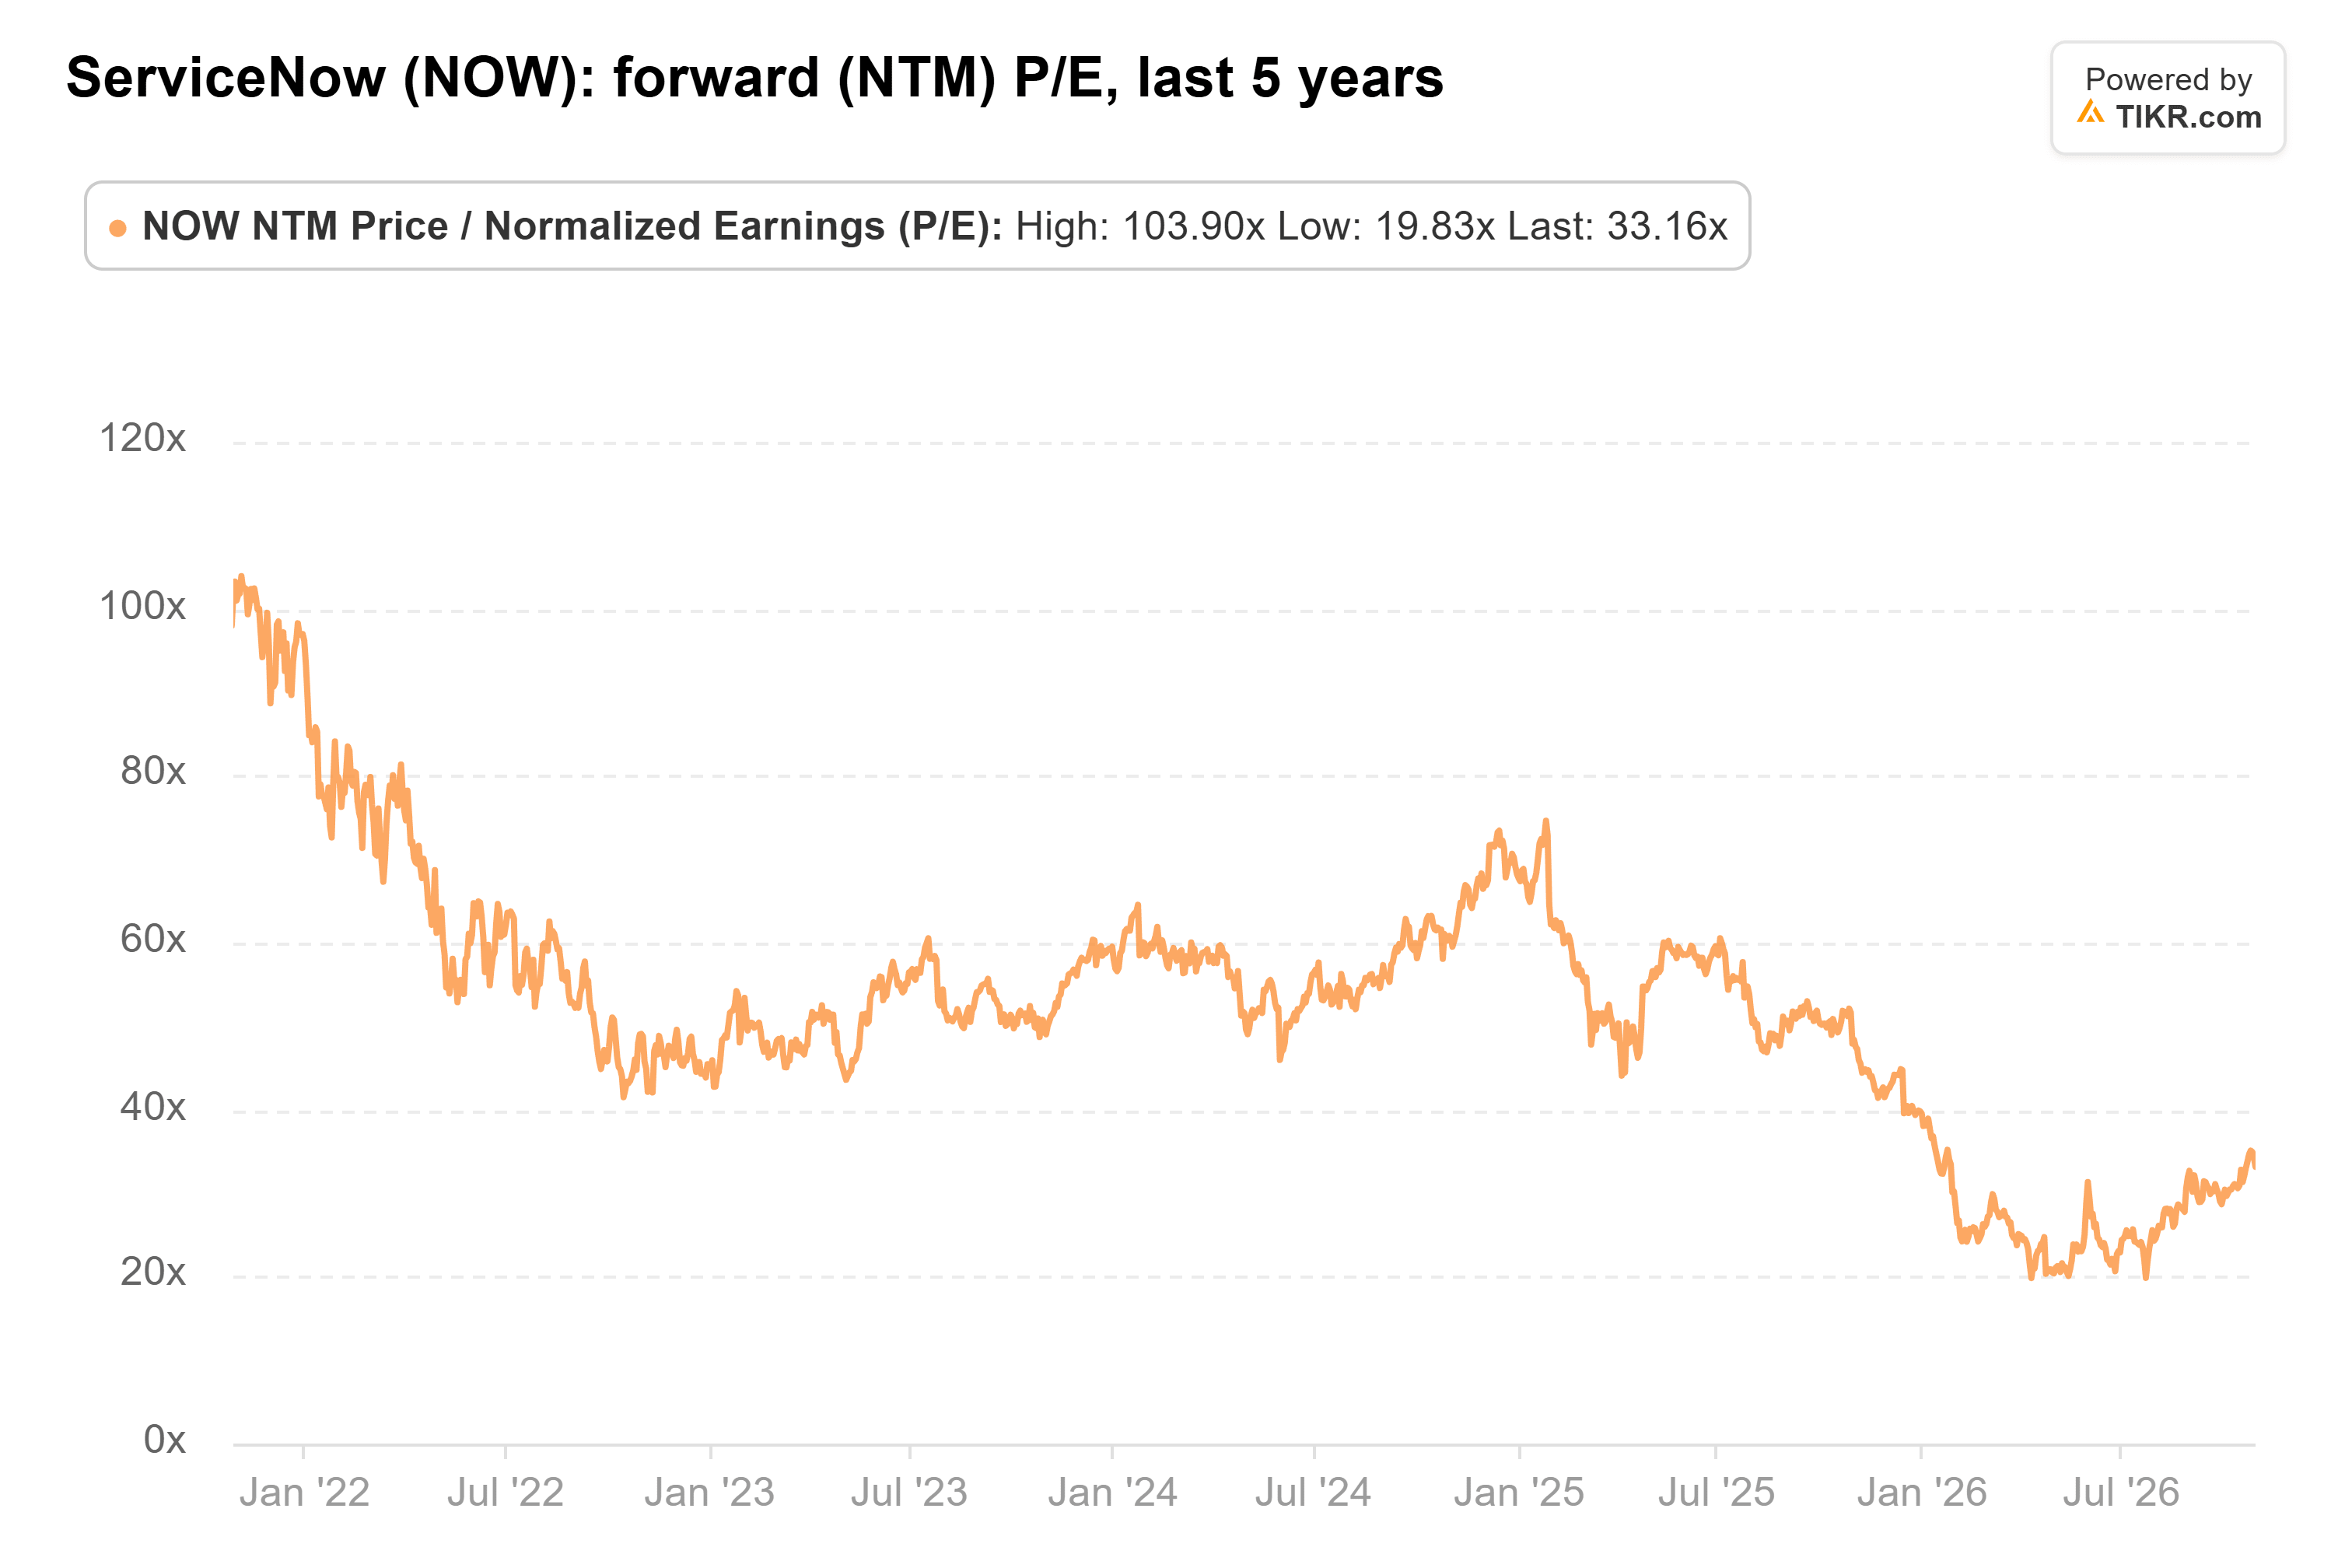
Thursday’s premarket drop takes it to about 27x, well below its 53x five-year average. Analysts expect normalized EPS to keep climbing through 2028, at about 20% a year:

A 2-cent miss is small on its own. The softer backlog guide is the bigger risk to those estimates.
TIKR Tracks 49 Analysts on ServiceNow. How Many Say “Buy”?
See the full breakdown of Buy, Hold, and Sell ratings on ServiceNow, along with Wall Street’s revenue and earnings estimates, all in one place. More than 500,000 investors use TIKR to research stocks like this one. See ServiceNow’s Analyst Ratings
Where the AI Money Is Going
Microsoft’s Azure revenue grew 48% in the quarter to Sept. 30, so big companies are still spending fastest on the infrastructure underneath the apps.
Salesforce, closer to ServiceNow’s spot, grew cRPO 14% in the quarter to July 31. But at 16x forward earnings, half ServiceNow’s at Wednesday’s close, it has far less priced in. If its cRPO holds near 14% in early December, ServiceNow’s slowdown looks like its own.
The January Test for ServiceNow Stock
The next test is the fourth-quarter report in late January: AI contract value against management’s raised $1.7 billion target for 2026, and the first look at 2027 guidance.
This was a solid quarter for a stock priced for a perfect one. At about 27x, against expected earnings growth of about 20% a year, the price asks far less than it did on Wednesday. What it can’t absorb is another step down: if the 2027 guide puts core subscription growth below this year’s roughly 19%, “inflection point” will be a hard sell.
So what is ServiceNow stock actually worth?
TIKR lets you forecast the future price of any stock in less than a minute. Just enter a few assumptions into TIKR’s valuation model and see what ServiceNow could be worth. Start from Wall Street consensus estimates, or adjust the inputs to reflect your own view of the business. It’s free to use.
Disclaimer:
Please note that the articles on TIKR are not intended to serve as investment or financial advice from TIKR or our content team, nor are they recommendations to buy or sell any stocks. We create our content based on TIKR Terminal’s investment data and analysts’ estimates. Our analysis might not include recent company news or important updates. TIKR has no position in any of the stocks mentioned. Thank you for reading, and happy investing!