
Key Stats for Oxy Petroleum
- 52-Week Range: $38.80 – $67.45
- Street Mean Target: ~$67
- Market Cap: ~$60.1B
- NTM P/E: 13.2x
- LTM EBIT Margin: 25.8%
- Q2 2026 Adjusted EPS: $2.40 (vs $1.85 estimate)
- Q2 2026 Revenue: $8.1B (up 52% YoY)
Now Live: Discover how much upside your favorite stocks could have using TIKR’s new Valuation Model (It’s free) >>>
Buffett’s Bet Gets Validated
Occidental Petroleum (OXY) has quietly become one of the more interesting macro-meets-fundamental stories in the energy sector this year. The stock started 2026 in the mid-$40s, then caught a powerful tailwind when the Iran conflict that began in late February drove crude prices sharply higher.
By the end of March, OXY had reached its 52-week high of $67.45, up around 40% from where it started the year. Even after some giveback, shares are still up more than 41% year to date.
Warren Buffett’s Berkshire Hathaway owns roughly 27% of the company’s common shares and holds warrants to buy more, a stake that has grown steadily over three years and which many investors treat as a structural floor under the stock.
The Q2 report underscored why Berkshire has been adding. Adjusted EPS came in at $2.40 against a $1.85 consensus estimate, a beat of nearly 30%. Revenue hit $8.1 billion, up 52% year over year. Production averaged 1.43 million BOE per day, beating the high end of guidance.
Realized crude prices averaged $96.78 per barrel. Management raised its full-year production guidance, raised the dividend by 8%, and retired $1.9 billion of debt in the quarter alone, bringing total debt to $11.8 billion, the lowest since mid-2019.
CEO Richard Jackson said on the call: “Our second-quarter results demonstrate the strength of Oxy’s resources and the competitive advantages that position us for continued value creation.”
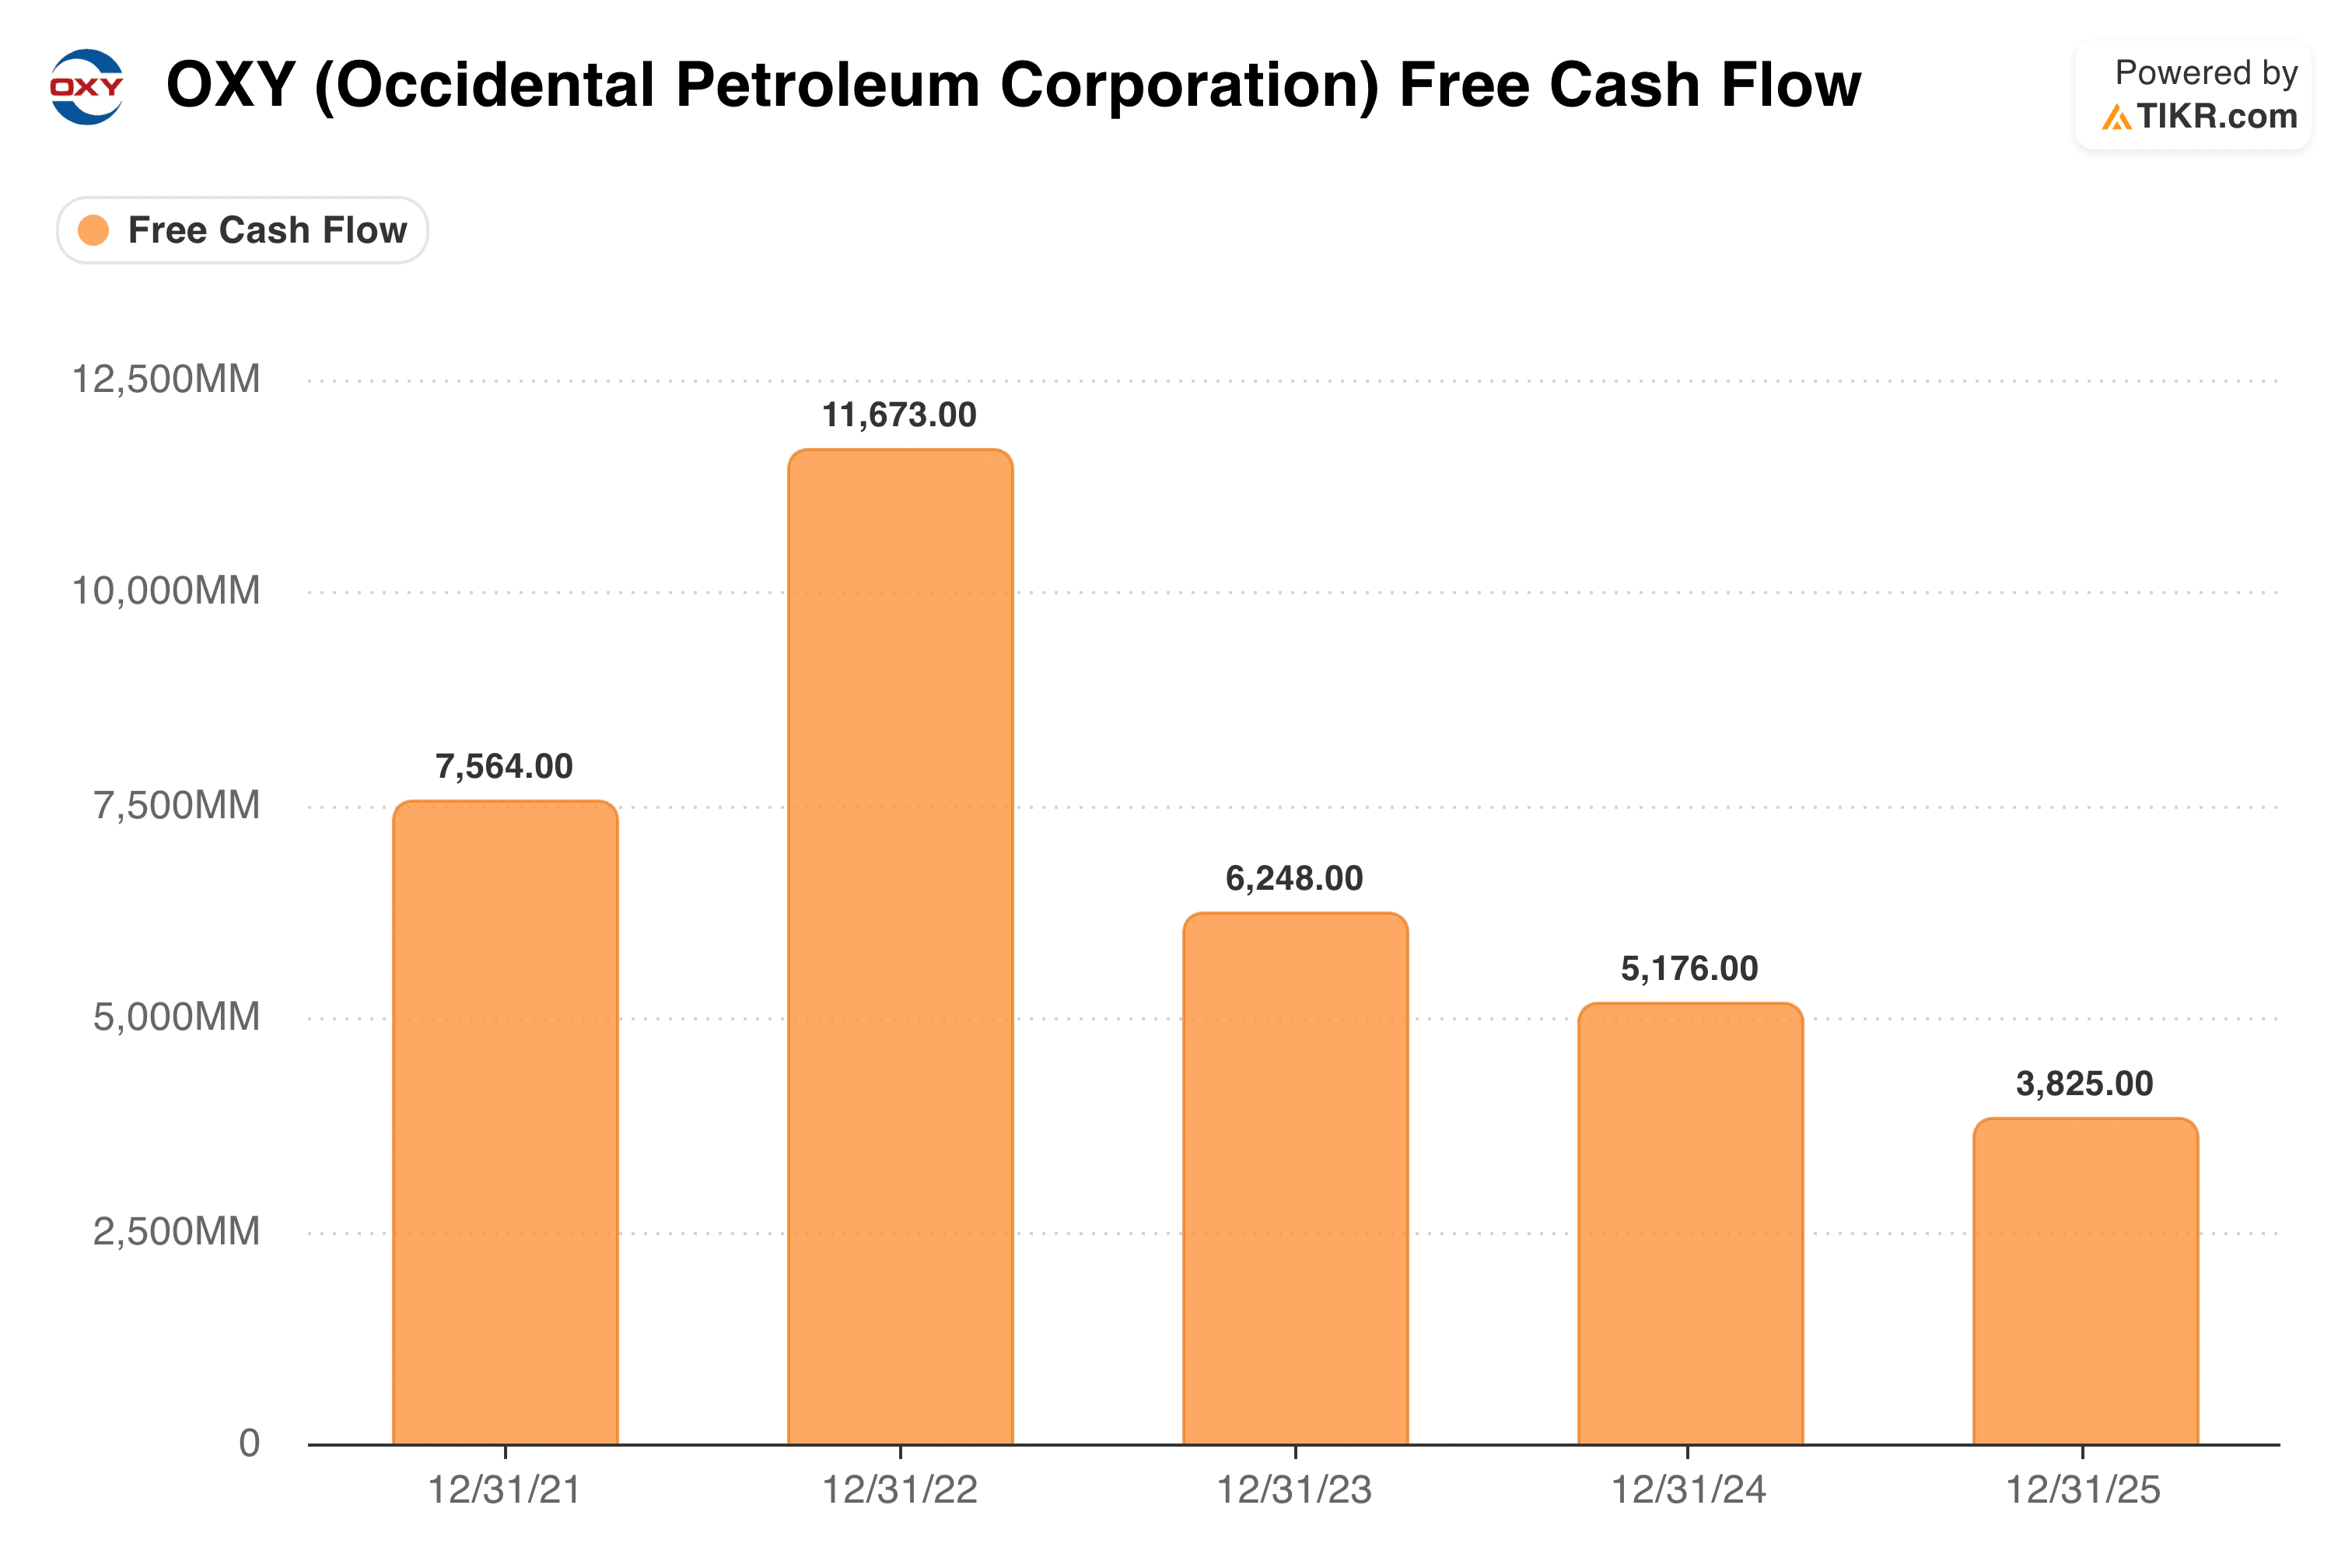
Free cash flow peaked at $11.7 billion in FY2022 when oil prices surged, then declined to $6.2 billion in 2023, $5.2 billion in 2024, and $3.8 billion in 2025 as prices normalized and CrownRock integration costs weighed.
The Q2 2026 quarter alone generated approximately $3 billion in FCF, the best quarterly figure since Q3 2022, signaling that the cycle may be turning.
See historical and forward estimates for Occidental stock (It’s free!) >>>
The Earnings Cycle in Plain Numbers
Oil and gas companies are, by definition, cyclically driven businesses, and OXY’s EPS history makes that fact impossible to miss.
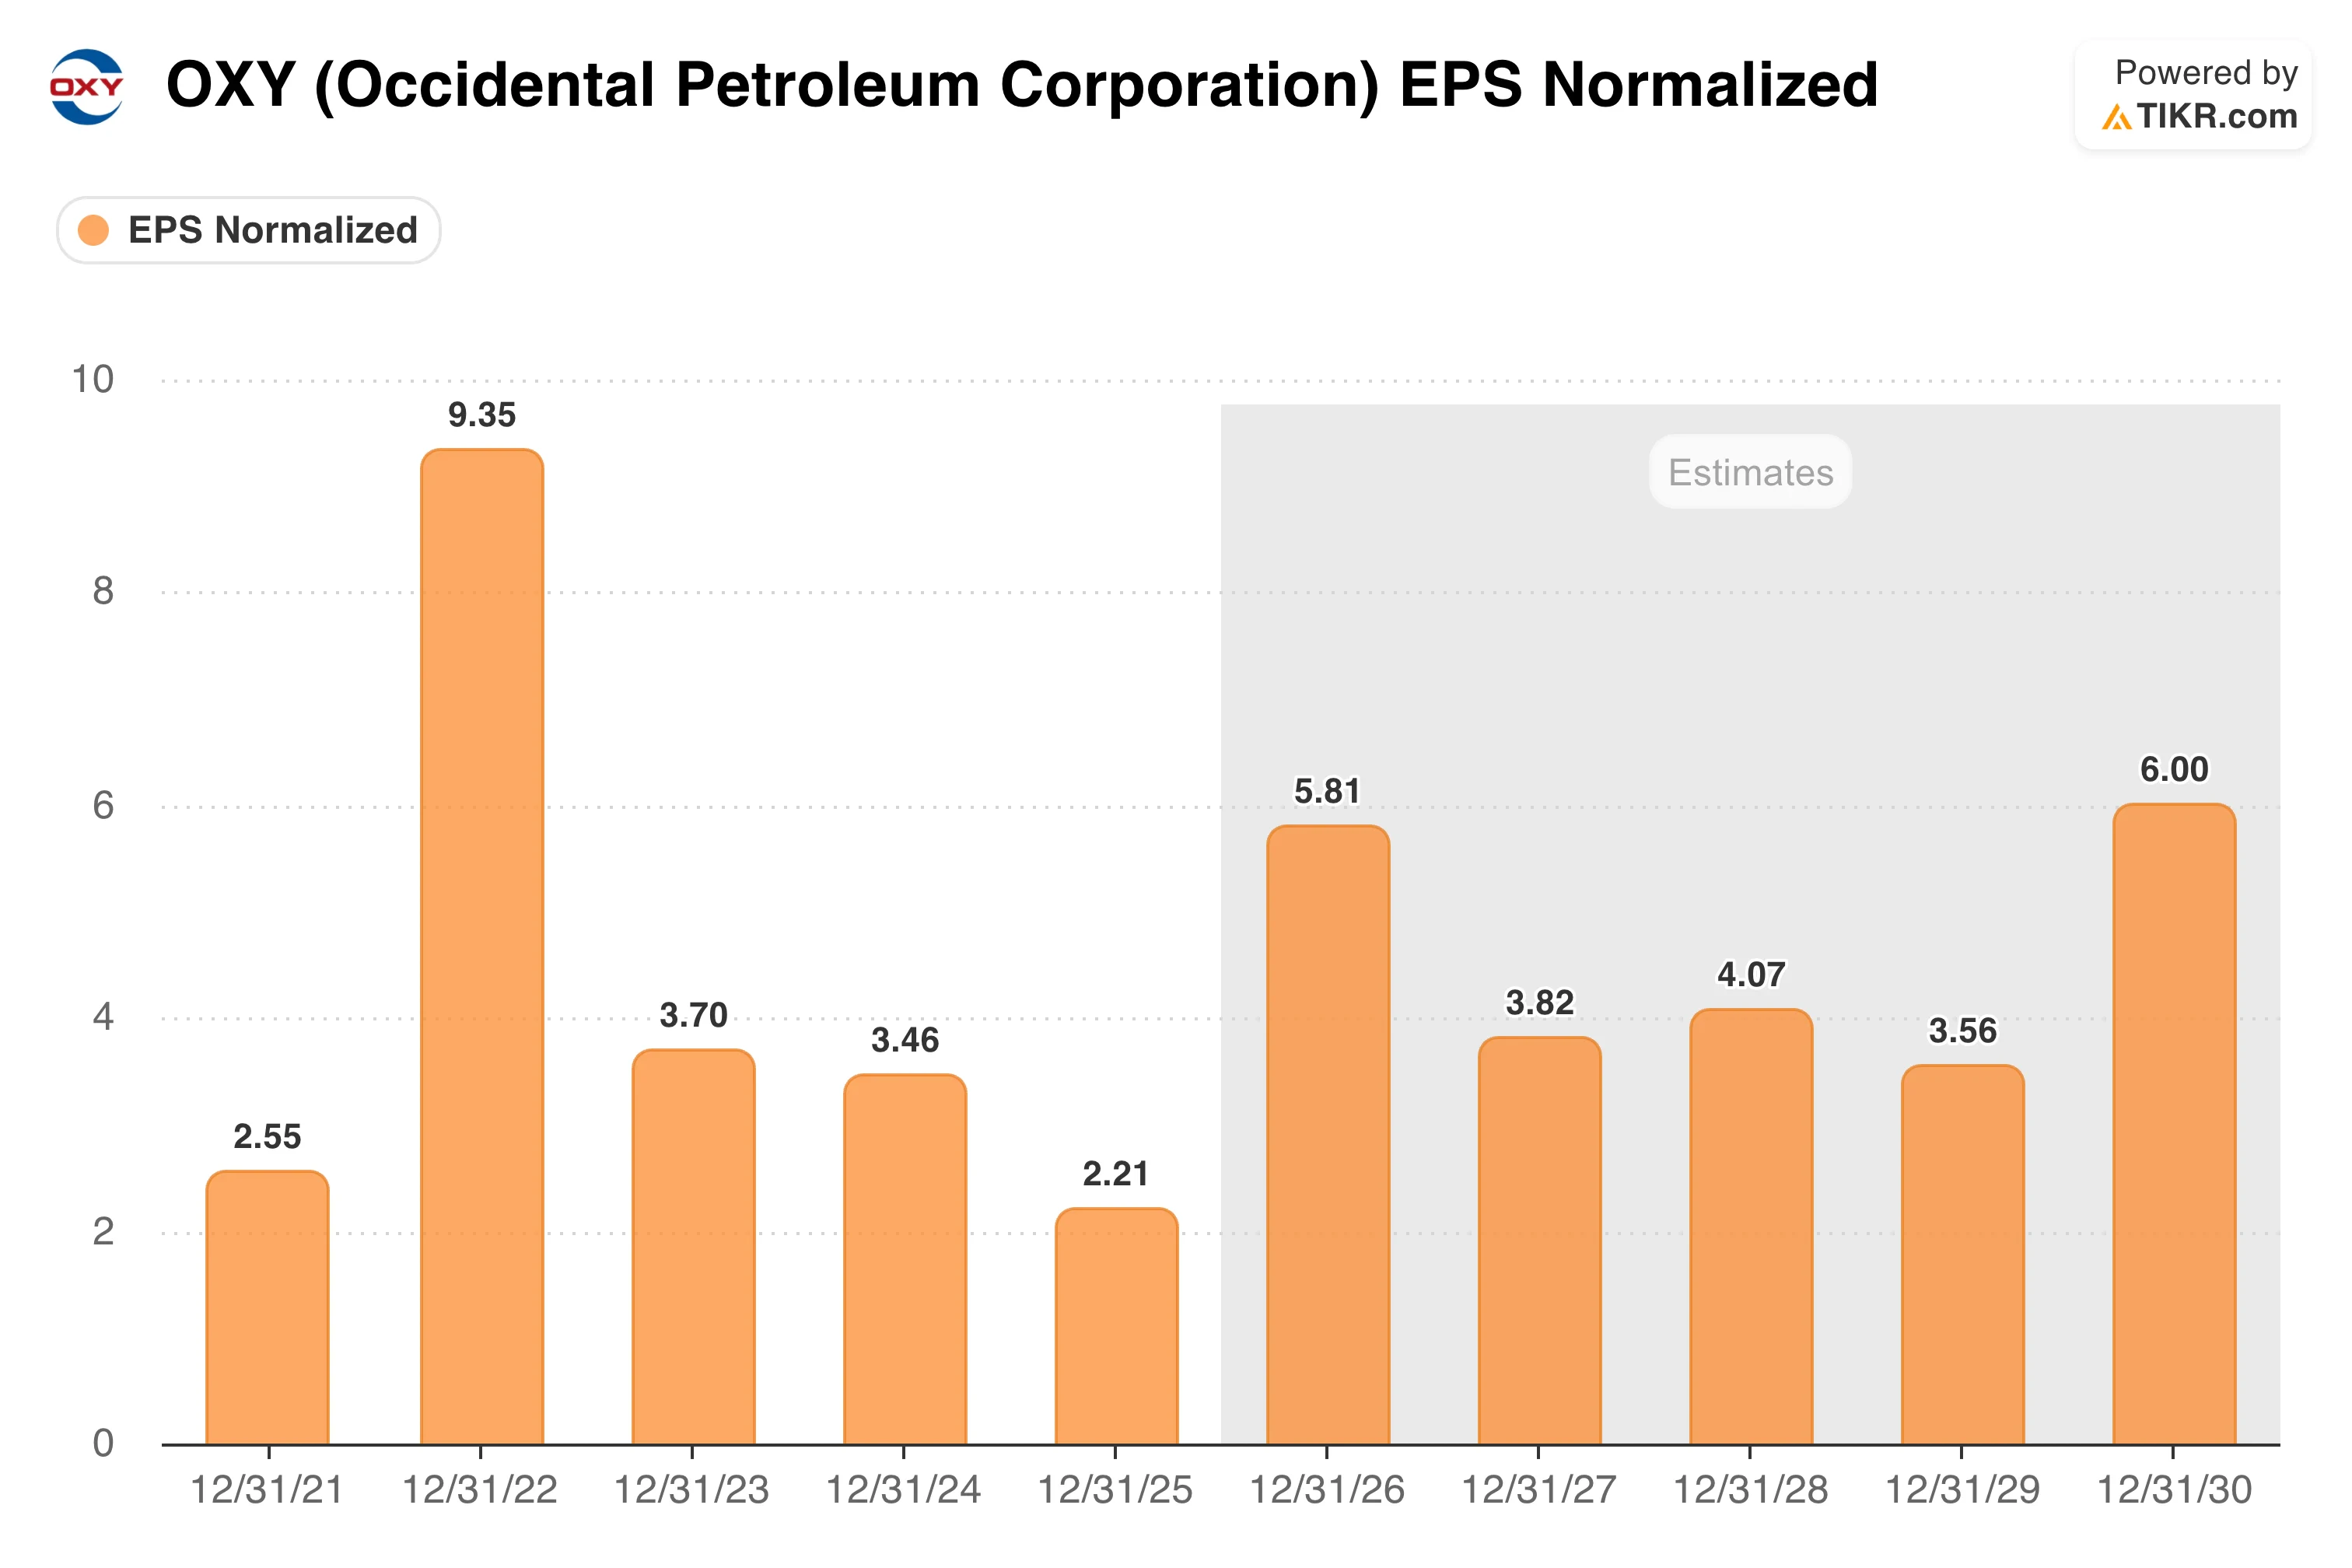
The EPS chart shows exactly how much the commodity environment matters: $2.55 per share in FY2021, $9.35 in FY2022 when oil was elevated, then a gradual decline to $3.70 in FY2023, $3.46 in FY2024, and just $2.21 in FY2025 as oil prices retreated toward the $60–$65 range.
The current environment has reversed that trend sharply. Consensus estimates project full-year 2026 EPS near $5.81, more than double 2025, reflecting the impact of higher realized prices and stronger production.
The Iran conflict has supported crude prices meaningfully above prior-year levels, and OXY’s realized price of nearly $97 per barrel in Q2 was well above what most analysts had modeled.
Beneath the commodity noise is a genuinely improving operational story. Occidental operates with 84% of its resource base breaking even below $50 per barrel, generating positive economics across a wide range of price environments. The company has realized $2 billion in cumulative cost savings since 2023, with $500 million more targeted in 2026.
Jackson has laid out a plan to lift annual sustainable cash flow by 95% by the end of the decade through production growth, cost discipline, and the maturation of the carbon capture business.
See how Occidental performs against its peers in TIKR (It’s free!) >>>
What Wall Street Thinks About OXY Stock
Despite the strong Q2 results and Berkshire’s backing, the Street is not uniformly enthusiastic. The mean analyst target sits at around $67, implying roughly 13% upside from current levels.
With 15 Hold ratings among 23 analysts, the consensus is more measured than a straight EPS beat might suggest.
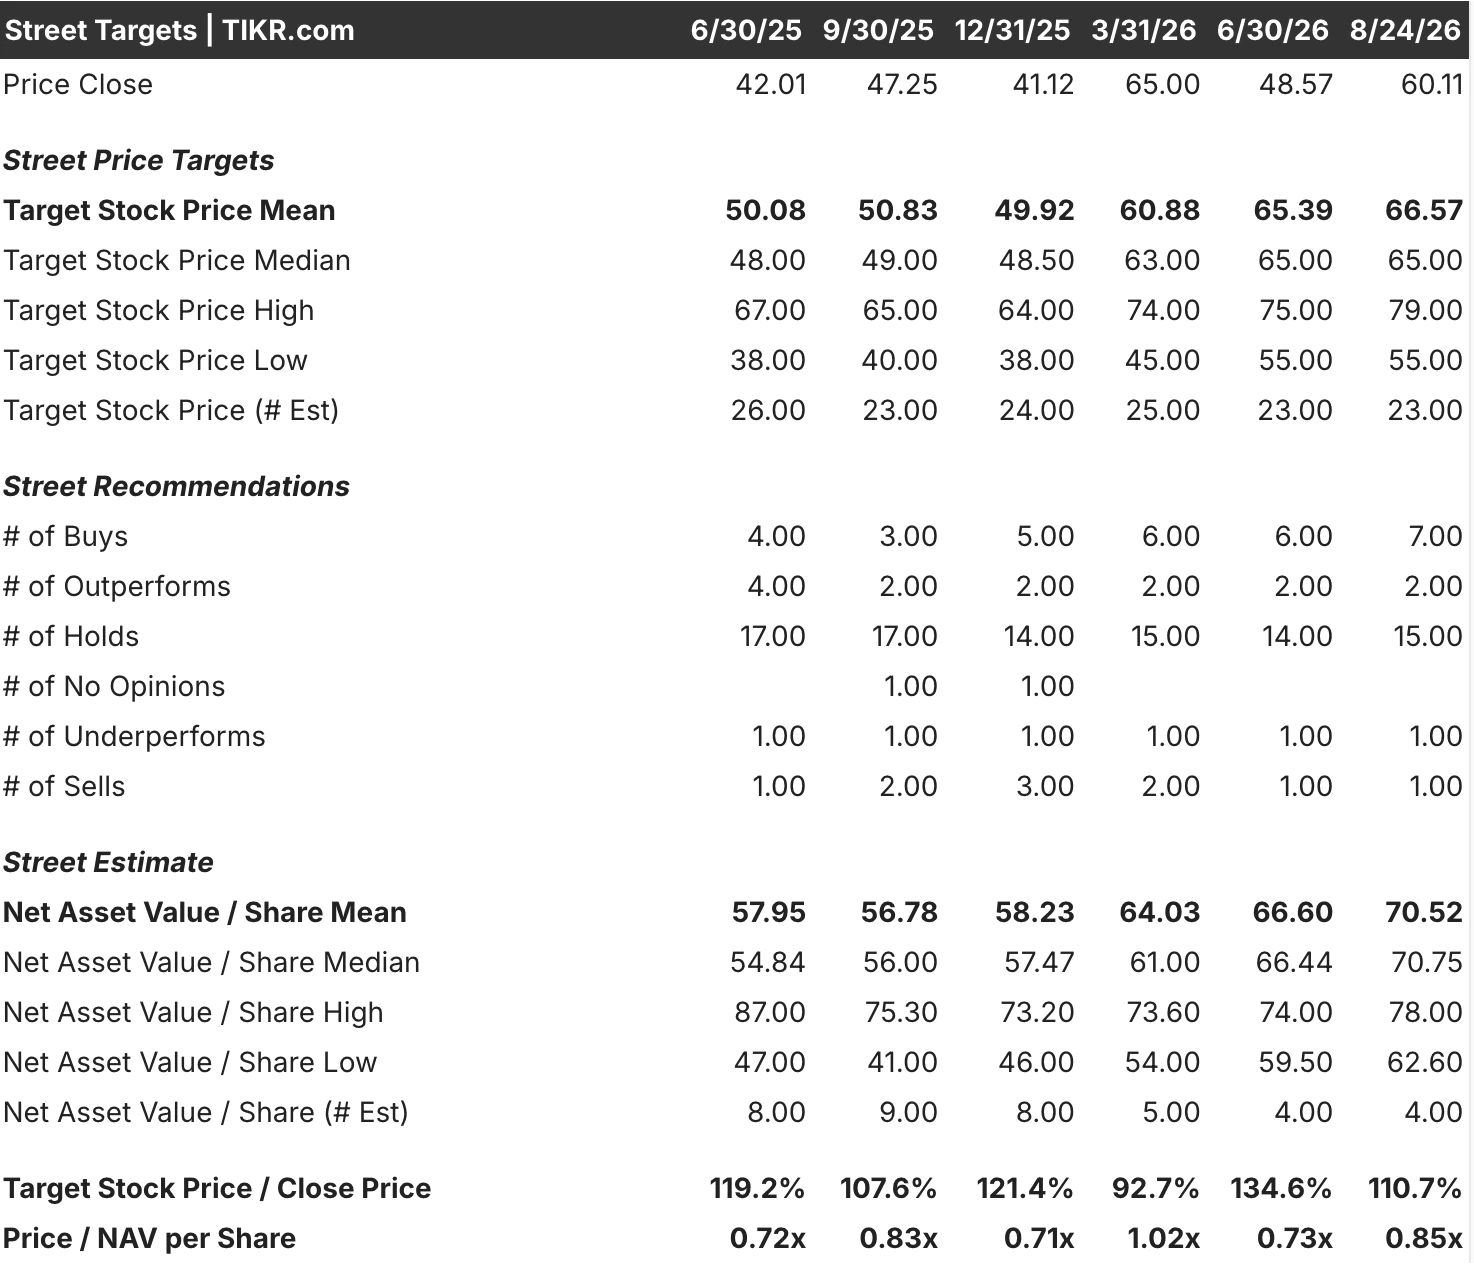
One notable data point from the Street Targets table: consensus NAV per share sits at roughly $71, while the stock trades at around $59, a 15-plus percent discount to underlying asset value.
The high target of $79 reflects full CrownRock synergy realization and elevated oil prices. The low target of $55 prices in a return toward the $65–$70 WTI range.
Should You Buy Occidental Petroleum Stock?
OXY is a clean expression of the oil price bull thesis, backed by one of the world’s most respected capital allocators and run by a management team that has demonstrated operational discipline over several cycles. At 13 times forward earnings with a 1.9% dividend and debt falling fast, the setup is more attractive than the Hold consensus implies on the surface.
The risks are the same ones that define every energy investment. Oil price is the dominant variable and it is outside management’s control. A return to $65 WTI crude, well within the range of plausible outcomes, would push 2027 EPS estimates closer to $3.82, which implies a much higher P/E at current prices. The CrownRock integration, while progressing well, added meaningful debt that took years to work down.
The carbon capture business, while strategically interesting and supported by 45Q tax credits of $180 per ton of CO2, is still years away from generating meaningful earnings. OXY is a quality operator in a cyclical industry, and it deserves to be evaluated as such.
Investors who believe oil prices will stay supported will find the current valuation compelling. Those who are uncertain about the commodity outlook should size their position accordingly.
See analysts’ growth forecasts and price targets for Occidental stock (It’s free!) >>>
Looking for New Opportunities?
- See which stocks billionaire investors are buying to follow the smart money.
- Analyze stocks in as little as 5 minutes with TIKR’s all-in-one, easy-to-use platform.
- The more rocks you overturn… the more opportunities you’ll uncover. Search 100K+ global stocks, global top investor holdings, and more with TIKR.
Disclaimer:
Please note that the articles on TIKR are not intended to serve as investment or financial advice from TIKR or our content team, nor are they recommendations to buy or sell any stocks. We create our content based on TIKR Terminal’s investment data and analysts’ estimates. Our analysis might not include recent company news or important updates. TIKR has no position in any of the stocks mentioned. Thank you for reading, and happy investing!