


Key Stats for Carnival Stock
- Current Price: $25.71
- Target Price (Mid): ~$48
- Street Target: ~$35
- Potential Total Return: ~86%
- Annualized IRR: ~16% / year
Now Live: Discover how much upside your favorite stocks could have using TIKR’s new Valuation Model (It’s free) >>>
What Happened?
Carnival Corporation (CCL) has given back about 13% since its early-August high near $29.67, closing at $25.71 on August 24 after a jump in oil prices dragged the whole cruise sector lower. Fuel is one of an operator’s highest costs, so crude spikes hit these stocks first. That is most of what happened, and none of it started inside Carnival.
Shares have settled around $25.71, holding the $24 to $26.64 band that buyers have defended repeatedly this year, with the intraday low near $25.37 marking the deepest point, according to price-history work from Trefis. So a leveraged, fuel-sensitive stock is back on a level it has held all year, with a Q3 report due in late September.
Management Chose Price Over Occupancy, and That Is the Real Tell
The bear read on Carnival is that its June yield-guidance cut, to about 1.75% growth from 2.75%, signals softening demand. Faced with weaker close-in bookings on Mediterranean sailings, management chose to protect pricing rather than fill cabins. CEO Josh Weinstein said the company “deliberately utilize[d] much of that occupancy advantage to prioritize price integrity,” taking European occupancy “down a couple of points” on purpose.
A company discounting to move inventory is a value trap. A company holding price and accepting slightly emptier ships is protecting the number that compounds, and Carnival entered Q3 booked ahead of last year at record prices, with 93% of 2026 already sold. The near-term cost is real: fewer guests on board means less onboard spending.

See historical and forward estimates for Carnival stock (It’s free!) >>>
A Discount Priced for a Balance Sheet That Is Fading
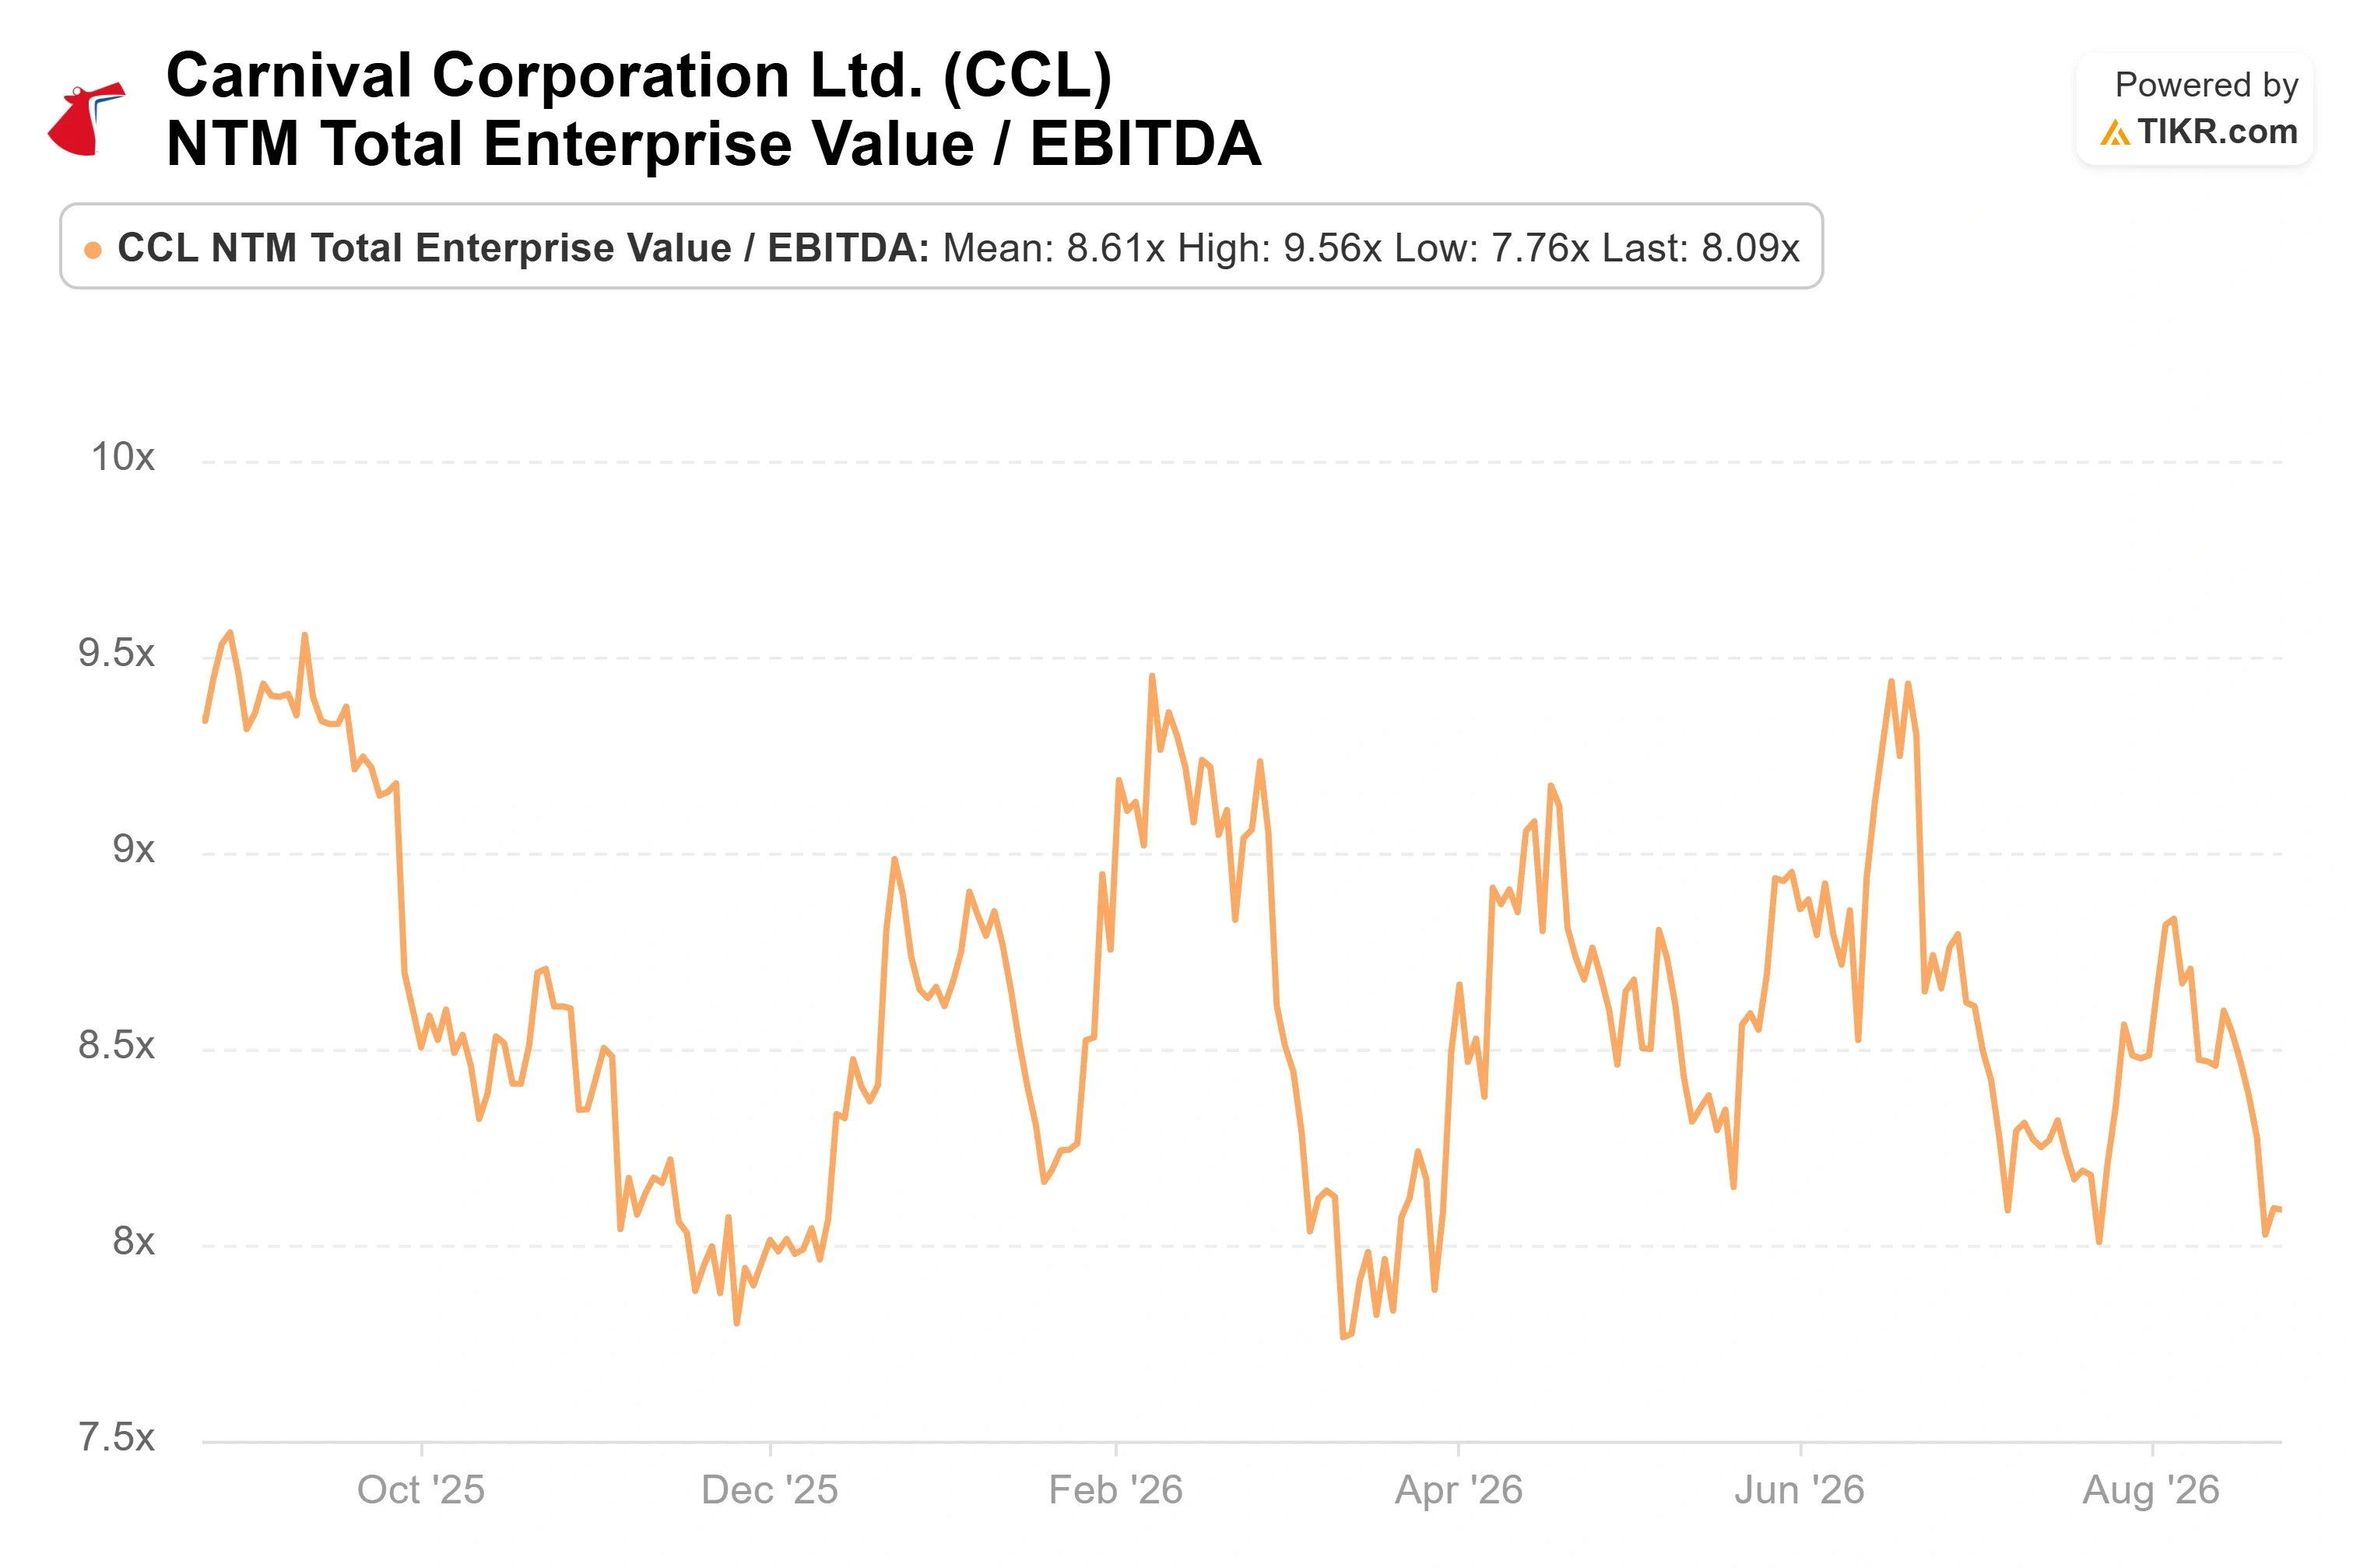
At $25.71, Carnival trades at 8.09x NTM EV/EBITDA against Royal Caribbean at 12.52x and Norwegian at 9.60x, per TIKR’s Competitors data. Some of that gap is Europe, where the disruption landed. But a chunk of it is muscle memory from the pandemic balance sheet, and that balance sheet is changing: net debt sits near $24 billion with leverage down to 3.1x, and Carnival is now investment grade at both S&P and Fitch, with only Moody’s still holding out. The market is discounting a credit risk that the rating agencies have largely retired.
Carnival runs no fuel hedges, its five-year beta is 2.33, and August showed how fast an oil move erases a quarter of cost discipline and compresses the multiple on top. A sustained crude spike does real damage. The safety headlines that accompanied the selloff, a brief Mississippi River listing incident, and a low CDC inspection score on one ship, reported by AD HOC News, added sentiment noise but nothing structural.
See how Carnival performs against its peers in TIKR (It’s free!) >>>
TIKR Advanced Model Analysis
- Current Price: $25.71
- Target Price (Mid): ~$48
- Potential Total Return: ~86%
- Annualized IRR: ~16% / year

See analysts’ growth forecasts and price targets for Carnival stock (It’s free!) >>>
TIKR’s mid-case values Carnival near $48, roughly 86% upside at about a 16% annualized return, and the case leans directly on the decision above. Revenue driver one is the recovery of the European occupancy that management gave up on purpose, which returns as the geopolitical disruption fades. That is a lever the company controls, not one it has to win. Revenue driver two is durable pricing, supported by a 2027 book already sold at record prices. Together, they carry forward growth close to 4%. The margin driver is falling interest expense as leverage keeps dropping, which pulls the net income margin toward 13%. The primary risk is fuel, which hits costs directly and, as August proved, compresses the multiple on top.
Upside: if the price-integrity bet holds and yields return to mid-single-digit growth, the multiple re-rates toward peers and the stock clears the mid-$30s Street target well ahead of the model’s horizon. Downside: if European softness proves stickier than management claims, yields stay muted, and the stock revisits the low end of its range.
Conclusion
The floor is the whole question, and Q3 is the test. Watch one number when Carnival reports in late September: management guided adjusted EBITDA to about $2.88 billion. Clear it, and the price-over-occupancy bet looks validated, giving the $24 to $26.64 floor a reason to hold and the peer discount a reason to close. Come in light, especially on the yield line, and the same floor is what gets tested next, with a fuel-sensitive, unhedged balance sheet offering little cushion if it gives. The sell-side sits mid-$30s, and the model sits higher still, but neither counts until the yield decision shows up in reported results.
See what stocks billionaire investors are buying so you can follow the smart money with TIKR.
Should You Invest in Carnival?
The only way to really know is to look at the numbers yourself. TIKR gives you free access to the same institutional-quality financial data that professional analysts use to answer exactly that question.
Pull up Carnival, and you’ll see years of historical financials, what Wall Street analysts expect for revenue and earnings in the quarters ahead, how valuation multiples have moved over time, and whether price targets are trending up or down.
You can build a free watchlist to track Carnival alongside every other stock on your radar. No credit card required. Just the data you need to decide for yourself.
Analyze Carnival on TIKR Free →
Looking for New Opportunities?
- See what stocks billionaire investors are buying so you can follow the smart money.
- Analyze stocks in as little as 5 minutes with TIKR’s all-in-one, easy-to-use platform.
- The more rocks you overturn… the more opportunities you’ll uncover. Search 100K+ global stocks, global top investor holdings, and more with TIKR.
Disclaimer:
Please note that the articles on TIKR are not intended to serve as investment or financial advice from TIKR or our content team, nor are they recommendations to buy or sell any stocks. We create our content based on TIKR Terminal’s investment data and analysts’ estimates. Our analysis might not include recent company news or important updates. TIKR has no position in any stocks mentioned. Thank you for reading, and happy investing!


