Key Takeaways for KE Holdings Stock as of August 2026
- Profit Inflection: Non-GAAP net income jumped 74.9% YoY to $3.19B (RMB 3.185B) in Q2, pushing non-GAAP net margin to 13%, up 6 percentage points YoY and a 3-year high.
- GTV Returns to Growth: Total GTV rose 6.3% YoY even as revenue fell 5.7% YoY, a gap driven by home renovation adjustments and net-basis rental revenue recognition.
- Margin Structure Reset: Gross margin expanded 6.7 percentage points YoY to 28.6% while GAAP operating expenses fell 14.1% YoY, driving GAAP operating profit up 185.6% YoY to RMB 3.026B.
- CFO on Resilience: CFO Tao Xu tied the quarter’s profit outperformance directly to a leaner cost base that cuts both ways in volatile markets, telling investors the current structure “increases both upside potential and downside protection.”
KE Holdings stock just posted its strongest profit quarter in three years on a shrinking top line, and the market noticed immediately. See what’s driving that gap on TIKR for free →
BEKE Stock Jumps as Profit Nearly Doubles on a Shrinking Top Line
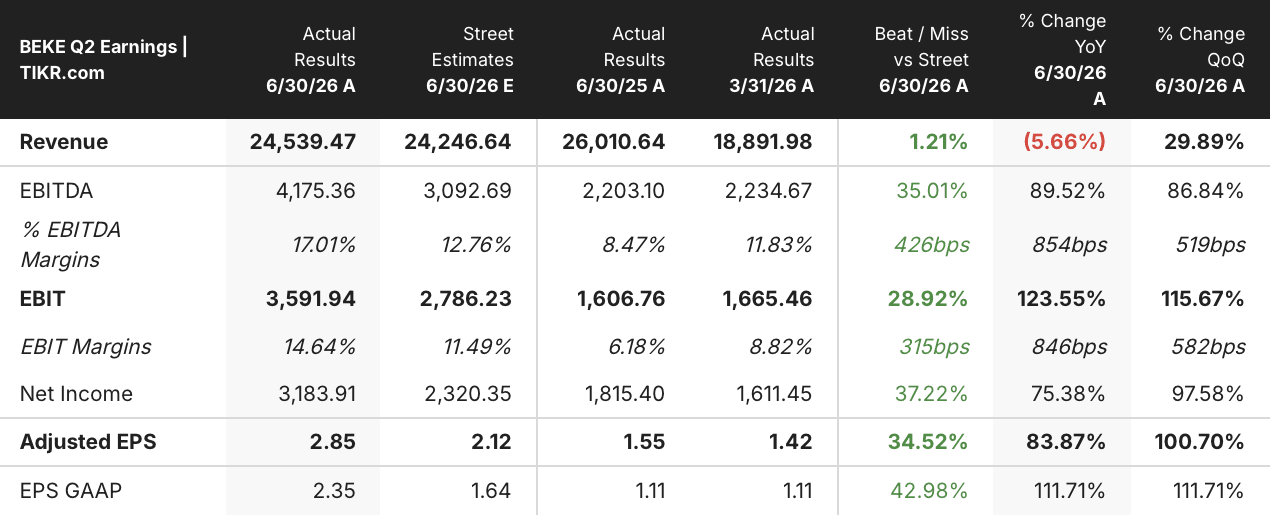
KE Holdings (BEKE) stock climbed 4.47% to close at $17.75 on August 21, 2026, the same day the company reported second-quarter results that turned a revenue decline into the sharpest profit quarter it has posted in three years. Total GTV returned to growth, up 6.3% year over year, while revenue slipped 5.7% year over year on adjustments in the home renovation business and a shift to net-basis revenue recognition in home rental services.
That gap between GTV and revenue is exactly where the story turns. Non-GAAP net income surged 74.9% year over year to RMB 3.185 billion, and non-GAAP net margin reached 13%, up 6 percentage points year over year. Gross margin expanded 6.7 percentage points to 28.6%, and GAAP operating expenses fell 14.1% year over year. Combined, those two moves drove GAAP operating profit up 185.6% year over year to RMB 3.026 billion.
The existing home segment carried the quarter. GTV reached RMB 629.89 billion, up 8% year over year and 17.9% quarter over quarter, while contribution margin rose 6.1 percentage points to 46.1%. Connected store transaction volume grew nearly 30% year over year without any expansion of the store network itself, and average transactions per active connected store climbed 26%. New home GTV jumped 77.1% quarter over quarter to RMB 258.39 billion, with contribution margin up 4.4 percentage points to 28.8%. Home renovation revenue still fell 30.1% year over year, but contribution margin rose 7.5 percentage points to 39.6%, and management called the channel exits behind that decline largely complete.
Addressing why the profit growth so dramatically outpaced the top line, CFO Tao Xu put it directly on the Q2 2026 earnings call: “Simply put our current structure increases both upside potential and downside protection.” That framing lines up with the balance sheet: KE Holdings held roughly RMB 67.3 billion in cash excluding customer deposits, spent about $460 million on buybacks in the first half (up 14% year over year, including its first Hong Kong market repurchase), and has bought back roughly $2.99 billion in shares since September 2022, representing 14.8% of pre-program shares outstanding.
Investors weighing whether that margin expansion has room to keep running should look at how the TIKR model prices it. Learn more about the TIKR model’s view on the recovery →
TIKR Values KE Holdings Stock at $30, Pricing In the Margin Recovery
TIKR’s mid-case model values KE Holdings stock at $30 by December 2030, implying 71% total return from the current price of $18, or 13% annualized over 4.4 years.
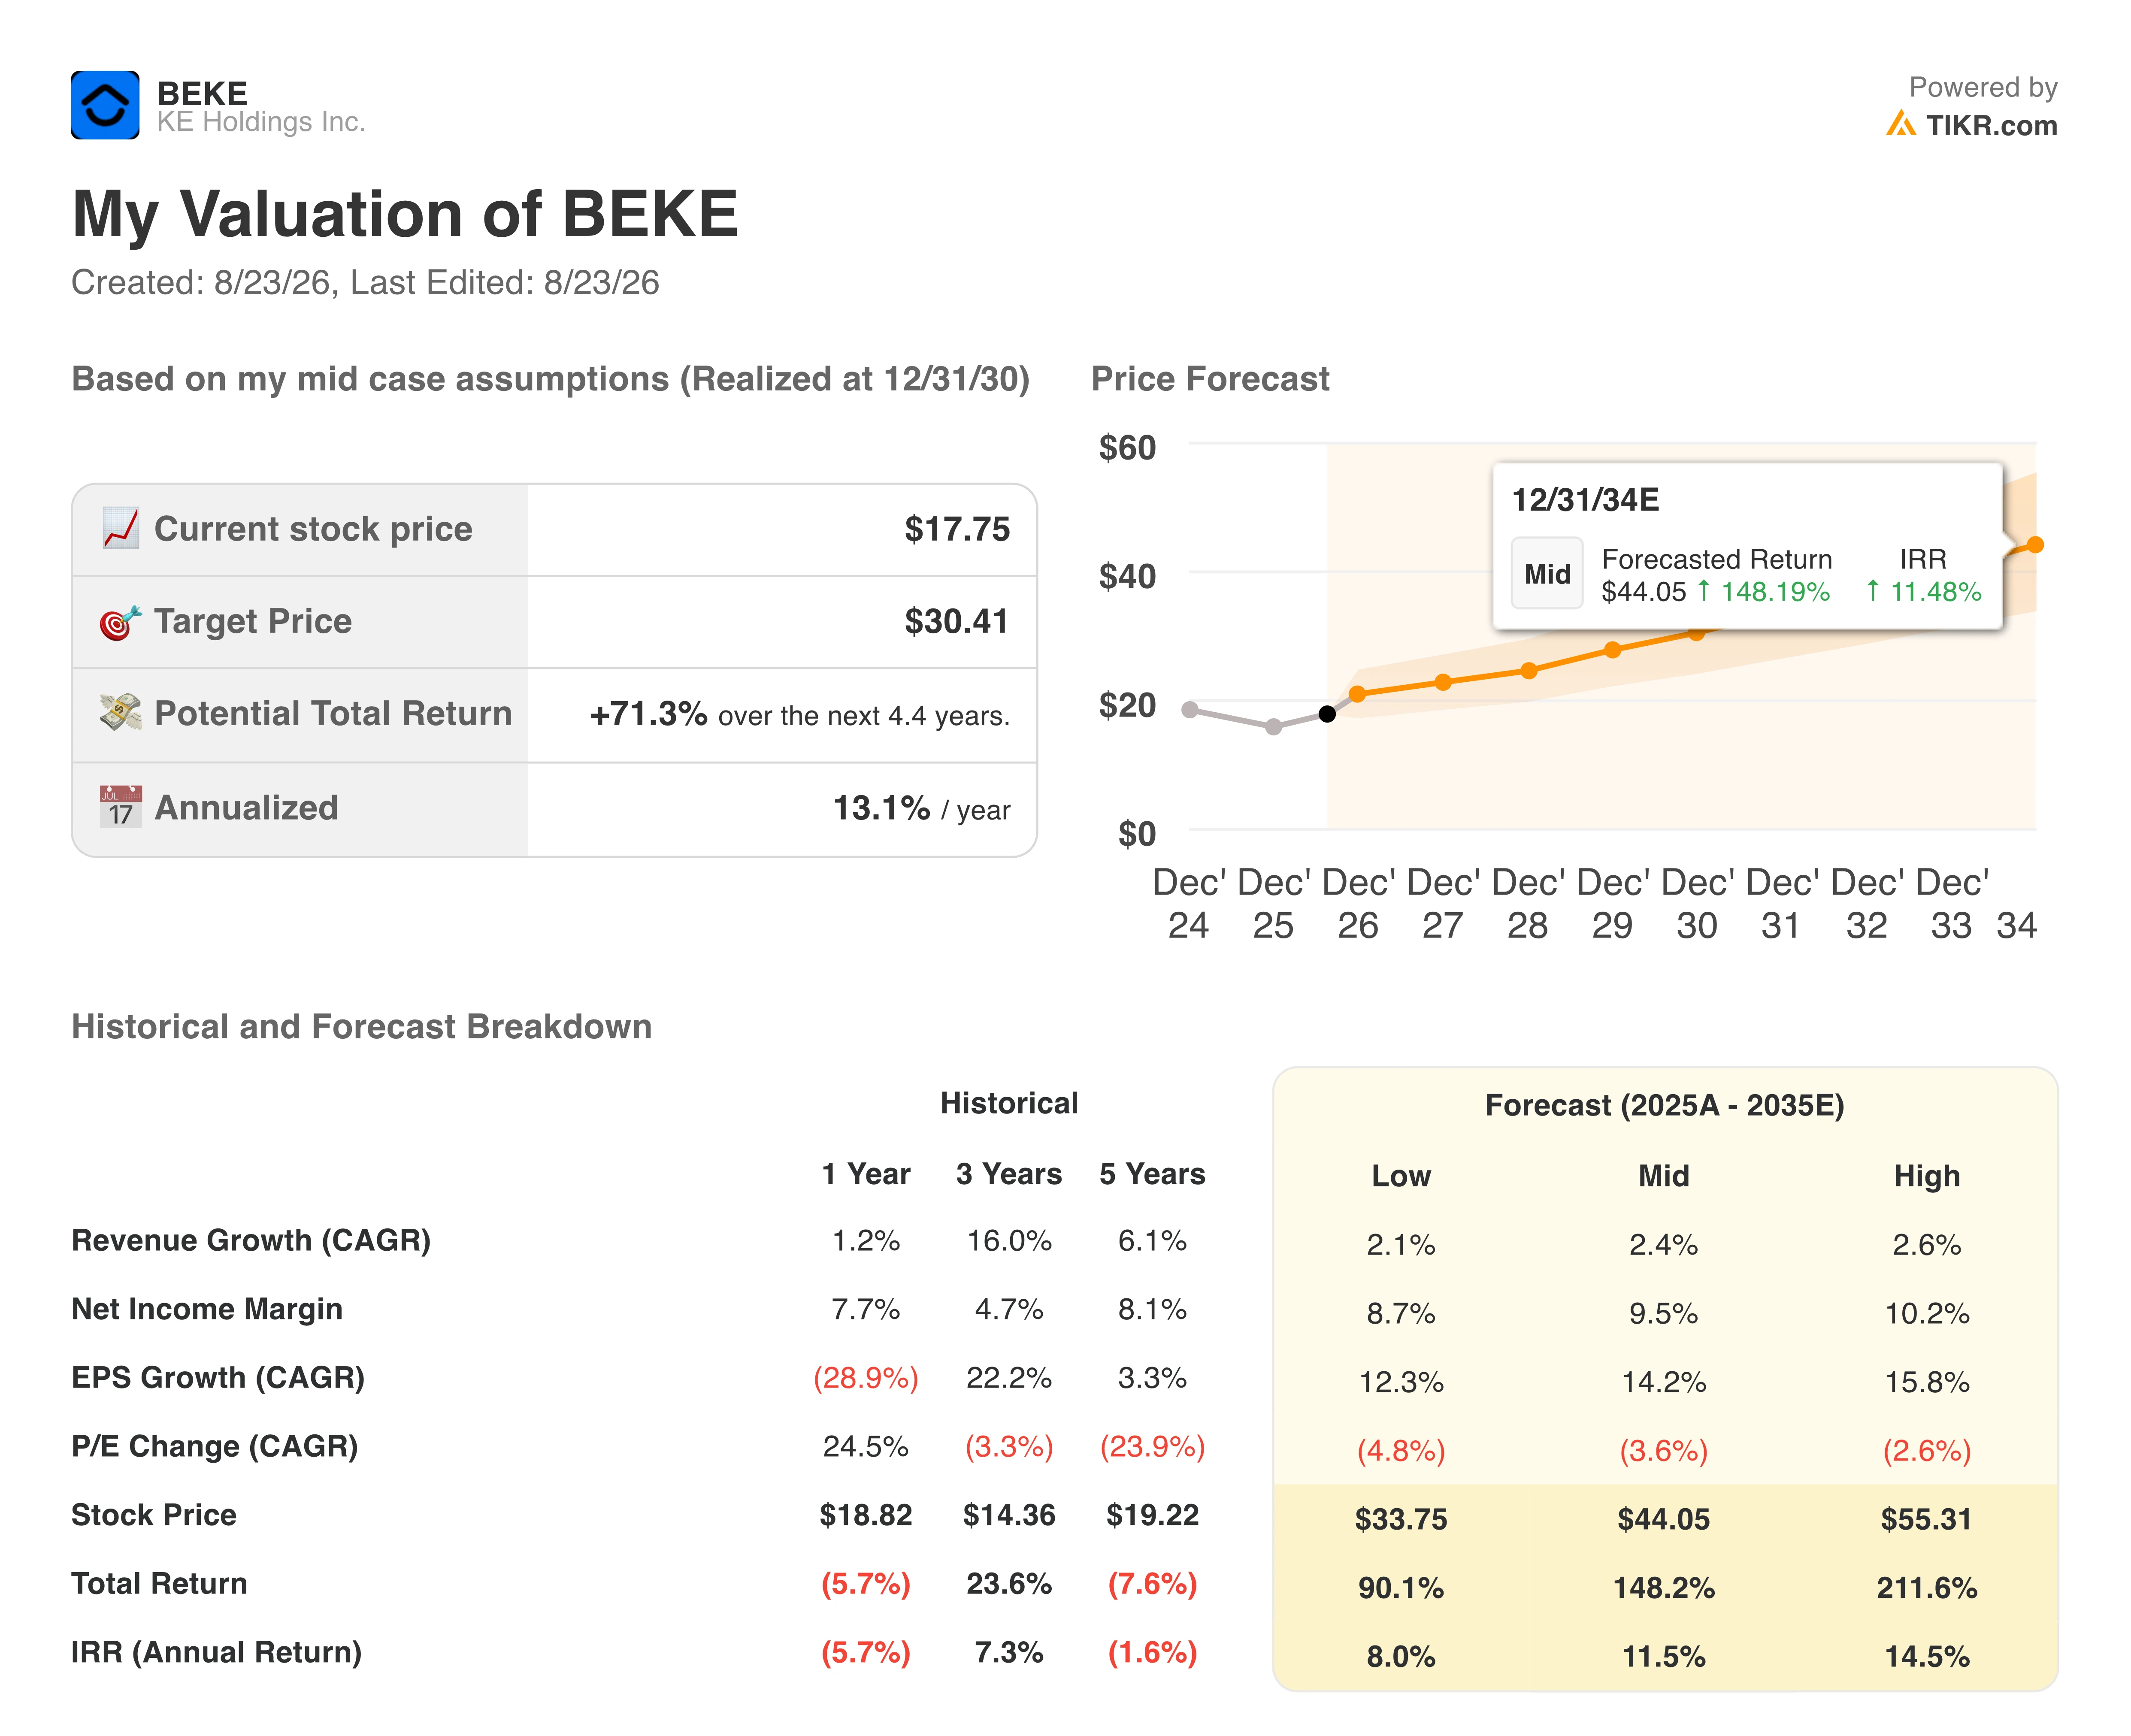
That annualized rate places KE Holdings stock among names the model expects to compound steadily rather than re-rate in a single leg, a return profile built more on earnings growth than multiple expansion.
The target rests on the same margin structure the second quarter just demonstrated: gross margin already at 28.6%, operating expenses down 14.1% year over year, and connected store output rising without added headcount. Continued buyback execution against a RMB 67.3 billion cash position adds a second lever the model captures alongside operating leverage.
KE Holdings stock just showed the market what a 13% annualized path to $30 could look like in a single quarter. See the full model breakdown on TIKR for free →
Should You Invest in KE Holdings Inc.?
The only way to really know is to look at the numbers yourself. TIKR gives you free access to the same institutional-quality financial data that professional analysts use to answer exactly that question.
Pull up KE Holdings Inc. stock and you’ll see years of historical financials, what Wall Street analysts expect for revenue and earnings in the quarters ahead, how valuation multiples have moved over time, and whether price targets are trending up or down.
You can build a free watchlist to track KE Holdings Inc. alongside every other stock on your radar. No credit card required. Just the data you need to decide for yourself.
Access Professional Tools to Analyze BEKE stock on TIKR for Free →
Looking for New Opportunities?
- See what stocks billionaire investors are buying so you can follow the smart money.
- Analyze stocks in as little as 5 minutes with TIKR’s all-in-one, easy-to-use platform.
- The more rocks you overturn… the more opportunities you’ll uncover. Search 100K+ global stocks, global top investor holdings, and more with TIKR.
Disclaimer:
Please note that the articles on TIKR are not intended to serve as investment or financial advice from TIKR or our content team, nor are they recommendations to buy or sell any stocks. We create our content based on TIKR Terminal’s investment data and analysts’ estimates. Our analysis might not include recent company news or important updates. TIKR has no position in any stocks mentioned. Thank you for reading, and happy investing!